Total Glycerides of Biodiesel by Normal Phase HPLC and Corona ultra
Total Glycerides of Biodiesel by Normal Phase HPLC and Corona ultra
Total Glycerides of Biodiesel by Normal Phase HPLC and Corona ultra
- No tags were found...

Create successful ePaper yourself
Turn your PDF publications into a flip-book with our unique Google optimized e-Paper software.
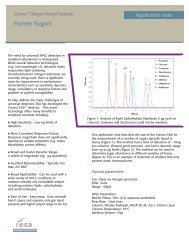
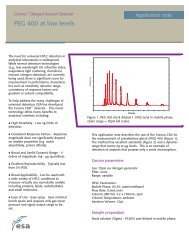
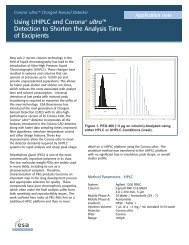
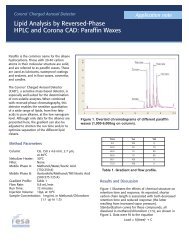
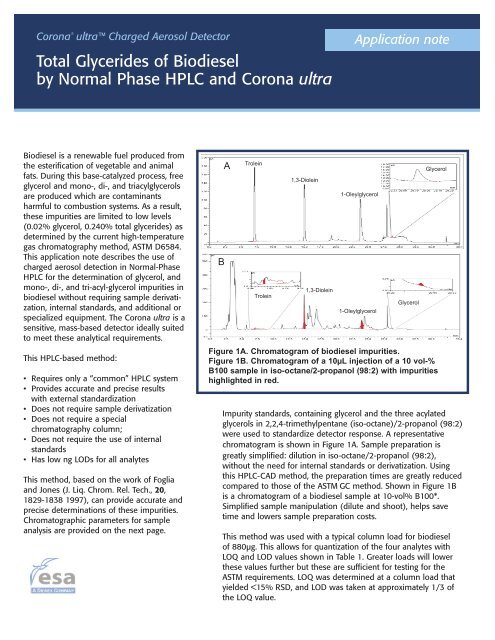
<strong>Corona</strong> ® <strong>ultra</strong> Charged Aerosol Detector<strong>Total</strong> <strong>Glycerides</strong> <strong>of</strong> <strong>Biodiesel</strong><strong>by</strong> <strong>Normal</strong> <strong>Phase</strong> <strong>HPLC</strong> <strong>and</strong> <strong>Corona</strong> <strong>ultra</strong>Application note<strong>Biodiesel</strong> is a renewable fuel produced fromthe esterification <strong>of</strong> vegetable <strong>and</strong> animalfats. During this base-catalyzed process, freeglycerol <strong>and</strong> mono-, di-, <strong>and</strong> triacylglycerolsare produced which are contaminantsharmful to combustion systems. As a result,these impurities are limited to low levels(0.02% glycerol, 0.240% total glycerides) asdetermined <strong>by</strong> the current high-temperaturegas chromatography method, ASTM D6584.This application note describes the use <strong>of</strong>charged aerosol detection in <strong>Normal</strong>-<strong>Phase</strong><strong>HPLC</strong> for the determination <strong>of</strong> glycerol, <strong>and</strong>mono-, di-, <strong>and</strong> tri-acyl-glycerol impurities inbiodiesel without requiring sample derivatization,internal st<strong>and</strong>ards, <strong>and</strong> additional orspecialized equipment. The <strong>Corona</strong> <strong>ultra</strong> is asensitive, mass-based detector ideally suitedto meet these analytical requirements.This <strong>HPLC</strong>-based method:• Requires only a “common” <strong>HPLC</strong> system• Provides accurate <strong>and</strong> precise resultswith external st<strong>and</strong>ardization• Does not require sample derivatization• Does not require a specialchromatography column;• Does not require the use <strong>of</strong> internalst<strong>and</strong>ards• Has low ng LODs for all analytesThis method, based on the work <strong>of</strong> Foglia<strong>and</strong> Jones (J. Liq. Chrom. Rel. Tech., 20,1829-1838 1997), can provide accurate <strong>and</strong>precise determinations <strong>of</strong> these impurities.Chromatographic parameters for sampleanalysis are provided on the next page.BATroleinTrolein1,3-Diolein1,3-Diolein1-Oleylglycerol1-OleylglycerolGlycerolGlycerolFigure 1A. Chromatogram <strong>of</strong> biodiesel impurities.Figure 1B. Chromatogram <strong>of</strong> a 10µL injection <strong>of</strong> a 10 vol-%B100 sample in iso-octane/2-propanol (98:2) with impuritieshighlighted in red.Impurity st<strong>and</strong>ards, containing glycerol <strong>and</strong> the three acylatedglycerols in 2,2,4-trimethylpentane (iso-octane)/2-propanol (98:2)were used to st<strong>and</strong>ardize detector response. A representativechromatogram is shown in Figure 1A. Sample preparation isgreatly simplified: dilution in iso-octane/2-propanol (98:2),without the need for internal st<strong>and</strong>ards or derivatization. Usingthis <strong>HPLC</strong>-CAD method, the preparation times are greatly reducedcompared to those <strong>of</strong> the ASTM GC method. Shown in Figure 1Bis a chromatogram <strong>of</strong> a biodiesel sample at 10-vol% B100*.Simplified sample manipulation (dilute <strong>and</strong> shoot), helps savetime <strong>and</strong> lowers sample preparation costs.This method was used with a typical column load for biodiesel<strong>of</strong> 880µg. This allows for quantization <strong>of</strong> the four analytes withLOQ <strong>and</strong> LOD values shown in Table 1. Greater loads will lowerthese values further but these are sufficient for testing for theASTM requirements. LOQ was determined at a column load thatyielded
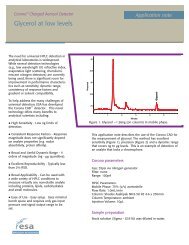
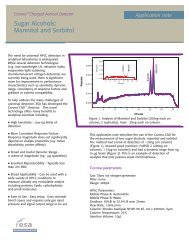
<strong>Corona</strong> <strong>ultra</strong> Charged Aerosol DetectorApplication noteAnalyte LOQ (ng) LOQ (w/w-%) LOD (ng) LOD (w/w-%)Triolein 15 0.002 5 0.00061,3-Diolein 15 0.002 5 0.00061-Oleylglycerol 15 0.002 5 0.0007Glycerol 50 0.006 20 0.002Table 1. LOQ <strong>and</strong> LOD values for different analytes.Method ParametersColumn: *SGE Exsil CN 250 x 4.0 mm, 5 µm, 35°CNebulizer Heater: 30°CFilter:NoneMobile <strong>Phase</strong> A: iso-Octane/HOAc (1000:4)Mobile <strong>Phase</strong> B: iso-Octane/2-Propanol/HOAc (1000:1:4)Mobile <strong>Phase</strong> C: Methyl-t-butyl ether/HOAc (1000:4)Mobile <strong>Phase</strong> D: iso-Octane/n-Butyl acetate/Methanol/HOAc (500:167:333:4)Gradient Pr<strong>of</strong>ile: Table 2Flow Rate: 1.0-1.2 mL/minRun Time: 40 minutesInjection Volume: 10µL at 10°CSample Conc: 100µL <strong>Biodiesel</strong> in 900µL iso-Octane/2-Propanol (98:2)Due to the complex nature <strong>of</strong> the sample matrix, agradient program was created, using four mobile phases:mobile phase A allows for the sample to be loadedwithout splitting the more polar analytes; mobile phase Bprovides additional selectivity over mobile phase A with2-propanol concentrations between 0.1–0.2%; mobilephase C elutes the polar compounds; <strong>and</strong> mobile phaseD elutes the glycerol. Mobile phase C is used again torinse the column <strong>of</strong> any remaining D, <strong>and</strong> then thecolumn is re-conditioned.St<strong>and</strong>ardizationStock st<strong>and</strong>ard solutions were prepared in iso-octane,with glycerol dissolved in 2-propanol, at concentrations<strong>of</strong> 1 mg/mL each. The stock solutions were then dilutedtogether creating a mixed st<strong>and</strong>ard solution <strong>of</strong>approximately 20µg/mL each. The dilution solvent wasiso-octane/2-propanol (98:2). Sequential dilutions weremade with a dilution factor <strong>of</strong> 2. Ten microliters <strong>of</strong> eachst<strong>and</strong>ard solution was injected in triplicate, yielding thecurves shown in Figure 2. Note the uniformity <strong>of</strong>response across the three acylated glycerol st<strong>and</strong>ards.Curve fitting was performed using an “InvertedQuadratic” fit for the alkylated glycerols <strong>and</strong> a quadraticfit for glycerol.Time %A %B %C %D Flow Rate0.00 100 0 0 0 1.05.00 0 98.0 2.0 0 1.07.00 0 95.0 5.0 0 1.015.00 0 92.0 8.0 0 1.017.00 0 65.0 35.0 0 1.023.00 0 50.0 50.0 0 1.023.10 80 0 0 20.0 1.025.00 10 0 0 90.0 1.028.00 10 0 0 90.0 1.028.1 20 0 80.0 0 1.029.00 20 0 80.0 0 1.029.50 100 0 0 0 1.239.00 100 0 0 0 1.239.50 100 0 0 0 1.0Table 2. Gradient conditions.Figure 3. Full-range st<strong>and</strong>ardization curve forTriolein (violet), 1,3-Diolein (green), 1-Oleylglycerol(red), <strong>and</strong> Glycerol (blue).
The <strong>Corona</strong> <strong>ultra</strong>Charged Aerosol DetectorSample AnalysisA sample was prepared <strong>by</strong> dissolving 100µL (88 mg)<strong>of</strong> biodiesel B100* in 900µL <strong>of</strong> iso-octane/2-propanol(98:2). Two injections were made <strong>of</strong> each sample, <strong>and</strong>the peak areas were quantified for impurity content,using st<strong>and</strong>ardization curves containing at least fourst<strong>and</strong>ard concentrations containing the sample peakarea.Results for the sample analysis are shown in Table 3.The last two columns <strong>of</strong> data illustrate that the <strong>HPLC</strong>method using using the ASTM adjustment factorscorrelates well with the <strong>of</strong>ficial ASTM GC method.Impurity<strong>HPLC</strong> Found(µg)<strong>HPLC</strong> ASTMFound (%)GC 1 ASTMFound (%)Triolein 0.0645 0.0008