PEG 400 by UHPLC with corona ultra
PEG 400 by UHPLC with corona ultra
PEG 400 by UHPLC with corona ultra
- No tags were found...

You also want an ePaper? Increase the reach of your titles
YUMPU automatically turns print PDFs into web optimized ePapers that Google loves.
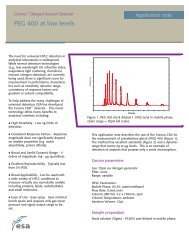
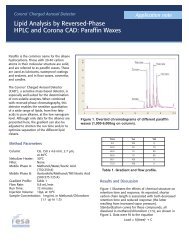
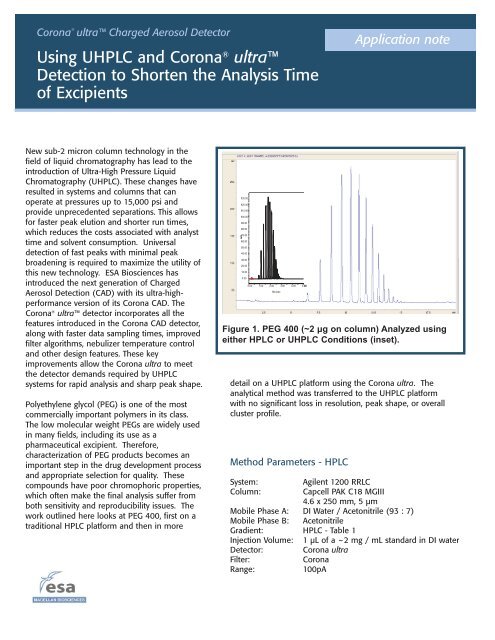
Corona ® <strong>ultra</strong> Charged Aerosol DetectorUsing <strong>UHPLC</strong> and Corona ® <strong>ultra</strong>Detection to Shorten the Analysis Timeof ExcipientsApplication noteNew sub-2 micron column technology in thefield of liquid chromatography has lead to theintroduction of Ultra-High Pressure LiquidChromatography (<strong>UHPLC</strong>). These changes haveresulted in systems and columns that canoperate at pressures up to 15,000 psi andprovide unprecedented separations. This allowsfor faster peak elution and shorter run times,which reduces the costs associated <strong>with</strong> analysttime and solvent consumption. Universaldetection of fast peaks <strong>with</strong> minimal peakbroadening is required to maximize the utility ofthis new technology. ESA Biosciences hasintroduced the next generation of ChargedAerosol Detection (CAD) <strong>with</strong> its <strong>ultra</strong>-highperformanceversion of its Corona CAD. TheCorona ® <strong>ultra</strong> detector incorporates all thefeatures introduced in the Corona CAD detector,along <strong>with</strong> faster data sampling times, improvedfilter algorithms, nebulizer temperature controland other design features. These keyimprovements allow the Corona <strong>ultra</strong> to meetthe detector demands required <strong>by</strong> <strong>UHPLC</strong>systems for rapid analysis and sharp peak shape.Polyethylene glycol (<strong>PEG</strong>) is one of the mostcommercially important polymers in its class.The low molecular weight <strong>PEG</strong>s are widely usedin many fields, including its use as apharmaceutical excipient. Therefore,characterization of <strong>PEG</strong> products becomes animportant step in the drug development processand appropriate selection for quality. Thesecompounds have poor chromophoric properties,which often make the final analysis suffer fromboth sensitivity and reproducibility issues. Thework outlined here looks at <strong>PEG</strong> <strong>400</strong>, first on atraditional HPLC platform and then in more130.00120.00110.00100.00mV90.0080.0070.0060.0050.0040.0030.0020.0010.000.000.00 1.00 2.00 3.00 4.00 5.00MinutesFigure 1. <strong>PEG</strong> <strong>400</strong> (~2 μg on column) Analyzed usingeither HPLC or <strong>UHPLC</strong> Conditions (inset).detail on a <strong>UHPLC</strong> platform using the Corona <strong>ultra</strong>. Theanalytical method was transferred to the <strong>UHPLC</strong> platform<strong>with</strong> no significant loss in resolution, peak shape, or overallcluster profile.Method Parameters - HPLCSystem:Agilent 1200 RRLCColumn:Capcell PAK C18 MGIII4.6 x 250 mm, 5 µmMobile Phase A: DI Water / Acetonitrile (93 : 7)Mobile Phase B: AcetonitrileGradient: HPLC - Table 1Injection Volume: 1 µL of a ~2 mg / mL standard in DI waterDetector: Corona <strong>ultra</strong>Filter:CoronaRange:100pA
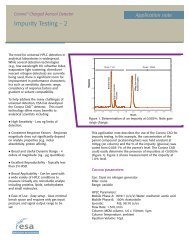
Corona ® <strong>ultra</strong> Charged Aerosol DetectorApplication noteMethod Parameters - <strong>UHPLC</strong>System:Waters Acquity UPLCColumn:Acquity UPLC BEH C182.1 x 50 mm, 1.7 µmMobile Phase A: DI Water / Acetonitrile (93 : 7)Mobile Phase B: AcetonitrileGradient: HPLC - Table 2Injection Volume: 1 µL of a ~2 mg / mL standardin DI waterDetector: Corona <strong>ultra</strong>Filter:MediumRange:200pAResults and DiscussionFigure 1 shows a chromatogram from the <strong>UHPLC</strong>method overlaid onto the HPLC chromatogram <strong>with</strong>a full 20 minute time scale. The resolution for thethird major peak and seventh major peak observedin the cluster for each was calculated, and the comparisonis shown in Table 3. The traditional HPLCapproach did achieve superior resolution for bothpeaks, however the resolution for the <strong>UHPLC</strong>method was <strong>with</strong>in 70% of the HPLC method <strong>with</strong> afour-fold reduction in analysis time and solventconsumption.TimeFlow Rate% B(min)(mL/min)0 3 115 30 117 3 1Table 1 - HPLC Gradient.TimeFlow Rate% B(min)(mL/min)0 3 0.051 10 12.4 20 13 30 13.4 3 0.5Table 2. <strong>UHPLC</strong> Gradient.Peak 3 Peak 7HPLC UPLC HPLC UPLCRetention Time (min) 8.67 1.35 12.42 2.24Resolution 7.8 5.6 4.1 3.4Table 3. Comparison of Resolution Between HPLCand <strong>UHPLC</strong> for Two Selected Analytes.Figure 2. Overlay of Four Individual Analytical Runs on the <strong>UHPLC</strong> Corona <strong>ultra</strong> System.
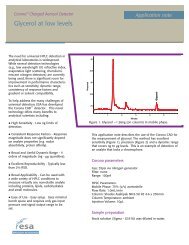
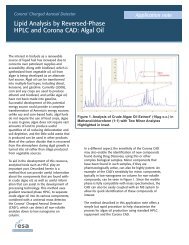
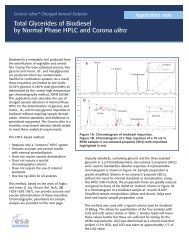
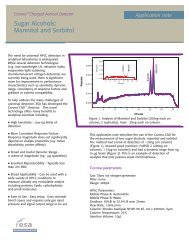
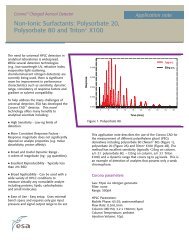
Corona ® <strong>ultra</strong> Charged Aerosol DetectorApplication noteThe <strong>UHPLC</strong> method reproducibility is shown Figure2, <strong>with</strong> overlays of four injections of a 2 µg <strong>PEG</strong> <strong>400</strong>standard on column <strong>with</strong> the calculated %RSD foreach peak is represented in Table 4. A responsecurve was then prepared from ~2 to 2000 µg/mL. Alimit of quantification for the <strong>PEG</strong> <strong>400</strong> cluster wasobserved at ~18 ng total mass on column, which isshown in Figure 3. The prepared standards wereanalyzed, and the peak area versus the total masson column is plotted in Figure 4. Assuming that theaverage %-area for each peak from the 2 µg oncolumn injections can be used to adjust for themass on column for each peak over the entirecalibration range, a new adjusted response curvewas calculated and is plotted in Figure 5. This wasdone to illustrate the uniformity of response of theCorona CAD for the different MW fractions of <strong>PEG</strong><strong>400</strong>.Retention TimeResponse(min)(peak area)% RSD1.11 1124 1.68%1.34 2596 1.73%1.56 2282 1.09%1.76 3050 1.32%1.94 1010 0.46%2.09 1730 0.95%2.24 1941 1.48%2.37 649 0.76%2.49 669 1.35%2.60 320 1.29%Table 4. Reproducibility of Ten <strong>PEG</strong> <strong>400</strong>Analytes (n=4).0.200.00-0.20-0.40-0.60mV-0.80-1.00-1.20-1.40-1.600.00 0.20 0.40 0.60 0.80 1.00 1.20 1.40 1.60 1.80 2.00 2.20 2.40 2.60 2.80 3.00 3.20 3.40 3.60 3.80 4.00 4.20 4.40 4.60 4.80 5.00MinutesFigure 3. High Sensitivity Analysis of <strong>PEG</strong> <strong>400</strong> on the <strong>UHPLC</strong> Corona <strong>ultra</strong> System(~18 ng total, on column).
The Corona ® <strong>ultra</strong>Charged Aerosol DetectorResponse (peak area)3000002500002000001500001000005000001.11 min 1.34 min 1.56 min 1.76 min 1.94 min 2.09 min 2.24 min 2.37 min 2.49 min 2.60 minR 2 = 0.9945R 2 = 0.9925R 2 = 0.9944R 2 = 0.9949R 2 = 0.9965R 2 = 0.9965R 2 = 0.9992R 2 = 0.9991R 2 = 0.9998R 2 = 0.9990 500 1000 1500 2000 2500Total Mass on Column (ng)Figure 4. Response Curves for 18 ng to 2 μg Total Mass (oncolumn).ConclusionSensitive methods for the analysis of <strong>PEG</strong><strong>400</strong> can be obtained <strong>by</strong> either HPLC or<strong>UHPLC</strong> <strong>with</strong> Charged Aerosol Detection.The transfer of the method from HPLC to<strong>UHPLC</strong> offered a four-fold decrease inanalysis time and solvent consumption.The ability to detect low nanogramquantities of <strong>PEG</strong> <strong>400</strong> <strong>with</strong> limits ofdetection