Simultaneous Analysis of Glycerides and Free Fatty Acids in Palm Oil
Simultaneous Analysis of Glycerides and Free Fatty Acids in Palm Oil
Simultaneous Analysis of Glycerides and Free Fatty Acids in Palm Oil

Create successful ePaper yourself
Turn your PDF publications into a flip-book with our unique Google optimized e-Paper software.
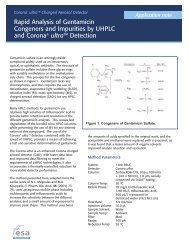
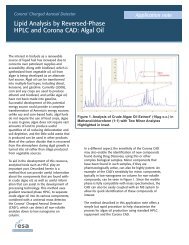
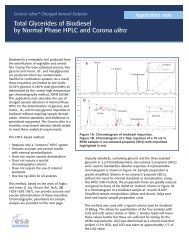
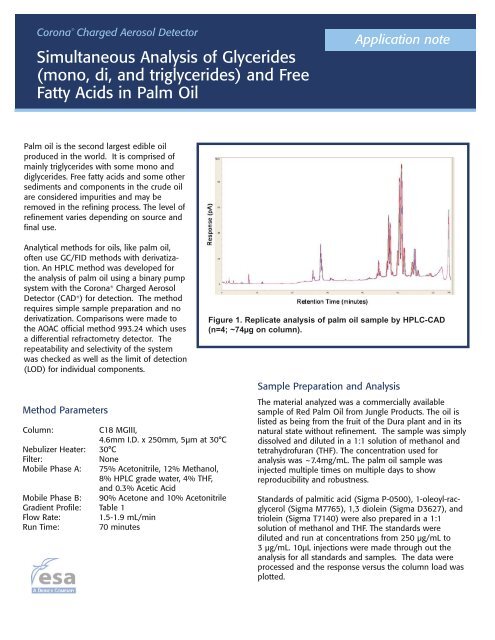
Corona ® Charged Aerosol Detector<strong>Simultaneous</strong> <strong>Analysis</strong> <strong>of</strong> <strong>Glycerides</strong>(mono, di, <strong>and</strong> triglycerides) <strong>and</strong> <strong>Free</strong><strong>Fatty</strong> <strong>Acids</strong> <strong>in</strong> <strong>Palm</strong> <strong>Oil</strong>Application note<strong>Palm</strong> oil is the second largest edible oilproduced <strong>in</strong> the world. It is comprised <strong>of</strong>ma<strong>in</strong>ly triglycerides with some mono <strong>and</strong>diglycerides. <strong>Free</strong> fatty acids <strong>and</strong> some othersediments <strong>and</strong> components <strong>in</strong> the crude oilare considered impurities <strong>and</strong> may beremoved <strong>in</strong> the ref<strong>in</strong><strong>in</strong>g process. The level <strong>of</strong>ref<strong>in</strong>ement varies depend<strong>in</strong>g on source <strong>and</strong>f<strong>in</strong>al use.Analytical methods for oils, like palm oil,<strong>of</strong>ten use GC/FID methods with derivatization.An HPLC method was developed forthe analysis <strong>of</strong> palm oil us<strong>in</strong>g a b<strong>in</strong>ary pumpsystem with the Corona ® Charged AerosolDetector (CAD ® ) for detection. The methodrequires simple sample preparation <strong>and</strong> noderivatization. Comparisons were made tothe AOAC <strong>of</strong>ficial method 993.24 which usesa differential refractometry detector. Therepeatability <strong>and</strong> selectivity <strong>of</strong> the systemwas checked as well as the limit <strong>of</strong> detection(LOD) for <strong>in</strong>dividual components.Figure 1. Replicate analysis <strong>of</strong> palm oil sample by HPLC-CAD(n=4; ~74µg on column).Method ParametersColumn:C18 MGIII,4.6mm I.D. x 250mm, 5µm at 30°CNebulizer Heater: 30°CFilter:Mobile Phase A:None75% Acetonitrile, 12% Methanol,8% HPLC grade water, 4% THF,<strong>and</strong> 0.3% Acetic AcidMobile Phase B: 90% Acetone <strong>and</strong> 10% AcetonitrileGradient Pr<strong>of</strong>ile: Table 1Flow Rate: 1.5-1.9 mL/m<strong>in</strong>Run Time: 70 m<strong>in</strong>utesSample Preparation <strong>and</strong> <strong>Analysis</strong>The material analyzed was a commercially availablesample <strong>of</strong> Red <strong>Palm</strong> <strong>Oil</strong> from Jungle Products. The oil islisted as be<strong>in</strong>g from the fruit <strong>of</strong> the Dura plant <strong>and</strong> <strong>in</strong> itsnatural state without ref<strong>in</strong>ement. The sample was simplydissolved <strong>and</strong> diluted <strong>in</strong> a 1:1 solution <strong>of</strong> methanol <strong>and</strong>tetrahydr<strong>of</strong>uran (THF). The concentration used foranalysis was ~7.4mg/mL. The palm oil sample was<strong>in</strong>jected multiple times on multiple days to showreproducibility <strong>and</strong> robustness.St<strong>and</strong>ards <strong>of</strong> palmitic acid (Sigma P-0500), 1-oleoyl-racglycerol(Sigma M7765), 1,3 diole<strong>in</strong> (Sigma D3627), <strong>and</strong>triole<strong>in</strong> (Sigma T7140) were also prepared <strong>in</strong> a 1:1solution <strong>of</strong> methanol <strong>and</strong> THF. The st<strong>and</strong>ards werediluted <strong>and</strong> run at concentrations from 250 µg/mL to3 µg/mL. 10µL <strong>in</strong>jections were made through out theanalysis for all st<strong>and</strong>ards <strong>and</strong> samples. The data wereprocessed <strong>and</strong> the response versus the column load wasplotted.
Corona ® Charged Aerosol DetectorApplication noteTime %A %B Flow Rate0.00 100 0 1.55.00 100 0 1.511.00 96 4 1.524.00 37 63 1.535.00 32 68 1.545.00 18 82 1.958.00 15 85 1.960.00 5 95 1.563.00 100 0 1.565.00 100 0 1.5Table 1. Gradient Conditions.Results <strong>and</strong> DiscussionReproducibility <strong>of</strong> the method was tested by compar<strong>in</strong>gfour different <strong>in</strong>jections <strong>of</strong> the palm oil sample at 74µgcolumn load. The peak areas for an <strong>in</strong>dividual peak aswell as groups <strong>of</strong> peaks were observed <strong>and</strong> the resultsare shown <strong>in</strong> Table 2. The peak retention times exhibitedless than 1% variation over the gradient run for allsamples observed. Four overlays <strong>of</strong> the palm oil areshown <strong>in</strong> Figure 1. The chromatograms for the fourst<strong>and</strong>ards run are illustrated <strong>in</strong> Figures 2A <strong>and</strong> 2B. Thecorrelation is done us<strong>in</strong>g a polynomial fit <strong>and</strong> was greaterthen >0.999 for all po<strong>in</strong>ts (Figure 3). The LOD <strong>of</strong> the was