
Create successful ePaper yourself
Turn your PDF publications into a flip-book with our unique Google optimized e-Paper software.
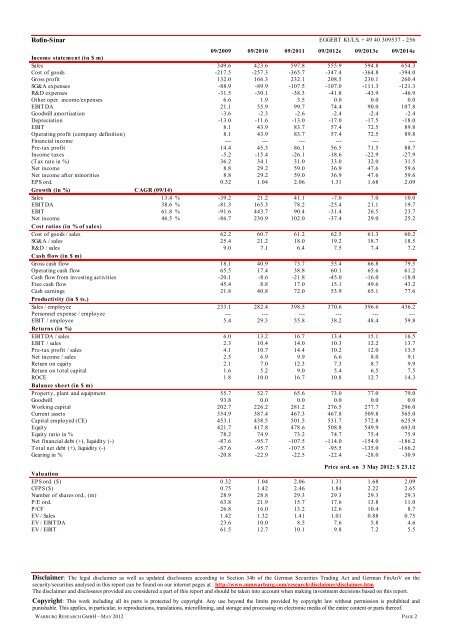
<strong>Rofin</strong>-<strong>Sinar</strong> EGGERT KULS, + 49 40 309537 - 256<br />
09/2009 09/2010 09/2011 09/2012e 09/2013e 09/2014e<br />
Income statement (in $ m)<br />
Sales 349.6 423.6 597.8 555.9 594.8 654.3<br />
Cost of goods -217.5 -257.3 -365.7 -347.4 -364.8 -394.0<br />
Gross profit 132.0 166.3 232.1 208.5 230.1 260.4<br />
SG&A expenses -88.9 -89.9 -107.5 -107.0 -111.3 -121.3<br />
R&D expenses -31.5 -30.1 -38.3 -41.8 -43.9 -46.9<br />
Other oper. income/expenses 6.6 1.9 3.5 0.0 0.0 0.0<br />
EBITDA 21.1 55.9 99.7 74.4 90.0 107.8<br />
Goodwill amortisation -3.6 -2.3 -2.6 -2.4 -2.4 -2.4<br />
Depreciation -13.0 -11.6 -13.0 -17.0 -17.5 -18.0<br />
EBIT 8.1 43.9 83.7 57.4 72.5 89.8<br />
Operating profit (company definition) 8.1 43.9 83.7 57.4 72.5 89.8<br />
Financial income --- --- --- --- --- ---<br />
Pre-tax profit 14.4 45.3 86.1 56.5 71.5 88.7<br />
Income taxes -5.2 -15.4 -26.1 -18.6 -22.9 -27.9<br />
(Tax rate in %) 36.2 34.1 31.0 33.0 32.0 31.5<br />
Net income 8.8 29.2 59.0 36.9 47.6 59.6<br />
Net income after minorities 8.8 29.2 59.0 36.9 47.6 59.6<br />
EPS ord. 0.32 1.04 2.06 1.31 1.68 2.09<br />
Growth (in %) CAGR (09/14)<br />
Sales 13.4 % -39.2 21.2 41.1 -7.0 7.0 10.0<br />
EBITDA 38.6 % -81.3 165.3 78.2 -25.4 21.1 19.7<br />
EBIT 61.8 % -91.6 443.7 90.4 -31.4 26.5 23.7<br />
Net income<br />
Cost ratios (in % of sales)<br />
46.5 % -86.7 230.9 102.0 -37.4 29.0 25.2<br />
Cost of goods / sales 62.2 60.7 61.2 62.5 61.3 60.2<br />
SG&A / sales 25.4 21.2 18.0 19.2 18.7 18.5<br />
R&D / sales<br />
Cash flow (in $ m)<br />
9.0 7.1 6.4 7.5 7.4 7.2<br />
Gross cash flow 18.1 40.9 73.7 55.4 66.8 79.5<br />
Operating cash flow 65.5 17.4 38.8 60.1 65.6 61.2<br />
Cash flow from investing activities -20.1 -8.6 -21.8 -45.0 -16.0 -18.0<br />
Free cash flow 45.4 8.8 17.0 15.1 49.6 43.2<br />
Cash earnings<br />
Productivity (in $ ts.)<br />
21.8 40.8 72.0 53.9 65.1 77.6<br />
Sales / employee 233.1 282.4 398.5 370.6 396.6 436.2<br />
Personnel expense / employee --- --- --- --- --- ---<br />
EBIT / employee<br />
Returns (in %)<br />
5.4 29.3 55.8 38.2 48.4 59.8<br />
EBITDA / sales 6.0 13.2 16.7 13.4 15.1 16.5<br />
EBIT / sales 2.3 10.4 14.0 10.3 12.2 13.7<br />
Pre-tax profit / sales 4.1 10.7 14.4 10.2 12.0 13.5<br />
Net income / sales 2.5 6.9 9.9 6.6 8.0 9.1<br />
Return on equity 2.1 7.0 12.3 7.3 8.7 9.9<br />
Return on total capital 1.6 5.2 9.0 5.4 6.5 7.5<br />
ROCE<br />
Balance sheet (in $ m)<br />
1.8 10.0 16.7 10.8 12.7 14.3<br />
Property, plant and equipment 55.7 52.7 65.6 73.0 77.0 79.0<br />
Goodwill 93.8 0.0 0.0 0.0 0.0 0.0<br />
Working capital 202.7 226.2 281.2 276.5 277.7 296.0<br />
Current assets 354.9 387.4 467.3 467.8 509.8 565.0<br />
Capital employed (CE) 453.1 438.5 501.5 531.7 572.8 625.9<br />
Equity 421.7 417.8 478.6 508.8 549.9 603.0<br />
Equity ratio in % 78.2 74.9 73.2 74.7 75.4 75.9<br />
Net financial debt (+), liquidity (-) -87.6 -95.7 -107.5 -114.0 -154.0 -186.2<br />
Total net debt (+), liquidity (-) -87.6 -95.7 -107.5 -95.5 -135.0 -166.2<br />
Gearing in % -20.8 -22.9 -22.5 -22.4 -28.0 -30.9<br />
Price ord. on 3 May 2012: $ 23.12<br />
Valuation<br />
EPS ord. ($) 0.32 1.04 2.06 1.31 1.68 2.09<br />
CFPS ($) 0.75 1.42 2.46 1.84 2.22 2.65<br />
Number of shares ord., (m) 28.9 28.8 29.3 29.3 29.3 29.3<br />
P/E ord. 63.8 21.9 15.7 17.6 13.8 11.0<br />
P/CF 26.8 16.0 13.2 12.6 10.4 8.7<br />
EV / Sales 1.42 1.32 1.41 1.01 0.88 0.75<br />
EV / EBITDA 23.6 10.0 8.5 7.6 5.8 4.6<br />
EV / EBIT 61.5 12.7 10.1 9.8 7.2 5.5<br />
Disclaimer: The legal disclaimer as well as updated disclosures according to Section 34b of the German Securities Trading Act and German FinAnV on the<br />
security/securities analysed in this report can be found on our internet pages at : http://www.mmwarburg.com/research/disclaimer/disclaimer.htm<br />
The disclaimer and disclosures provided are considered a part of this report and should be taken into account when making investment decisions based on this report.<br />
Copyright: This work including all its parts is protected by copyright. Any use beyond the limits provided by copyright law without permission is prohibited and<br />
punishable. This applies, in particular, to reproductions, translations, microfilming, and storage and processing on electronic media of the entire content or parts thereof.<br />
WARBURG RESEARCH GMBH – MAY 2012 PAGE 2