
Create successful ePaper yourself
Turn your PDF publications into a flip-book with our unique Google optimized e-Paper software.
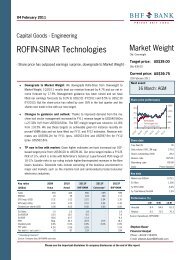
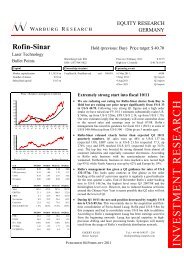
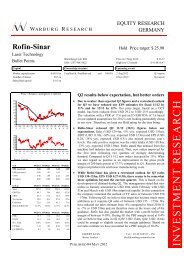
<strong>Rofin</strong>-Sinar<br />
(CDAX, Technology)<br />
Hold<br />
USD 22.00<br />
Eggert Kuls<br />
ekuls@warburg-research.com<br />
+49 (0)40-309537-256<br />
(USD 25.90)<br />
Price EUR 17.31<br />
Upside 27.1 %<br />
Value Indicators: USD Share data: Description:<br />
DCF: 25.81<br />
FCF-Value Potential: 21.94<br />
Bloomberg: RSI GR<br />
Reuters: RSTI<br />
ISIN: US7750431022<br />
C O M M E N T Published 03.08.2012 1<br />
<strong>Rofin</strong>-Sinar is one of the two<br />
worldwide leading manufacturer of<br />
industrial laser equipment<br />
Market Snapshot: USD m Shareholders: Risk Profile (WRe): 2011/12e<br />
Market cap: 499 Freefloat 100.0 % Beta: 1.1<br />
No. of shares (m): 29<br />
Price / Book: 1.0<br />
EV: 426<br />
Net Gearing: -15 %<br />
Freefloat MC (ord.): 499<br />
Debt / Equity: 32 %<br />
Ø Trad. Vol. (ord./30d): 3.20 m<br />
Net debt / EBITDA: -1.3 x<br />
<strong>Rofin</strong>-Sinar to clearly miss sales guidance; Share buy-back announced<br />
Stated Figures Q3/2012: Comment on Figures:<br />
FY End: 30.9.<br />
in USD m<br />
Q3<br />
2012<br />
Q3<br />
2012e<br />
Q3<br />
2011 yoy<br />
9M<br />
2012<br />
9M<br />
2012e<br />
9M<br />
2011 yoy<br />
� Sales missed our expectation slightly, mainly due to a higher than<br />
expected negative currency impact of up to USD 9m<br />
� Profit figures were also slightly lower than our forecast due to lower<br />
gross profit margin and higher R&D expenses<br />
� Order intake of USD 135.3m was clearly below our quarterly forecast of<br />
USD 150m as the cyclical Laser equipment business suffered from the<br />
increasingly tough economic environment<br />
Sales 132 134 155 -15.0 % 393 395 428 -8.3 %<br />
EBIT 12 13 22 -44.7 % 35 36 62 -43.5<br />
Margin 9.1 % 9.8 % 14.1 % 8.9 % 9.1 % 14.4 % %<br />
Net income 8 9 15 -45.2 % 24 25 43 -42.9<br />
Margin 6.3 % 6.5 % 9.8 % 6.2 % 6.3 % 10.0 % %<br />
EPS 0.29 0.30 0.53 -45.0 % 0.85 0.86 2.50 -66.0<br />
%<br />
� Q3 turnover was burdened to the tune of USD 8.5–9.0m by the strong USD. <strong>Rofin</strong>-Sinar pointed out that business with the semiconductor<br />
industry was excellent in the quarter but is expected to slow down going forward. Region-wise North America was strong with an increase of<br />
18% while Europe and Asia were down 12% and 14% respectively. Order intake for fibre laser, the most modern laser technology, amounted<br />
to USD 24.5m or 18% of total in the quarter. Lower than expected order intake will very probably lead to Q4 figures on the quarterly levels of<br />
Q1 to Q3 only. This means that the company will significantly miss its former sales guidance of USD 550–570m for FY 2011/12. Three<br />
months ago management was rather convinced that things would improve significantly in Q4. In our view, this improvement is unlikely<br />
because of the worsening worldwide economic environment and as the Laser equipment business is extremely cyclical. While the order<br />
intake especially is bad news, we regard as positive the announcement that the company will buy back shares to the value of up to USD 20m<br />
over the next 12 months. Based on the current share price <strong>Rofin</strong>-Sinar could buy back up to 1.2m shares which is equivalent to ca. 4% of the<br />
current share capital. The share is trading at book value. <strong>Rofin</strong>-Sinar can easily afford the share buy back as net cash as of June 30 stood at<br />
USD 80.5m or USD 2.80 per share. Q4 guidance includes sales of USD 125–130m and EPS of USD 0.25–0.28. This translates into FY sales<br />
of between USD 518–523m and EPS of USD 1.10–1.13.<br />
� In accordance with estimates we have lowered our price target from USD 25.90 to 22.00. As we see no positive trigger for the share short<br />
term we keep our Hold rating for the time being. The start to the next business year 2012/13 will most probably also be sluggish.<br />
Changes in Estimates: Comment on Changes:<br />
FY End: 30.9.<br />
in USD m<br />
2011/12e<br />
(old)<br />
+ / - 2012/13e<br />
(old)<br />
+ / - 2013/14e<br />
(old)<br />
Sales 556 -6.2 % 595 -6.2 % 654 -6.2 %<br />
EBIT 57 -20.8 % 73 -18.3 % 90 -16.7 %<br />
EPS 1.31 -14.9 % 1.68 -18.1 % 2.09 -16.6 %<br />
DPS 0.00 0.0 % 0.00 0.0 % 0.00 0.0 %<br />
Net Debt -92 n.m. -131 n.m. -162 n.m.<br />
Rel. Performance vs CDAX:<br />
1 month: -10.4 %<br />
6 months: -32.1 %<br />
Year to date: -36.7 %<br />
Trailing 12 months: -40.0 %<br />
Company events:<br />
11/08/12 Q4<br />
11/29/12 2011/2012<br />
FY End: 30.9.<br />
in USD m<br />
+ / -<br />
� Weak order intake in Q3 has prompted us to revise down our<br />
assumptions for Q4. We now expect turnover of USD 521m in FY<br />
2011/12, down 6.2% compared to our former estimate. This also means<br />
that <strong>Rofin</strong> will clearly miss the sales guidance of USD 550–570m<br />
reiterated in May.<br />
� Earnings figures are also lowered due to our revised sales assumptions<br />
CAGR<br />
(11-14e) 2007/08 2008/09 2009/10 2010/11 2011/12e 2012/13e 2013/14e<br />
Sales 0.9 % 575 350 424 598 521 558 614<br />
Change Sales yoy 19.9 % -39.2 % 21.2 % 41.1 % -12.8 % 7.0 % 10.0 %<br />
Gross profit margin 43.1 % 37.8 % 39.3 % 38.8 % 37.1 % 38.2 % 39.4 %<br />
EBITDA -2.6 % 119 21 56 97 59 73 89<br />
Margin 20.8 % 6.0 % 13.1 % 16.2 % 11.3 % 13.1 % 14.5 %<br />
EBIT -3.7 % 96 8 44 84 45 59 75<br />
Margin 16.7 % 2.3 % 10.4 % 14.0 % 8.7 % 10.6 % 12.2 %<br />
Net income -5.7 % 65 9 30 60 29 40 50<br />
EPS -5.4 % 2.09 0.32 1.04 2.06 1.12 1.37 1.75<br />
EPS adj. - n.a. n.a. n.a. n.a. n.a. n.a. n.a.<br />
DPS - 0.00 0.00 0.00 0.00 0.00 0.00 0.00<br />
Dividend Yield 0.0 % 0.0 % 0.0 % 0.0 % 0.0 % 0.0 % 0.0 %<br />
FCFPS 2.98 1.30 1.00 0.75 -0.48 1.01 0.61<br />
EV / Sales 1.6 x 1.5 x 1.4 x 1.4 x 0.8 x 0.7 x 0.6 x<br />
EV / EBITDA 7.5 x 24.9 x 10.6 x 8.9 x 7.2 x 5.4 x 4.2 x<br />
EV / EBIT 9.3 x 65.0 x 13.4 x 10.2 x 9.4 x 6.7 x 5.1 x<br />
P / E 14.6 x 63.9 x 21.9 x 15.7 x 15.5 x 12.6 x 9.9 x<br />
P / E adj. n.a. n.a. n.a. n.a. n.a. n.a. n.a.<br />
FCF Yield Potential 8.4 % 3.3 % 6.1 % 7.6 % 8.3 % 11.6 % 15.0 %<br />
Net Debt -38 -70 -77 -90 -77 -110 -131<br />
ROE 15.3 % 2.2 % 7.2 % 13.5 % 5.9 % 7.7 % 9.1 %<br />
ROCE n.a. 1.1 % 6.3 % 12.0 % 5.5 % 7.3 % 8.6 %<br />
Guidance: Fiscal 11/12: Sales between USD 518-523m, PBT-margin 9-10%
<strong>Rofin</strong>-Sinar<br />
Sales development<br />
in EUR m<br />
Source: Warburg Research<br />
Company Background<br />
Sales by regions<br />
2011; in %<br />
Source: Warburg Research<br />
C O M M E N T Published 03.08.2012 2<br />
EBIT development<br />
in EUR m<br />
Source: Warburg Research<br />
� Laser technology company <strong>Rofin</strong>-Sinar was founded in 1975. In 1996 the company was listed on the American technology stock<br />
exchange, Nasdaq, as the first 100% spin-off of Siemens AG.<br />
� The company has production sites in the USA, Germany, UK, Finland, Sweden, Spain, Singapore and China. The two operating<br />
headquarters are based in Plymouth (Michigan, USA) and Hamburg.<br />
� <strong>Rofin</strong>-Sinar develops and produces laser sources and laser-based system solutions. The technology basis includes CO2 laser, lamp<br />
and diode-pumped solid-state lasers as well as fibre and diode lasers.<br />
� In addition to its main customer industries, automotive, machine tools as well as semiconductors and electronics, <strong>Rofin</strong>-Sinar supplies<br />
various other industries.<br />
Competitive Quality<br />
� With a world market share of ca. 23% <strong>Rofin</strong>-Sinar is the clear world market leader in industrial lasers together with the non-listed<br />
Trumpf (Germany).<br />
� The most important competitors in macro applications are Trumpf, Fanuc, Coherent and Synrad for CO2 lasers and Laserline and<br />
Jenoptik for diode lasers.<br />
� In the Micro and Marking segments the main competitors are Trumpf, GSI Group, Unitek Miyachi, Lasag, IPG and Control Laser.<br />
� IPG Photonics is market leader in the field of fibre lasers. This technology in part has advantages over the common laser technologies<br />
such as improved energy efficiency. <strong>Rofin</strong>-Sinar is the No. 2 here.<br />
� In the past the sector generally grew by ca. 10% p.a. and more over an economic cycle. Growth in the laser industry benefits from a<br />
continuous expansion of the application possibilities.<br />
EBT development<br />
in EUR m<br />
Source: Warburg Research<br />
Sales by segments<br />
2011; in %<br />
Source: Warburg Research<br />
Net income development<br />
in EUR m<br />
Source: Warburg Research
<strong>Rofin</strong>-Sinar<br />
DCF model<br />
Detailed forecast period Transitional period Term. Value<br />
Figures in USD m 2011/12 2012/13e 2013/14e 2014/15e 2015/16e 2016/17e 2017/18e 2018/19e 2019/20e 2020/21e 2021/22e 2022/23e 2023/24<br />
Sales<br />
e<br />
521 558 614 663 716 773 835 901 974 1,051 1,136 1,192<br />
e<br />
1,252<br />
Sales change -12.8 % 7.0 % 10.0 % 8.0 % 8.0 % 8.0 % 8.0 % 8.0 % 8.0 % 8.0 % 8.0 % 5.0 % 5.0 % 2.5 %<br />
EBIT 45 59 75 80 86 93 100 108 117 126 136 143 150<br />
EBIT-margin 8.7 % 10.6 % 12.2 % 12.0 % 12.0 % 12.0 % 12.0 % 12.0 % 12.0 % 12.0 % 12.0 % 12.0 % 12.0 %<br />
Tax rate (EBT) 35.6 % 32.2 % 31.6 % 32.0 % 32.0 % 32.0 % 32.0 % 32.0 % 32.0 % 32.0 % 32.0 % 32.0 % 32.0 %<br />
NOPAT 29 40 51 54 58 63 68 74 79 86 93 97 102<br />
Depreciation 14 14 15 16 17 19 20 22 23 25 27 27 29<br />
in % of Sales 2.6 % 2.5 % 2.4 % 2.4 % 2.4 % 2.4 % 2.4 % 2.4 % 2.4 % 2.4 % 2.4 % 2.3 % 2.3 %<br />
Changes in provisions 0 1 1 -20 0 0 0 0 0 0 0 0 0<br />
Change in Liquidity from<br />
- Working Capital 1,962 3,271 4,978 2 24 26 28 30 32 35 38 26 27<br />
- Capex 16 17 18 19 20 22 23 25 27 29 32 32 34<br />
Capex in % of Sales 3.1 % 3.0 % 2.9 % 2.8 % 2.8 % 2.8 % 2.8 % 2.8 % 2.8 % 2.8 % 2.8 % 2.7 % 2.7 %<br />
Other 1,149 3,902 5,797 0 0 0 0 0 0 0 0 0 0<br />
Free Cash Flow (WACC<br />
Model)<br />
0 0 0 29 32 34 37 40 43 47 50 67 70 78<br />
PV of FCF 0 0 0 22 22 22 22 21 21 21 21 26 25 428<br />
share of PVs 0.00 % 34.13 % 65.87 %<br />
Model parameter Valuation (m)<br />
Derivation of WACC: Derivation of Beta: Present values 2023/24e 222<br />
Terminal Value 428<br />
Debt ratio 15.00 % Financial Strength 1.00 Financial liabilities 23<br />
Cost of debt 4.2 % Liquidity 1.00 Pension liabilities 18<br />
Market return 9.00 % Cyclicality 1.50 Hybrid capital 0<br />
Risk free rate 4.00 % Transparency 1.00 Minority interest 5<br />
Others 1.20 Market val. of investments 0<br />
Liquidity 130 No. of shares (m) 28.5<br />
WACC 8.88 % Beta 1.14 Equity Value 736 Value per share (USD) 25.81<br />
Sensitivity Value per Share (USD)<br />
Terminal Growth Delta EBIT-margin<br />
Beta (WACC) 1.75 % 2.00 % 2.25 % 2.50 % 2.75 % 3.00 % 3.25 % Beta (WACC) -1.5 pp -1.0 pp -0.5 pp 0.0 +0.5 pp +1.0 pp +1.5 pp<br />
1.38 (9.9 %) 20.78 21.11 21.47 21.85 22.26 22.69 23.16 1.38 (9.9 %) -288.69 -287.35 -286.00 -284.65 -283.30 -281.95 -280.60<br />
1.26 (9.4 %) 22.38 22.78 23.22 23.68 24.17 24.71 25.29 1.26 (9.4 %) -289.86 -288.41 -286.95 -285.50 -284.04 -282.58 -281.13<br />
1.20 (9.1 %) 23.27 23.72 24.19 24.70 25.25 25.85 26.50 1.20 (9.1 %) -290.37 -288.85 -287.34 -285.82 -284.31 -282.79 -281.28<br />
1.14 (8.9 %) 24.23 24.72 25.25 25.81 26.43 27.09 27.82 1.14 (8.9 %) -290.81 -289.23 -287.65 -286.07 -284.49 -282.91 -281.33<br />
1.08 (8.6 %) 25.26 25.81 26.39 27.02 27.71 28.45 29.27 1.08 (8.6 %) -291.19 -289.54 -287.89 -286.24 -284.59 -282.94 -281.29<br />
1.02 (8.4 %) 26.38 26.98 27.63 28.34 29.10 29.94 30.86 1.02 (8.4 %) -291.48 -289.75 -288.03 -286.30 -284.58 -282.85 -281.13<br />
0.90 (7.9 %) 28.91 29.65 30.47 31.35 32.33 33.40 34.59 0.90 (7.9 %) -291.77 -289.88 -287.98 -286.08 -284.18 -282.28 -280.38<br />
� …<br />
C O M M E N T Published 03.08.2012 3
<strong>Rofin</strong>-Sinar<br />
Free Cash Flow Value Potential<br />
Warburg Research's valuation tool "FCF Value Potential" reflects the ability of the company to generate sustainable free cash flows. It is based on the<br />
"FCF potential" - a FCF "ex growth" figure - which assumes unchanged working capital and pure maintenance capex. A value indication is derived by<br />
discounting the “FCF potential” of a given year with the weighted costs of capital. The fluctuating value indications over time add a timing element to the<br />
DCF model (our preferred valuation tool).<br />
in USD m 2007/08 2008/09 2009/10 2010/11 2011/12e 2012/13e 2013/14e<br />
Net Income before minorities 64 10 30 61 30 41 51<br />
+ Depreciation + Amortisation 23 13 12 13 14 14 15<br />
- Net Interest Income 3 0 0 0 0 0 0<br />
- Maintenance Capex 9 5 6 9 8 8 9<br />
+ Others 0 0 0 0 0 0 0<br />
= Free Cash Flow Potential 76 18 36 65 35 46 57<br />
Free Cash Flow Yield Potential 8.4 % 3.3 % 6.1 % 7.6 % 8.3 % 11.6 % 15.0 %<br />
WACC 8.88 % 8.88 % 8.88 % 8.88 % 8.88 % 8.88 % 8.88 %<br />
= Enterprise Value (EV) 899 525 591 857 426 397 378<br />
= Fair Enterprise Value 855 198 407 732 397 520 639<br />
- Net Debt (Cash) -108 -108 -108 -108 -95 -129 -151<br />
- Pension Liabilities 18 18 18 18 18 19 20<br />
- Others 0 0 0 0 0 0 0<br />
- Market value of minorities 5 5 5 5 5 5 8<br />
+ Market value of investments 0 0 0 0 0 0 0<br />
= Fair Market Capitalisation 940 283 492 818 470 625 763<br />
No. of shares (total) (m) 29 29 29 29 29 29 29<br />
= Fair value per share (USD) 32.65 9.83 17.10 28.39 16.30 21.71 26.50<br />
premium (-) / discount (+) in % -5.8 % 25.4 % 53.1 %<br />
Sensitivity Fair value per Share (USD)<br />
11.88 % 25.41 8.18 13.67 22.20 12.95 17.33 21.10<br />
10.88 % 27.47 8.66 14.65 23.96 13.91 18.58 22.65<br />
9.87 % 29.95 9.23 15.83 26.09 15.06 20.09 24.50<br />
WACC 8.88 % 32.99 9.93 17.27 28.69 16.47 21.94 26.77<br />
7.88 % 36.80 10.81 19.09 31.95 18.24 24.25 29.62<br />
6.87 % 41.71 11.95 21.43 36.16 20.53 27.24 33.30<br />
5.88 % 48.30 13.47 24.57 41.81 23.59 31.25 38.23<br />
� …<br />
C O M M E N T Published 03.08.2012 4
<strong>Rofin</strong>-Sinar<br />
Valuation<br />
2007/08 2008/09 2009/10 2010/11 2011/12e 2012/13e 2013/14e<br />
Price / Book 2.3 x 1.4 x 1.6 x 2.0 x 1.0 x 0.9 x 0.9 x<br />
Book value per share ex intangibles 9.82 10.73 10.75 12.76 12.62 13.52 14.97<br />
EV / Sales 1.6 x 1.5 x 1.4 x 1.4 x 0.8 x 0.7 x 0.6 x<br />
EV / EBITDA 7.5 x 24.9 x 10.6 x 8.9 x 7.2 x 5.4 x 4.2 x<br />
EV / EBIT 9.3 x 65.0 x 13.4 x 10.2 x 9.4 x 6.7 x 5.1 x<br />
EV / EBIT adj.* 9.3 x 65.0 x 13.4 x 10.2 x 9.4 x 6.7 x 5.1 x<br />
P / FCF 51.6 x 12.4 x 23.5 x 33.4 x n.a. n.a. n.a.<br />
P / E 14.6 x 63.9 x 21.9 x 15.7 x 15.5 x 12.6 x 9.9 x<br />
P / E adj.* n.a. n.a. n.a. n.a. n.a. n.a. n.a.<br />
Dividend Yield 0.0 % 0.0 % 0.0 % 0.0 % 0.0 % 0.0 % 0.0 %<br />
Free Cash Flow Yield Potential 8.4 % 3.3 % 6.1 % 7.6 % 8.3 % 11.6 % 15.0 %<br />
*Adjustments made for: -<br />
C O M M E N T Published 03.08.2012 5
<strong>Rofin</strong>-Sinar<br />
Consolidated profit and loss<br />
In USD m 2007/08 2008/09 2009/10 2010/11 2011/12e 2012/13e 2013/14e<br />
Sales 575 350 424 598 521 558 614<br />
Change Sales yoy 19.9 % -39.2 % 21.2 % 41.1 % -12.8 % 7.0 % 10.0 %<br />
COGS 327 218 257 366 328 344 372<br />
Gross profit 248 132 166 232 193 213 242<br />
Gross margin 43.1 % 37.8 % 39.3 % 38.8 % 37.1 % 38.2 % 39.4 %<br />
Research and development 41 32 30 38 44 46 49<br />
Sales and marketing 0 0 0 0 0 0 0<br />
Administration expenses 104 89 90 108 102 106 115<br />
Other operating expenses 0 0 0 0 0 0 0<br />
Other operating income 0 0 0 0 0 0 0<br />
Unfrequent items 0 0 0 0 0 0 0<br />
EBITDA 119 21 56 97 59 73 89<br />
Margin 20.8 % 6.0 % 13.1 % 16.2 % 11.3 % 13.1 % 14.5 %<br />
Depreciation of fixed assets 16 9 9 10 11 12 12<br />
EBITA 103 12 n.a. n.a. n.a. n.a. n.a.<br />
Amortisation of intangible fixed assets 7 4 2 3 2 2 2<br />
Goodwill amortization 0 0 0 0 0 0 0<br />
EBIT 96 8 44 84 45 59 75<br />
Margin 16.7 % 2.3 % 10.4 % 14.0 % 8.7 % 10.6 % 12.2 %<br />
EBIT adj. 96 8 44 84 45 59 75<br />
Interest income 5 1 1 1 1 1 1<br />
Interest expenses 2 2 1 1 1 1 1<br />
Other financial income (loss) -1 7 2 3 0 0 0<br />
EBT 98 14 46 86 45 58 74<br />
Margin 17.1 % 4.1 % 10.8 % 14.4 % 8.5 % 10.4 % 12.0 %<br />
Total taxes 33 5 15 26 16 19 23<br />
Net income from continuing operations 64 10 30 61 30 41 51<br />
Income from discontinued operations (net of tax) 0 0 0 0 0 0 0<br />
Net income before minorities 64 10 30 61 30 41 51<br />
Minority interest 1 0 -1 -1 -1 -1 -1<br />
Net income 65 9 30 60 29 40 50<br />
Margin 11.3 % 2.6 % 7.0 % 10.0 % 5.5 % 7.1 % 8.2 %<br />
Number of shares, average 30 29 29 29 30 30 30<br />
EPS 2.09 0.32 1.04 2.06 1.12 1.37 1.75<br />
EPS adj. n.a. n.a. n.a. n.a. n.a. n.a. n.a.<br />
*Adjustments made for:<br />
Guidance: Fiscal 11/12: Sales between USD 518-523m, PBT-margin 9-10%<br />
Financial Ratios<br />
2007/08 2008/09 2009/10 2010/11 2011/12e 2012/13e 2013/14e<br />
Total Operating Costs / Sales n.a. n.a. n.a. n.a. n.a. n.a. n.a.<br />
Operating Leverage 0.7 x 2.3 x 21.0 x 2.2 x 3.6 x 4.4 x 2.6 x<br />
EBITDA / Interest expenses 51.2 x 12.0 x 57.0 x 131.9 x 73.7 x 91.6 x 111.6 x<br />
Tax rate (EBT) 34.0 % 36.2 % 33.6 % 30.3 % 35.6 % 32.2 % 31.6 %<br />
Dividend Payout Ratio 0.0 % 0.0 % 0.0 % 0.0 % 0.0 % 0.0 % 0.0 %<br />
Sales per Employee 338,399 200,103 241,902 303,125 254,268 268,143 286,687<br />
Sales, EBITDA<br />
in EUR m<br />
Source: Warburg Research<br />
Operating Performance<br />
in %<br />
Source: Warburg Research<br />
C O M M E N T Published 03.08.2012 6<br />
Performance per Share<br />
Source: Warburg Research
<strong>Rofin</strong>-Sinar<br />
Consolidated balance sheet<br />
In USD m 2007/08 2008/09 2009/10 2010/11 2011/12e 2012/13e 2013/14e<br />
Assets<br />
Goodwill and other intangible assets 103 105 100 103 128 128 128<br />
thereof other intangible assets 11 11 10 12 25 25 25<br />
thereof Goodwill 92 94 90 91 103 103 103<br />
Property, plant and equipment 56 56 53 66 74 79 85<br />
Financial assets 0 0 0 0 14 14 14<br />
Other long-term assets 6 15 18 18 -6 4 3<br />
Fixed assets 166 175 171 187 210 224 229<br />
Inventories 153 136 152 189 202 185 197<br />
Accounts receivable 118 79 98 119 105 119 127<br />
Liquid assets 116 119 116 130 111 145 167<br />
Other short-term assets 19 20 22 29 29 26 18<br />
Current assets 406 355 387 467 447 475 509<br />
Total Assets 584 540 558 654 657 699 738<br />
Liabilities and shareholders' equity<br />
Subscribed capital 0 0 0 0 0 0 0<br />
Capital reserve 189 196 205 218 223 228 233<br />
Retained earnings 294 304 333 394 426 466 516<br />
Other equity components -82 -82 -125 -138 -149 -166 -173<br />
Shareholder's equity 402 418 414 474 500 529 572<br />
Minority interest 2 3 4 5 5 5 8<br />
Total equity 405 422 417 479 505 534 580<br />
Provisions 75 63 80 101 96 103 107<br />
thereof provisions for pensions and similar obligations 12 17 18 18 18 19 20<br />
Financial liabilites (total) 67 31 21 23 16 16 16<br />
thereof short-term financial liabilities 55 19 5 8 10 10 10<br />
Accounts payable 21 13 23 27 27 26 28<br />
Other liabilities 18 10 17 24 22 24 15<br />
Liabilities 181 118 141 175 160 170 166<br />
Total liabilities and shareholders' equity 584 540 558 654 657 699 738<br />
Financial Ratios<br />
2007/08 2008/09 2009/10 2010/11 2011/12e 2012/13e 2013/14e<br />
Efficiency of Capital Employment<br />
Operating Assets Turnover n.a. n.a. n.a. n.a. n.a. n.a. n.a.<br />
Capital Employed Turnover 1.2 x 0.7 x 0.9 x 1.2 x 1.0 x 1.0 x 1.0 x<br />
ROA 39.2 % 5.2 % 17.5 % 32.2 % 13.7 % 17.6 % 22.0 %<br />
Return on Capital<br />
ROCE n.a. 1.1 % 6.3 % 12.0 % 5.5 % 7.3 % 8.6 %<br />
ROE 15.3 % 2.2 % 7.2 % 13.5 % 5.9 % 7.7 % 9.1 %<br />
Adj. ROE 15.3 % 2.2 % 7.2 % 13.5 % 5.9 % 7.7 % 9.1 %<br />
Balance sheet quality<br />
Net Debt -38 -70 -77 -90 -77 -110 -131<br />
Net Financial Debt -50 -88 -96 -108 -95 -129 -151<br />
Net Gearing -9.3 % -16.7 % -18.6 % -18.8 % -15.3 % -20.6 % -22.6 %<br />
Net Financial Debt / EBITDA -41.7 % -415.7 % -172.0 % -111.2 % -161.2 % -175.9 % -169.4 %<br />
Book Value / Share 13.2 14.3 14.2 16.3 16.9 17.8 19.3<br />
Book value per share ex intangibles 9.8 10.7 10.7 12.8 12.6 13.5 15.0<br />
ROCE Development<br />
Source: Warburg Research<br />
Net debt<br />
in EUR m<br />
Source: Warburg Research<br />
C O M M E N T Published 03.08.2012 7<br />
Book Value per Share<br />
in EUR<br />
Source: Warburg Research
<strong>Rofin</strong>-Sinar<br />
Consolidated cash flow statement<br />
In USD m 2007/08 2008/09 2009/10 2010/11 2011/12e 2012/13e 2013/14e<br />
Net income 64 9 30 61 30 41 51<br />
Depreciation of fixed assets 16 9 9 10 11 12 12<br />
Amortisation of goodwill 0 0 0 0 0 0 0<br />
Amortisation of intangible assets 7 4 2 3 2 2 2<br />
Increase/decrease in long-term provisions 1 -17 18 18 -5 7 4<br />
Other non-cash income and expenses -2 22 -14 -15 -10 -10 -10<br />
Cash Flow 86 27 47 77 28 51 60<br />
Increase / decrease in inventory -15 21 -21 -28 -13 17 -12<br />
Increase / decrease in accounts receivable -12 39 -23 -23 14 -14 -8<br />
Increase / decrease in accounts payable 2 -9 11 3 -1 0 2<br />
Increase / decrease in other working capital positions -28 -22 24 21 0 0 0<br />
Increase / decrease in working capital -53 28 -10 -27 1 3 -18<br />
Net cash provided by operating activities 33 55 37 50 31 45 35<br />
Investments in intangible assets 0 0 0 0 0 0 0<br />
Investments in property, plant and equipment 14 8 9 22 16 17 18<br />
Payments for acquisitions 30 12 1 11 25 0 0<br />
Financial investments 129 2 11 9 14 9 10<br />
Income from asset disposals 225 4 13 13 10 10 10<br />
Net cash provided by investing activities -52 18 8 29 45 16 18<br />
Change in financial liabilities 25 -36 -10 -3 -7 0 0<br />
Dividends paid 0 0 0 0 0 0 0<br />
Purchase of own shares -120 0 -19 -9 0 0 0<br />
Capital measures 5 0 3 7 5 5 5<br />
Others 0 0 0 0 -1 0 0<br />
Net cash provided by financing activities -90 -36 -27 -5 -3 5 5<br />
Change in liquid funds -6 2 2 17 -16 34 22<br />
Effects of exchange-rate changes on cash 2 0 -7 0 0 0 0<br />
Cash and cash equivalent at end of period 114 116 111 127 111 145 167<br />
Financial Ratios<br />
2007/08 2008/09 2009/10 2010/11 2011/12e 2012/13e 2013/14e<br />
Cash Flow<br />
Free Cash Flow 85 37 29 21 -14 29 17<br />
Free Cash Flow / Sales 3.1 % 13.6 % 6.7 % 4.7 % 2.9 % 5.0 % 2.8 %<br />
Free Cash Flow Potential 76 18 36 65 35 46 57<br />
Free Cash Flow / Sales 3.1 % 13.6 % 6.7 % 4.7 % 2.9 % 5.0 % 2.8 %<br />
Free Cash Flow / Net Profit 27.9 % 519.6 % 94.6 % 47.0 % 53.5 % 70.6 % 34.3 %<br />
Interest Received / Avg. Cash 3.1 % 1.2 % 0.5 % 0.7 % 0.7 % 0.6 % 0.5 %<br />
Interest Paid / Avg. Debt 4.3 % 3.6 % 3.7 % 3.4 % 4.1 % 4.9 % 4.9 %<br />
Management of Funds<br />
Investment ratio -2.5 % -2.2 % -2.0 % -3.6 % -3.1 % -3.0 % -2.9 %<br />
Maint. Capex / Sales 1.5 % 1.5 % 1.5 % 1.5 % 1.5 % 1.5 % 1.5 %<br />
Capex / Dep -62.6 % -60.0 % -74.0 % -167.2 % -118.5 % -121.4 % -124.1 %<br />
Avg. Working Capital / Sales n.a. n.a. n.a. n.a. n.a. n.a. n.a.<br />
Trade Debtors / Trade Creditors 556.8 % 603.7 % 421.3 % 440.9 % 396.2 % 452.5 % 453.6 %<br />
Inventory Turnover 2.1 x 1.6 x 1.7 x 1.9 x 1.6 x 1.9 x 1.9 x<br />
Receivables collection period (days) 75 83 84 73 74 78 76<br />
Payables payment period (days) 24 22 33 27 29 28 27<br />
Cash conversion cycle (Days) n.a. n.a. n.a. n.a. n.a. n.a. n.a.<br />
CAPEX and Cash Flow<br />
in EUR m<br />
Source: Warburg Research<br />
Free Cash Flow Generation<br />
Source: Warburg Research<br />
C O M M E N T Published 03.08.2012 8<br />
Working Capital<br />
Source: Warburg Research
<strong>Rofin</strong>-Sinar<br />
LEGAL DISCLAIMER<br />
This research report was prepared by the Warburg Research GmbH, a subsidiary of the M.M.Warburg & CO KGaA and is passed on<br />
by the M.M.Warburg & CO KGaA. It contains selected information and does not purport to be complete. The report is based on<br />
publicly available information and data ("the information") believed to be accurate and complete. Warburg Research GmbH neither<br />
does examine the information to be accurate and complete, nor guarantees its accuracy and completeness. Possible errors or<br />
incompleteness of the information do not constitute grounds for liability of M.M.Warburg & CO KGaA or Warburg Research GmbH for<br />
damages of any kind whatsoever, and M.M.Warburg & CO KGaA and Warburg Research GmbH are not liable for indirect and/or direct<br />
and/or consequential damages. In particular, neither M.M.Warburg & CO KGaA nor Warburg Research GmbH are liable for the<br />
statements, plans or other details contained in these analyses concerning the examined companies, their affiliated companies,<br />
strategies, economic situations, market and competitive situations, regulatory environment, etc. Although due care has been taken in<br />
compiling this research report, it cannot be excluded that it is incomplete or contains errors. M.M.Warburg & CO KGaA and Warburg<br />
Research GmbH, their shareholders and employees are not liable for the accuracy and completeness of the statements, estimations<br />
and the conclusions derived from the information contained in this document. Provided a research report is being transmitted in<br />
connection with an existing contractual relationship, i.e. financial advisory or similar services, the liability of M.M.Warburg & CO KGaA<br />
and Warburg Research GmbH shall be restricted to gross negligence and wilful misconduct. In case of failure in essential tasks,<br />
M.M.Warburg & CO KGaA and Warburg Research GmbH are liable for normal negligence. In any case, the liability of M.M.Warburg &<br />
CO KGaA and Warburg Research GmbH is limited to typical, expectable damages. This research report does not constitute an offer or<br />
a solicitation of an offer for the purchase or sale of any security. Partners, directors or employees of M.M.Warburg & CO KGaA,<br />
Warburg Research GmbH or affiliated companies may serve in a position of responsibility, i.e. on the board of directors of companies<br />
mentioned in the report. Opinions expressed in this report are subject to change without notice. All rights reserved.<br />
COPYRIGHT NOTICE<br />
This work including all its parts is protected by copyright. Any use beyond the limits provided by copyright law without permission is<br />
prohibited and punishable. This applies, in particular, to reproductions, translations, microfilming, and storage and processing on<br />
electronic media of the entire content or parts thereof.<br />
DISCLOSURE ACCORDING TO § 34B OF THE GERMAN SECURITIES TRADING ACT AND FINANV<br />
The valuation underlying the rating of the company analysed in this report is based on generally accepted and widely used methods of<br />
fundamental valuation, such as the DCF model, Free Cash Flow Value Potential, peer group comparison and – where applicable – a<br />
sum-of-the-parts model.<br />
M.M.Warburg & CO KGaA and Warburg Research GmbH have set up internal organisational and administrative arrangements to<br />
prevent and avoid possible conflicts of interest and, where applicable, to disclose them.<br />
Valuations, ratings and price targets for the companies analysed by Warburg Research GmbH are subject to constant reviews and<br />
may therefore change, if any of the fundamental factors underlying these items do change.<br />
All share prices given in this equity analysis are closing prices on the date given in the analysis, except where stated otherwise.<br />
Neither Warburg Research GmbH’s analysts nor M.M.Warburg & CO KGaA’s analysts do receive any payments directly or indirectly<br />
from any investment banking activity of M.M.Warburg Bank or an affiliated company.<br />
M.M.Warburg & CO KGaA and Warburg Research GmbH are under supervision of the BaFin – German Federal Financial Supervisory<br />
Authority.<br />
SOURCES<br />
All data and consensus estimates have been obtained from FactSet except where stated otherwise.<br />
C O M M E N T Published 03.08.2012 9
<strong>Rofin</strong>-Sinar<br />
Section 34b of the German Securities Trading Act in combination with the FinAnV requires an enterprise preparing a<br />
securities analysis to point out possible conflicts of interest with respect to the company that is the subject of the analysis.<br />
A conflict of interest is assumed, in particular, when the enterprise preparing the analysis …<br />
-1- … or companies affiliated with this enterprise holds 5% or more of the share capital of the analysed company<br />
-2-<br />
-3-<br />
-4-<br />
… or companies affiliated with this enterprise was a member in a consortium which acquired the shares of the<br />
analysed company within the last twelve months<br />
… or companies affiliated with this enterprise manages the securities of the analysed company on the basis of<br />
an existing contract<br />
… or companies affiliated with this enterprise over the previous 12 months has been providing investment<br />
banking services for the analysed company for which a compensation has been or will be paid<br />
-5- … effected an agreement with the analysed company for the preparation of the financial analysis<br />
-6- … or companies affiliated with this enterprise regularly trade in shares or derivatives of the analysed company<br />
-7-<br />
… or the analyst responsible for this company has other important financial interests in relation to the analysed<br />
company such as e.g. the performance of mandates for the analysed company<br />
Company Disclosure Link to the historical price targets and rating changes (last 12 months)<br />
<strong>Rofin</strong>-Sinar 3, 6 http://www.mmwarburg.com/disclaimer/disclaimer_en/US7750431022.htm<br />
C O M M E N T Published 03.08.2012 10
<strong>Rofin</strong>-Sinar<br />
INVESTMENT RECOMMENDATION<br />
Investment recommendation: expected direction of the share price development of the financial instrument up to the given price target<br />
in the opinion of the analyst who covers this financial instrument.<br />
-B- Buy: The price of the analysed financial instrument is expected to rise over the next 12 months.<br />
-H- Hold:<br />
The price of the analysed financial instrument is expected to remain mostly flat over the<br />
next 12 months.<br />
-S- Sell: The price of the analysed financial instrument is expected to fall over the next 12 months.<br />
“-“ Rating suspended: The available information currently does not permit an evaluation of the company.<br />
WARBURG RESEARCH GMBH – RESEARCH UNIVERSE BY RATING<br />
Rating Number of stocks % of Universe<br />
Buy 113 60<br />
Hold 62 33<br />
Sell 9 5<br />
Rating suspended 4 2<br />
Total 188 100<br />
WARBURG RESEARCH GMBH – ANALYSED RESEARCH UNIVERSE BY RATING …<br />
… Looking only at companies for which a disclosure according to § 34b of the Germany Securities Trading Act and the<br />
FinAnV has to be made.<br />
Rating Number of stocks % of Universe<br />
Buy 99 65<br />
Hold 45 30<br />
Sell 5 3<br />
Rating suspended 3 2<br />
Total 152 100<br />
PRICE AND RATING HISTORY ROFIN-SINAR AS OF 03.08.2012<br />
C O M M E N T Published 03.08.2012 11<br />
The chart has markings if Warburg Research GmbH<br />
changed its rating in the last 12 months. Every marking<br />
represents the date and closing price on the day of the<br />
rating change.
<strong>Rofin</strong>-Sinar<br />
RESEARCH<br />
Christian Bruns +49 40 309537-253 Henner Rüschmeier +49 40 309537-270<br />
Head of Research cbruns@warburg-research.com Head of Research hrueschmeier@warburg-research.com<br />
Christian Cohrs +49 40 309537-175 Roland Rapelius +49 40 309537-220<br />
Engineering, Logistics ccohrs@warburg-research.com Engineering, Logistics rrapelius@warburg-research.com<br />
Felix Ellmann +49 40 309537-120 Jochen Reichert +49 40 309537-130<br />
Software, IT fellmann@warburg-research.com Telco, Internet, Media jreichert@warburg-research.com<br />
Jörg Philipp Frey +49 40 309537-258 Christopher Rodler +49 40 309537-290<br />
Retail, Consumer Goods jfrey@warburg-research.com Utilities crodler@warburg-research.com<br />
Ulrich Huwald +49 40 309537-255 Malte Schaumann +49 40 309537-170<br />
Health Care, Pharma uhuwald@warburg-research.com Technology mschaumann@warburg-research.com<br />
Thilo Kleibauer +49 40 309537-257 Susanne Schwartze +49 40 309537-155<br />
Retail, Consumer Goods tkleibauer@warburg-research.com Telco, Internet, Media sschwartze@warburg-research.com<br />
Torsten Klingner +49 40 309537-260 Oliver Schwarz +49 40 309537-250<br />
Real Estate tklingner@warburg-research.com Chemicals oschwarz@warburg-research.com<br />
Eggert Kuls +49 40 309537-256 Marc-René Tonn +49 40 309537-259<br />
Engineering ekuls@warburg-research.com Automobiles, Car Suppliers mtonn@warburg-research.com<br />
Frank Laser +49 40 309537-235 Björn Voss +49 40 309537-254<br />
Construction, Industrials flaser@warburg-research.com Car Suppliers, Steel bvoss@warburg-research.com<br />
Andreas Pläsier +49 40 309537-246 Andreas Wolf +49 40 309537-140<br />
Banks, Financial Services aplaesier@warburg-research.com Software, IT awolf@warburg-research.com<br />
Malte Räther +49 40 309537-185 Stephan Wulf +49 40 309537-150<br />
Technology mraether@warburg-research.com Utilities swulf@warburg-research.com<br />
SALES SALES TRADING<br />
Holger Nass +49 40 3282-2669 Oliver Merckel +49 40 3282-2634<br />
Head of Equity Sales hnass@mmwarburg.com Head of Sales Trading omerckel@mmwarburg.com<br />
Christian Alisch +49 40 3282-2667 Gudrun Bolsen +49 40 3282-2679<br />
Scandinavia calisch@mmwarburg.com Sales Trading gbolsen@mmwarburg.com<br />
Robert Conredel +49 40 3282-2633 Bastian Quast +49 40 3282-2701<br />
Germany rconredel@mmwarburg.com Sales Trading bquast@mmwarburg.com<br />
Matthias Fritsch +49 40 3282-2696 Patrick Schepelmann +49 40 3282-2700<br />
United Kingdom mfritsch@mmwarburg.com Sales Trading pschepelmann@mmwarburg.com<br />
Michael Kriszun +49 40 3282-2695 Thekla Struve +49 40 3282-2668<br />
United Kingdom mkriszun@mmwarburg.com Sales Trading tstruve@mmwarburg.com<br />
Marc Niemann +49 40 3282-2660 Jörg Treptow +49 40 3262-2658<br />
Germany mniemann@mmwarburg.com Sales Trading jtreptow@mmwarburg.com<br />
Dirk Rosenfelder +49 40 3282-2692<br />
Austria, Switzerland drosenfelder@mmwarburg.com Support<br />
Julian Straube +49 40 3282-2666 Katharina Bruns +49 40 3282-2694<br />
Germany jstraube@mmwarburg.com Roadshow/Marketing kbruns@mmwarburg.com<br />
Philipp Stumpfegger +49 40 3282-2635<br />
Australia pstumpfegger@mmwarburg.com<br />
Our research can be found under:<br />
MACRO RESEARCH<br />
C O M M E N T Published 03.08.2012 12<br />
Carsten Klude +49 40 3282-2572<br />
Macro Research cklude@mmwarburg.com<br />
Matthias Thiel +49 40 3282-2401<br />
Macro Research mthiel@mmwarburg.com<br />
Dr. Christian Jasperneite +49 40 3282-2439<br />
Investment Strategy cjasperneite@mmwarburg.com<br />
Warburg Research research.mmwarburg.com/en/index.html Thomson www.thomson.com<br />
Bloomberg MMWA GO Reuters www.knowledge.reuters.com<br />
FactSet www.factset.com Capital IQ www.capitaliq.com<br />
For access please contact:<br />
Andrea Carstensen +49 40 3282-2632 Kerstin Muthig +49 40 3282-2703<br />
Sales Assistance acarstensen@mmwarburg.com Sales Assistance kmuthig@mmwarburg.com