
You also want an ePaper? Increase the reach of your titles
YUMPU automatically turns print PDFs into web optimized ePapers that Google loves.
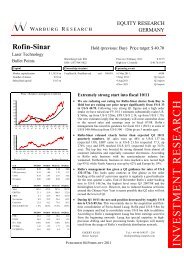
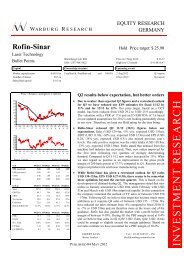
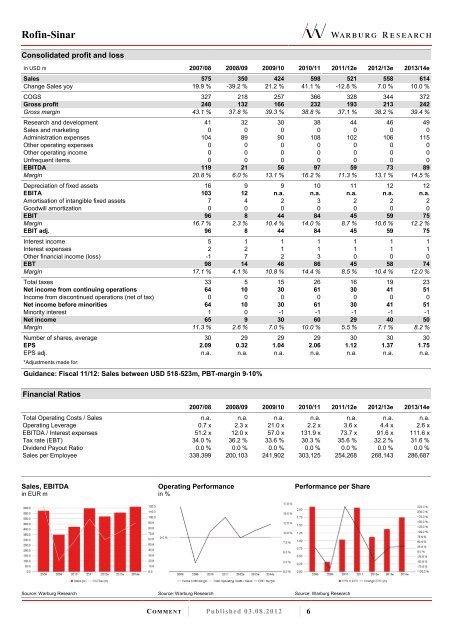
<strong>Rofin</strong>-Sinar<br />
Consolidated profit and loss<br />
In USD m 2007/08 2008/09 2009/10 2010/11 2011/12e 2012/13e 2013/14e<br />
Sales 575 350 424 598 521 558 614<br />
Change Sales yoy 19.9 % -39.2 % 21.2 % 41.1 % -12.8 % 7.0 % 10.0 %<br />
COGS 327 218 257 366 328 344 372<br />
Gross profit 248 132 166 232 193 213 242<br />
Gross margin 43.1 % 37.8 % 39.3 % 38.8 % 37.1 % 38.2 % 39.4 %<br />
Research and development 41 32 30 38 44 46 49<br />
Sales and marketing 0 0 0 0 0 0 0<br />
Administration expenses 104 89 90 108 102 106 115<br />
Other operating expenses 0 0 0 0 0 0 0<br />
Other operating income 0 0 0 0 0 0 0<br />
Unfrequent items 0 0 0 0 0 0 0<br />
EBITDA 119 21 56 97 59 73 89<br />
Margin 20.8 % 6.0 % 13.1 % 16.2 % 11.3 % 13.1 % 14.5 %<br />
Depreciation of fixed assets 16 9 9 10 11 12 12<br />
EBITA 103 12 n.a. n.a. n.a. n.a. n.a.<br />
Amortisation of intangible fixed assets 7 4 2 3 2 2 2<br />
Goodwill amortization 0 0 0 0 0 0 0<br />
EBIT 96 8 44 84 45 59 75<br />
Margin 16.7 % 2.3 % 10.4 % 14.0 % 8.7 % 10.6 % 12.2 %<br />
EBIT adj. 96 8 44 84 45 59 75<br />
Interest income 5 1 1 1 1 1 1<br />
Interest expenses 2 2 1 1 1 1 1<br />
Other financial income (loss) -1 7 2 3 0 0 0<br />
EBT 98 14 46 86 45 58 74<br />
Margin 17.1 % 4.1 % 10.8 % 14.4 % 8.5 % 10.4 % 12.0 %<br />
Total taxes 33 5 15 26 16 19 23<br />
Net income from continuing operations 64 10 30 61 30 41 51<br />
Income from discontinued operations (net of tax) 0 0 0 0 0 0 0<br />
Net income before minorities 64 10 30 61 30 41 51<br />
Minority interest 1 0 -1 -1 -1 -1 -1<br />
Net income 65 9 30 60 29 40 50<br />
Margin 11.3 % 2.6 % 7.0 % 10.0 % 5.5 % 7.1 % 8.2 %<br />
Number of shares, average 30 29 29 29 30 30 30<br />
EPS 2.09 0.32 1.04 2.06 1.12 1.37 1.75<br />
EPS adj. n.a. n.a. n.a. n.a. n.a. n.a. n.a.<br />
*Adjustments made for:<br />
Guidance: Fiscal 11/12: Sales between USD 518-523m, PBT-margin 9-10%<br />
Financial Ratios<br />
2007/08 2008/09 2009/10 2010/11 2011/12e 2012/13e 2013/14e<br />
Total Operating Costs / Sales n.a. n.a. n.a. n.a. n.a. n.a. n.a.<br />
Operating Leverage 0.7 x 2.3 x 21.0 x 2.2 x 3.6 x 4.4 x 2.6 x<br />
EBITDA / Interest expenses 51.2 x 12.0 x 57.0 x 131.9 x 73.7 x 91.6 x 111.6 x<br />
Tax rate (EBT) 34.0 % 36.2 % 33.6 % 30.3 % 35.6 % 32.2 % 31.6 %<br />
Dividend Payout Ratio 0.0 % 0.0 % 0.0 % 0.0 % 0.0 % 0.0 % 0.0 %<br />
Sales per Employee 338,399 200,103 241,902 303,125 254,268 268,143 286,687<br />
Sales, EBITDA<br />
in EUR m<br />
Source: Warburg Research<br />
Operating Performance<br />
in %<br />
Source: Warburg Research<br />
C O M M E N T Published 03.08.2012 6<br />
Performance per Share<br />
Source: Warburg Research