
You also want an ePaper? Increase the reach of your titles
YUMPU automatically turns print PDFs into web optimized ePapers that Google loves.
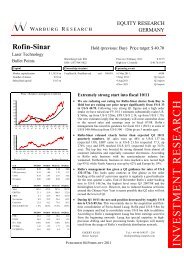
<strong>Rofin</strong>-Sinar<br />
Consolidated cash flow statement<br />
In USD m 2007/08 2008/09 2009/10 2010/11 2011/12e 2012/13e 2013/14e<br />
Net income 64 9 30 61 30 41 51<br />
Depreciation of fixed assets 16 9 9 10 11 12 12<br />
Amortisation of goodwill 0 0 0 0 0 0 0<br />
Amortisation of intangible assets 7 4 2 3 2 2 2<br />
Increase/decrease in long-term provisions 1 -17 18 18 -5 7 4<br />
Other non-cash income and expenses -2 22 -14 -15 -10 -10 -10<br />
Cash Flow 86 27 47 77 28 51 60<br />
Increase / decrease in inventory -15 21 -21 -28 -13 17 -12<br />
Increase / decrease in accounts receivable -12 39 -23 -23 14 -14 -8<br />
Increase / decrease in accounts payable 2 -9 11 3 -1 0 2<br />
Increase / decrease in other working capital positions -28 -22 24 21 0 0 0<br />
Increase / decrease in working capital -53 28 -10 -27 1 3 -18<br />
Net cash provided by operating activities 33 55 37 50 31 45 35<br />
Investments in intangible assets 0 0 0 0 0 0 0<br />
Investments in property, plant and equipment 14 8 9 22 16 17 18<br />
Payments for acquisitions 30 12 1 11 25 0 0<br />
Financial investments 129 2 11 9 14 9 10<br />
Income from asset disposals 225 4 13 13 10 10 10<br />
Net cash provided by investing activities -52 18 8 29 45 16 18<br />
Change in financial liabilities 25 -36 -10 -3 -7 0 0<br />
Dividends paid 0 0 0 0 0 0 0<br />
Purchase of own shares -120 0 -19 -9 0 0 0<br />
Capital measures 5 0 3 7 5 5 5<br />
Others 0 0 0 0 -1 0 0<br />
Net cash provided by financing activities -90 -36 -27 -5 -3 5 5<br />
Change in liquid funds -6 2 2 17 -16 34 22<br />
Effects of exchange-rate changes on cash 2 0 -7 0 0 0 0<br />
Cash and cash equivalent at end of period 114 116 111 127 111 145 167<br />
Financial Ratios<br />
2007/08 2008/09 2009/10 2010/11 2011/12e 2012/13e 2013/14e<br />
Cash Flow<br />
Free Cash Flow 85 37 29 21 -14 29 17<br />
Free Cash Flow / Sales 3.1 % 13.6 % 6.7 % 4.7 % 2.9 % 5.0 % 2.8 %<br />
Free Cash Flow Potential 76 18 36 65 35 46 57<br />
Free Cash Flow / Sales 3.1 % 13.6 % 6.7 % 4.7 % 2.9 % 5.0 % 2.8 %<br />
Free Cash Flow / Net Profit 27.9 % 519.6 % 94.6 % 47.0 % 53.5 % 70.6 % 34.3 %<br />
Interest Received / Avg. Cash 3.1 % 1.2 % 0.5 % 0.7 % 0.7 % 0.6 % 0.5 %<br />
Interest Paid / Avg. Debt 4.3 % 3.6 % 3.7 % 3.4 % 4.1 % 4.9 % 4.9 %<br />
Management of Funds<br />
Investment ratio -2.5 % -2.2 % -2.0 % -3.6 % -3.1 % -3.0 % -2.9 %<br />
Maint. Capex / Sales 1.5 % 1.5 % 1.5 % 1.5 % 1.5 % 1.5 % 1.5 %<br />
Capex / Dep -62.6 % -60.0 % -74.0 % -167.2 % -118.5 % -121.4 % -124.1 %<br />
Avg. Working Capital / Sales n.a. n.a. n.a. n.a. n.a. n.a. n.a.<br />
Trade Debtors / Trade Creditors 556.8 % 603.7 % 421.3 % 440.9 % 396.2 % 452.5 % 453.6 %<br />
Inventory Turnover 2.1 x 1.6 x 1.7 x 1.9 x 1.6 x 1.9 x 1.9 x<br />
Receivables collection period (days) 75 83 84 73 74 78 76<br />
Payables payment period (days) 24 22 33 27 29 28 27<br />
Cash conversion cycle (Days) n.a. n.a. n.a. n.a. n.a. n.a. n.a.<br />
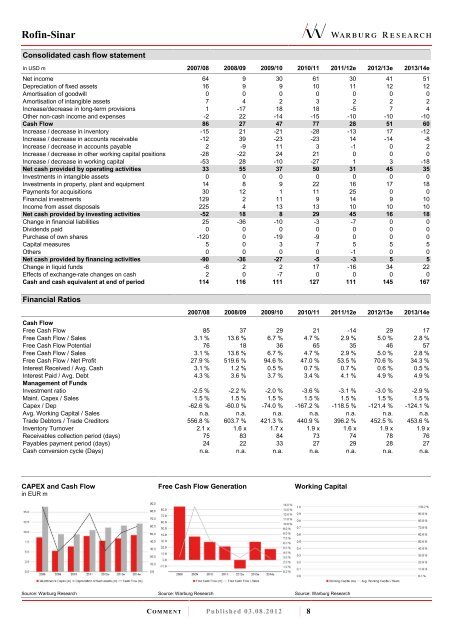
CAPEX and Cash Flow<br />
in EUR m<br />
Source: Warburg Research<br />
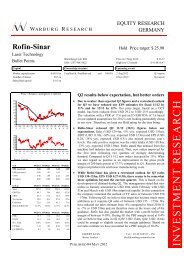
Free Cash Flow Generation<br />
Source: Warburg Research<br />
C O M M E N T Published 03.08.2012 8<br />
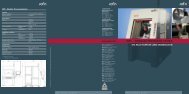
Working Capital<br />
Source: Warburg Research