
Create successful ePaper yourself
Turn your PDF publications into a flip-book with our unique Google optimized e-Paper software.
EQUITY RESEARCH<br />
GERMANY<br />
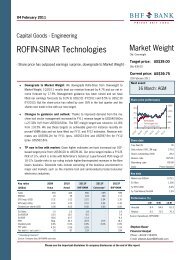
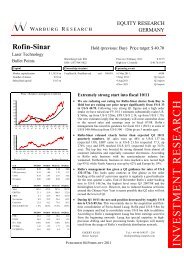
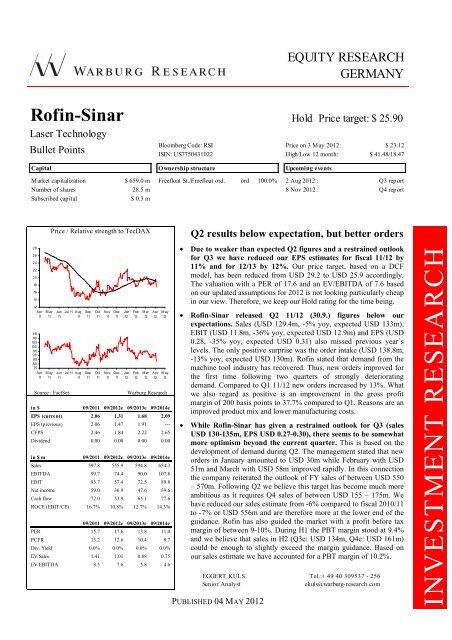
<strong>Rofin</strong>-<strong>Sinar</strong> Hold Price target: $ 25.90<br />
Laser Technology<br />
Bullet Points<br />
Capital<br />
Market capitalization $ 659.0 m<br />
Number of shares 28.5 m<br />
Subscribed capital $ 0.3 m<br />
28<br />
26<br />
24<br />
22<br />
20<br />
18<br />
16<br />
14<br />
12<br />
Apr<br />
11<br />
May<br />
11<br />
115<br />
110<br />
10 5<br />
100<br />
95<br />
90<br />
85<br />
80<br />
75<br />
Apr May<br />
11 11<br />
Price / Relative strength to TecDAX<br />
Jun<br />
11<br />
Jun<br />
11<br />
Jul 11 Aug<br />
11<br />
Jul 11 Aug<br />
11<br />
Sep<br />
11<br />
Sep<br />
11<br />
Oct<br />
11<br />
Oct<br />
11<br />
Nov<br />
11<br />
Nov<br />
11<br />
Source : FactSet Warburg Research<br />
in $ 09/2011 09/2012e 09/2013e 09/2014e<br />
EPS (current) 2.06 1.31 1.68 2.09<br />
EPS (previous) 2.06 1.47 1.91 ---<br />
CFPS 2.46 1.84 2.22 2.65<br />
Dividend 0.00 0.00 0.00 0.00<br />
in $ m 09/2011 09/2012e 09/2013e 09/2014e<br />
Sales 597.8 555.9 594.8 654.3<br />
EBITDA 99.7 74.4 90.0 107.8<br />
EBIT 83.7 57.4 72.5 89.8<br />
Net income 59.0 36.9 47.6 59.6<br />
Cash flow 72.0 53.9 65.1 77.6<br />
ROCE (EBIT/CE) 16.7% 10.8% 12.7% 14.3%<br />
09/2011 09/2012e 09/2013e 09/2014e<br />
PER 15.7 17.6 13.8 11.0<br />
PCFR 13.2 12.6 10.4 8.7<br />
Div. Yield 0.0% 0.0% 0.0% 0.0%<br />
EV/Sales 1.41 1.01 0.88 0.75<br />
EV/EBITDA 8.5 7.6 5.8 4.6<br />
Dec<br />
11<br />
Dec<br />
11<br />
Jan<br />
12<br />
Jan<br />
12<br />
Feb<br />
12<br />
Feb<br />
12<br />
Mar<br />
12<br />
Mar<br />
12<br />
Apr<br />
12<br />
Apr<br />
12<br />
Bloomberg Code: RSI<br />
ISIN: US7750431022<br />
Ownership structure<br />
Freefloat St./Freefloat ord. ord 100.0%<br />
May<br />
12<br />
May<br />
12<br />
Price on 3 May 2012: $ 23.12<br />
High/Low 12 month: $ 41.48/18.47<br />
Upcoming events<br />
2 Aug 2012 : Q3 report<br />
8 Nov 2012 : Q4 report<br />
Q2 results below expectation, but better orders<br />
• Due to weaker than expected Q2 figures and a restrained outlook<br />
for Q3 we have reduced our EPS estimates for fiscal 11/12 by<br />
11% and for 12/13 by 12%. Our price target, based on a DCF<br />
model, has been reduced from USD 29.2 to USD 25.9 accordingly.<br />
The valuation with a PER of 17.6 and an EV/EBITDA of 7.6 based<br />
on our updated assumptions for 2012 is not looking particularly cheap<br />
in our view. Therefore, we keep our Hold rating for the time being.<br />
RESEARCH<br />
• <strong>Rofin</strong>-<strong>Sinar</strong> released Q2 11/12 (30.9.) figures below our<br />
expectations. Sales (USD 129.4m, -5% yoy, expected USD 133m),<br />
EBIT (USD 11.8m, -36% yoy, expected USD 12.9m) and EPS (USD<br />
0.28, -35% yoy, expected USD 0.31) also missed previous year´s<br />
levels. The only positive surprise was the order intake (USD 138.8m,<br />
-13% yoy, expected USD 130m). <strong>Rofin</strong> stated that demand from the<br />
machine tool industry has recovered. Thus, new orders improved for<br />
the first time following two quarters of strongly deteriorating<br />
demand. Compared to Q1 11/12 new orders increased by 13%. What<br />
we also regard as positive is an improvement in the gross profit<br />
margin of 200 basis points to 37.7% compared to Q1. Reasons are an<br />
improved product mix and lower manufacturing costs.<br />
INVESTMENT<br />
• While <strong>Rofin</strong>-<strong>Sinar</strong> has given a restrained outlook for Q3 (sales<br />
USD 130-135m, EPS USD 0.27-0.30), there seems to be somewhat<br />
more optimism beyond the current quarter. This is based on the<br />
development of demand during Q2. The management stated that new<br />
orders in January amounted to USD 30m while February with USD<br />
51m and March with USD 58m improved rapidly. In this connection<br />
the company reiterated the outlook of FY sales of between USD 550<br />
– 570m. Following Q2 we believe this target has become much more<br />
ambitious as it requires Q4 sales of between USD 155 – 175m. We<br />
have reduced our sales estimate from -6% compared to fiscal 2010/11<br />
to -7% or USD 556m and are therefore more at the lower end of the<br />
guidance. <strong>Rofin</strong> has also guided the market with a profit before tax<br />
margin of between 9-10%. During H1 the PBT margin stood at 9.4%<br />
and we believe that sales in H2 (Q3e: USD 134m, Q4e: USD 161m)<br />
could be enough to slightly exceed the margin guidance. Based on<br />
our sales estimate we have accounted for a PBT margin of 10.2%.<br />
EGGERT KULS Tel.:+ 49 40 309537 - 256<br />
Senior Analyst ekuls@warburg-research.com<br />
PUBLISHED 04 MAY 2012
<strong>Rofin</strong>-<strong>Sinar</strong> EGGERT KULS, + 49 40 309537 - 256<br />
09/2009 09/2010 09/2011 09/2012e 09/2013e 09/2014e<br />
Income statement (in $ m)<br />
Sales 349.6 423.6 597.8 555.9 594.8 654.3<br />
Cost of goods -217.5 -257.3 -365.7 -347.4 -364.8 -394.0<br />
Gross profit 132.0 166.3 232.1 208.5 230.1 260.4<br />
SG&A expenses -88.9 -89.9 -107.5 -107.0 -111.3 -121.3<br />
R&D expenses -31.5 -30.1 -38.3 -41.8 -43.9 -46.9<br />
Other oper. income/expenses 6.6 1.9 3.5 0.0 0.0 0.0<br />
EBITDA 21.1 55.9 99.7 74.4 90.0 107.8<br />
Goodwill amortisation -3.6 -2.3 -2.6 -2.4 -2.4 -2.4<br />
Depreciation -13.0 -11.6 -13.0 -17.0 -17.5 -18.0<br />
EBIT 8.1 43.9 83.7 57.4 72.5 89.8<br />
Operating profit (company definition) 8.1 43.9 83.7 57.4 72.5 89.8<br />
Financial income --- --- --- --- --- ---<br />
Pre-tax profit 14.4 45.3 86.1 56.5 71.5 88.7<br />
Income taxes -5.2 -15.4 -26.1 -18.6 -22.9 -27.9<br />
(Tax rate in %) 36.2 34.1 31.0 33.0 32.0 31.5<br />
Net income 8.8 29.2 59.0 36.9 47.6 59.6<br />
Net income after minorities 8.8 29.2 59.0 36.9 47.6 59.6<br />
EPS ord. 0.32 1.04 2.06 1.31 1.68 2.09<br />
Growth (in %) CAGR (09/14)<br />
Sales 13.4 % -39.2 21.2 41.1 -7.0 7.0 10.0<br />
EBITDA 38.6 % -81.3 165.3 78.2 -25.4 21.1 19.7<br />
EBIT 61.8 % -91.6 443.7 90.4 -31.4 26.5 23.7<br />
Net income<br />
Cost ratios (in % of sales)<br />
46.5 % -86.7 230.9 102.0 -37.4 29.0 25.2<br />
Cost of goods / sales 62.2 60.7 61.2 62.5 61.3 60.2<br />
SG&A / sales 25.4 21.2 18.0 19.2 18.7 18.5<br />
R&D / sales<br />
Cash flow (in $ m)<br />
9.0 7.1 6.4 7.5 7.4 7.2<br />
Gross cash flow 18.1 40.9 73.7 55.4 66.8 79.5<br />
Operating cash flow 65.5 17.4 38.8 60.1 65.6 61.2<br />
Cash flow from investing activities -20.1 -8.6 -21.8 -45.0 -16.0 -18.0<br />
Free cash flow 45.4 8.8 17.0 15.1 49.6 43.2<br />
Cash earnings<br />
Productivity (in $ ts.)<br />
21.8 40.8 72.0 53.9 65.1 77.6<br />
Sales / employee 233.1 282.4 398.5 370.6 396.6 436.2<br />
Personnel expense / employee --- --- --- --- --- ---<br />
EBIT / employee<br />
Returns (in %)<br />
5.4 29.3 55.8 38.2 48.4 59.8<br />
EBITDA / sales 6.0 13.2 16.7 13.4 15.1 16.5<br />
EBIT / sales 2.3 10.4 14.0 10.3 12.2 13.7<br />
Pre-tax profit / sales 4.1 10.7 14.4 10.2 12.0 13.5<br />
Net income / sales 2.5 6.9 9.9 6.6 8.0 9.1<br />
Return on equity 2.1 7.0 12.3 7.3 8.7 9.9<br />
Return on total capital 1.6 5.2 9.0 5.4 6.5 7.5<br />
ROCE<br />
Balance sheet (in $ m)<br />
1.8 10.0 16.7 10.8 12.7 14.3<br />
Property, plant and equipment 55.7 52.7 65.6 73.0 77.0 79.0<br />
Goodwill 93.8 0.0 0.0 0.0 0.0 0.0<br />
Working capital 202.7 226.2 281.2 276.5 277.7 296.0<br />
Current assets 354.9 387.4 467.3 467.8 509.8 565.0<br />
Capital employed (CE) 453.1 438.5 501.5 531.7 572.8 625.9<br />
Equity 421.7 417.8 478.6 508.8 549.9 603.0<br />
Equity ratio in % 78.2 74.9 73.2 74.7 75.4 75.9<br />
Net financial debt (+), liquidity (-) -87.6 -95.7 -107.5 -114.0 -154.0 -186.2<br />
Total net debt (+), liquidity (-) -87.6 -95.7 -107.5 -95.5 -135.0 -166.2<br />
Gearing in % -20.8 -22.9 -22.5 -22.4 -28.0 -30.9<br />
Price ord. on 3 May 2012: $ 23.12<br />
Valuation<br />
EPS ord. ($) 0.32 1.04 2.06 1.31 1.68 2.09<br />
CFPS ($) 0.75 1.42 2.46 1.84 2.22 2.65<br />
Number of shares ord., (m) 28.9 28.8 29.3 29.3 29.3 29.3<br />
P/E ord. 63.8 21.9 15.7 17.6 13.8 11.0<br />
P/CF 26.8 16.0 13.2 12.6 10.4 8.7<br />
EV / Sales 1.42 1.32 1.41 1.01 0.88 0.75<br />
EV / EBITDA 23.6 10.0 8.5 7.6 5.8 4.6<br />
EV / EBIT 61.5 12.7 10.1 9.8 7.2 5.5<br />
Disclaimer: The legal disclaimer as well as updated disclosures according to Section 34b of the German Securities Trading Act and German FinAnV on the<br />
security/securities analysed in this report can be found on our internet pages at : http://www.mmwarburg.com/research/disclaimer/disclaimer.htm<br />
The disclaimer and disclosures provided are considered a part of this report and should be taken into account when making investment decisions based on this report.<br />
Copyright: This work including all its parts is protected by copyright. Any use beyond the limits provided by copyright law without permission is prohibited and<br />
punishable. This applies, in particular, to reproductions, translations, microfilming, and storage and processing on electronic media of the entire content or parts thereof.<br />
WARBURG RESEARCH GMBH – MAY 2012 PAGE 2