

Full of Energy - Energie AG Oberösterreich
Full of Energy - Energie AG Oberösterreich
Full of Energy - Energie AG Oberösterreich

Create successful ePaper yourself
Turn your PDF publications into a flip-book with our unique Google optimized e-Paper software.
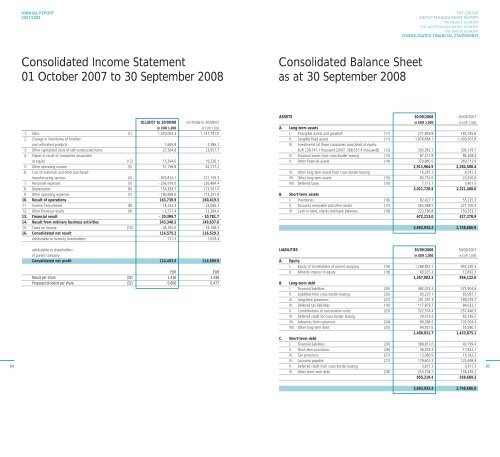
ANNUAL REPORT2007/2008THE GROUPGROUP MAN<strong>AG</strong>EMENT REPORTTHE ENERGY SEGMENTTHE WASTE MAN<strong>AG</strong>EMENT SEGMENTTHE WATER SEGMENTCONSOLIDATED FINANCIAL STATEMENTSConsolidated Income Statement01 October 2007 to 30 September 2008Consolidated Balance Sheetas at 30 September 200801/10/07 to 30/09/08 01/10/06 to 30/09/07in EUR 1,000 in EUR 1,0001. Sales (1) 1,520,063.3 1,141,791.02. Change in inventories <strong>of</strong> finishedand unfinished products 1,665.8 - 2,386.13. Other capitalized costs <strong>of</strong> self-constructed items 27,564.8 23,957.74. Shares in result <strong>of</strong> companies associatedat equity (12) 15,394.6 19,226.15. Other operating income (3) 57,196.8 62,177.26. Cost <strong>of</strong> materials and other purchasedmanufacturing services (4) - 876,814.1 - 571,159.37. Personnel expenses (5) - 256,979.0 - 226,484.48. Depreciation (6) - 134,383.7 - 113,501.09. Other operating expenses (7) - 189,968.6 - 173,201.910. Result <strong>of</strong> operations 163,739.9 160,419.311. Income from interest (8) - 18,242.3 - 24,066.112. Other financial results (9) - 2,157.4 13,284.413. Financial result - 20,399.7 - 10,781.714. Result from ordinary business activities 143,340.2 149,637.615. Taxes on income (10) - 26,765.0 - 33,108.316. Consolidated net result 116,575.2 116,529.3attributable to minority shareholders 171.3 1,629.4ASSETS 30/09/2008 30/09/2007in EUR 1,000 in EUR 1,000A. Long-term assetsI. Intangible assets and goodwill (11) 271,839.8 183,185.6II. Tangible fixed assets (11) 1,876,684.1 1,439,301.8III. Investments (<strong>of</strong> these companies associated at equity:EUR 238,741.1 thousand [2007: 268,537.4 thousand]) (12) 305,382.7 306,179.7IV. Financial assets from cross-border leasing (13) 87,217.8 86,208.4V. Other financial assets (14) 370,840.5 269,712.92,911,964.9 2,284,588.4VI. Other long-term assets from cross-border leasing 16,287.2 8,741.3VII. Other long-term assets (15) 85,752.6 22,676.8VIII. Deferred taxes (10) 7,715.7 5,401.53,021,720.4 2,321,408.0B. Short-term assetsI. Inventories (16) 82,427.7 55,225.3II. Accounts receivable and other assets (17) 365,998.5 221,700.5III. Cash in hand, checks and bank balances (18) 223,786.8 150,353.1672,213.0 427,278.93,693,933.4 2,748,686.984attributable to shareholders<strong>of</strong> parent companyConsolidated net pr<strong>of</strong>it 116,403.9 114,899.9EUREURResult per share (32) 1.416 1.436Proposed dividend per share (32) 0.600 0.477LIABILITIES 30/09/2008 30/09/2007in EUR 1,000 in EUR 1,000A. EquityI. Equity <strong>of</strong> shareholders <strong>of</strong> parent company (19) 1,288,857.1 942,230.3II. Minority interest in equity (19) 69,025.2 13,892.31,357,882.3 956,122.6B. Long-term debtI. Financial liabilities (20) 482,074.2 575,904.6II. Liabilities from cross-border leasing (20) 93,237.1 83,991.1III. Long-term provisions (22) 201,397.3 189,079.2IV. Deferred tax liabilities (10) 117,879.7 84,632.1V. Constributions to construction costs (23) 322,518.4 257,446.5VI. Deferred credit for cross-border leasing 79,519.2 83,336.5VII. Advances from customers (24) 89,284.2 103,904.4VIII. Other long-term debt (25) 94,921.6 55,580.71,480,831.7 1,433,875.1C. Short-term debtI. Financial liabilities (20) 368,812.6 40,799.4II. Short-term provisions (26) 36,203.3 17,842.1III. Tax provisions (27) 13,080.9 15,182.3IV. Accounts payable (21) 179,601.2 122,698.9V. Deferred credit from cross-border leasing 3,817.3 3,817.3VI. Other short-term debt (28) 253,704.1 158,349.2855,219.4 358,689.2853,693,933.4 2,748,686.9