

Full of Energy - Energie AG Oberösterreich
Full of Energy - Energie AG Oberösterreich
Full of Energy - Energie AG Oberösterreich

Create successful ePaper yourself
Turn your PDF publications into a flip-book with our unique Google optimized e-Paper software.
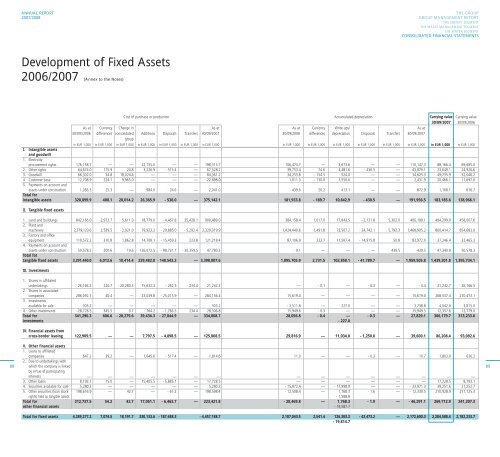
ANNUAL REPORT2007/2008THE GROUPGROUP MAN<strong>AG</strong>EMENT REPORTTHE ENERGY SEGMENTTHE WASTE MAN<strong>AG</strong>EMENT SEGMENTTHE WATER SEGMENTCONSOLIDATED FINANCIAL STATEMENTSDevelopment <strong>of</strong> Fixed Assets2006/2007 (Annex to the Notes)88Cost <strong>of</strong> purchase or production Accumulated depreciation Carrying value Carrying value30/09/2007 30/09/2006As at Currency Change in As at As at Currency Write-ups/ As at30/09//2006 differences consolidated Additions Disposals Transfers 30/09/2007 30/09/2006 differences depreciation Disposals Transfers 30/09/2007groupin EUR 1,000 in EUR 1,000 in EUR 1,000 in EUR 1,000 in EUR 1,000 in EUR 1,000 in EUR 1,000 in EUR 1,000 in EUR 1,000 in EUR 1,000 in EUR 1,000 in EUR 1,000 in EUR 1,000 in EUR 1,000 in EUR 1,000I. Intangible assetsand goodwill1. Electricityprocurement rights 176,158.7 — — 22,155.0 — — 198,313.7 106,473.7 — 3,673.6 — — 110,147.3 88,166.4 69,685.02. Other rights 64,674.0 115.9 24.8 3,226.9 - 513.4 — 67,528.2 39,753.4 74.6 4,481.6 - 430.5 — 43,879.1 23,649.1 24,920.63. Goodwill 66,302.0 34.8 18,024.4 — — — 84,361.2 34,255.8 - 154.5 524.0 — — 34,625.3 49,735.9 32,046.24. Customer base 12,708.9 224.1 9,965.0 — — — 22,898.0 1,011.3 - 130.0 1,550.6 — — 2,431.9 20,466.1 11,697.65. Payments on account andassets under construction 1,056.3 25.3 — 984.0 - 24.6 — 2,041.0 439.6 20.2 413.1 — — 872.9 1,168.1 616.7Total forintangible assets 320,899.9 400.1 28,014.2 26,365.9 - 538.0 — 375,142.1 181,933.8 - 189.7 10,642.9 - 430.5 — 191,956.5 183,185.6 138,966.1II. Tangible fixed assets1. Land and buildungs 842,166.0 2,972.7 5,611.0 18,779.0 - 4,467.8 35,428.1 900,489.0 384,158.4 1,017.0 17,843.5 - 2,131.8 5,302.0 406,189.1 494,299.9 458,007.62. Plant andmachinery 2,279,123.6 2,529.5 2,921.0 79,923.2 - 29,885.0 - 5,292.4 2,329,319.9 1,424,440.6 1,491.8 73,507.2 - 24,742.1 - 5,792.3 1,468,905.2 860,414.7 854,683.03. Factory and <strong>of</strong>ficeequipment 119,572.2 310.8 1,862.8 14,708.1 - 15,459.3 223.8 121,218.4 87,106.9 222.7 11,507.4 - 14,915.8 50.8 83,972.0 37,246.4 32,465.34. Payments on account andassets under construction 50,578.2 200.6 19.6 126,072.5 - 98,731.1 - 30,359.5 47,780.3 - 0.1 — — — 439.5 439.5 47,340.9 50,578.3Total fottangible fixed assets 3,291,440.0 6,013.6 10,414.4 239,482.8 - 148,543.2 — 3,398,807.6 1,895,705.9 2,731.5 102,858.1 - 41,789.7 — 1,959,505.8 1,439,301.8 1,395,734.1III. Investments1. Shares in affiliatedundertakings 26,166.5 220.7 - 20,280.3 15,632.3 - 262.5 - 234.4 21,242.3 — - 0.1 — - 0.3 — - 0.4 21,242.7 26,166.52. Shares in associatedcompanies 286,092.1 40.4 — 23,039.8 - 25,015.9 — 284,156.4 15,619.0 — — — — 15,619.0 268,537.4 270,473.13. Investmentsavailable for sale 303.2 — — — — — 303.2 - 3,511.8 — - 227.0 — — - 3,738.8 4,042.0 3,815.04. Other investments 28,728.5 345.5 0.7 764.2 - 1,766.5 234.4 28,306.8 15,949.6 - 0.3 — — — 15,949.3 12,357.6 12,779.0Total for 341,290.3 606.6 - 20,279.6 39,436.3 - 27,044.9 — 334,008.7 28,056.8 - 0.4 — - 0.3 — 27,829.1 306,179.7 313,233.6investments - 227.0IV. Financial assets fromcross-border leasing 122,909.5 — — 7,797.5 - 4,898.5 — 125,808.5 29,816.9 — 11,034.0 - 1,250.8 — 39,600.1 86,208.4 93,092.6V. Other financial assets1. Loans to affiliatedcompanies 647.2 39.2 — 1,645.6 - 517.4 — 1,814.6 11.0 — — - 0.3 — 10.7 1,803.9 636.22. Due to undertakings withwhich the company is linkedby virtue <strong>of</strong> participatinginterests — — — — — — — — — — — — — — —3. Other loans 8,193.1 15.0 — 15,405.5 - 5,885.1 — 17,728.5 — — — — — — 17,728.5 8,193.14. Securities available for sale 5,280.3 — — — — — 5,280.3 - 15,972.4 — - 17,998.9 — — - 33,971.3 39,251.6 21,252.75. Other securities (loan stock 198,616.9 — 42.7 — - 61.2 — 198,598.4 - 12,508.4 — 1,768.3 - 1.6 — - 12,330.5 210,928.9 211,125.3rights) held as tangible assets - 1,588.8Total for 212,737.5 54.2 42.7 17,051.1 - 6,463.7 — 223,421.8 - 28,469.8 — 1,768.3 - 1.9 — - 46,291.1 269,712.9 241,207.3other financial assets - 19,587.7Total for fixed assets 4,289,277.2 7,074.5 18,191.7 330,133.6 - 187,488.3 - 4,457,188.7 2,107,043.5 2,541.4 126,303.3 - 43,473.2 — 2,172,600.3 2,284,588.4 2,182,233.7- 19,814.789