Corrections Annual Report - Volusia County Government
Corrections Annual Report - Volusia County Government
Corrections Annual Report - Volusia County Government

You also want an ePaper? Increase the reach of your titles
YUMPU automatically turns print PDFs into web optimized ePapers that Google loves.
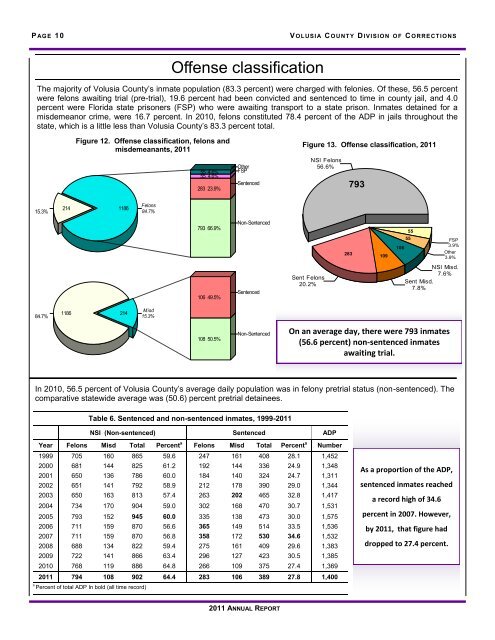
P AG E 10V OLUSI A COUNTY DIVISION OF CORRE CTIONSOffense classificationThe majority of <strong>Volusia</strong> <strong>County</strong>’s inmate population (83.3 percent) were charged with felonies. Of these, 56.5 percentwere felons awaiting trial (pre-trial), 19.6 percent had been convicted and sentenced to time in county jail, and 4.0percent were Florida state prisoners (FSP) who were awaiting transport to a state prison. Inmates detained for amisdemeanor crime, were 16.7 percent. In 2010, felons constituted 78.4 percent of the ADP in jails throughout thestate, which is a little less than <strong>Volusia</strong> <strong>County</strong>’s 83.3 percent total.Figure 12. Offense classification, felons andmisdemeanants, 201155 4.6%55 4.6%283 23.9%OtherFSPSentencedFigure 13. Offense classification, 2011NSI Felons56.6%79315.3%2141186Felons84.7%793 66.9%Non-Sentenced2831091065555FSP3.9%Other3.9%106 49.5%SentencedSent Felons20.2%NSI Misd.7.6%Sent Misd.7.8%84.7%1186 214Misd15.3%108 50.5%Non-SentencedOn an average day, there were 793 inmates(56.6 percent) non-sentenced inmatesawaiting trial.In 2010, 56.5 percent of <strong>Volusia</strong> <strong>County</strong>’s average daily population was in felony pretrial status (non-sentenced). Thecomparative statewide average was (50.6) percent pretrial detainees.Table 6. Sentenced and non-sentenced inmates, 1999-2011NSI (Non-sentenced) Sentenced ADPYear Felons Misd Total Percent a Felons Misd Total Percent a Number1999 705 160 865 59.6 247 161 408 28.1 1,4522000 681 144 825 61.2 192 144 336 24.9 1,3482001 650 136 786 60.0 184 140 324 24.7 1,3112002 651 141 792 58.9 212 178 390 29.0 1,3442003 650 163 813 57.4 263 202 465 32.8 1,4172004 734 170 904 59.0 302 168 470 30.7 1,5312005 793 152 945 60.0 335 138 473 30.0 1,5752006 711 159 870 56.6 365 149 514 33.5 1,5362007 711 159 870 56.8 358 172 530 34.6 1,5322008 688 134 822 59.4 275 161 409 29.6 1,3832009 722 141 866 63.4 296 127 423 30.5 1,3852010 768 119 886 64.8 266 109 375 27.4 1,3692011 794 108 902 64.4 283 106 389 27.8 1,400aPercent of total ADP In bold (all time record)As a proportion of the ADP,sentenced inmates reacheda record high of 34.6percent in 2007. However,by 2011, that figure haddropped to 27.4 percent.2011 ANNUAL REPORT