V OLUSI A COUNTY DIVISION OF CORRE CTIONS P AG E 11Admissions and releasesIn 2011, admissions decreased by 1 percent.Admissions and releases have increased each yearsince 1990 with the exception of 1995, 1998, 2001,2007 through 2011. This is the fifth year in a row thatadmissions have decreased.Table 7:Admissions and releases, 1996-2011Year Admissions ReleasesPercentchange inadmissionsGapadmissionsand releasesADP1996 24,506 24,173 7.0 333 1,3111997 25,258 25,182 3.1 76 1,3891998 24,454 24,062 -3.2 392 1,3601999 26,127 26,123 6.8 4 1,452Figure 14. Admissions vs. releases, 1996-2011Admissions Releases302826242000 27,416 26,579 4.9 837 1,3482001 25,919 26,066 -5.5 -147 1,3112002 26,772 26,395 3.3 377 1,3442003 27,794 27,623 4.7 171 1,4172004 28,278 28,156 1.7 122 1,5312005 28,844 28,803 2.0 41 1,5752006 29,538 29,434 2.4 104 1,5362007 29,323 29,892 -0.7 -569 1,5322008 28,641 29,094 -2.3 -453 1,3832009 27,920 27,937 -2.5 -17 1.385221996 1998 2000 2002 2004 2006 2008 20101997 1999 2001 2003 2005 2007 2009 2011Residence at admissionTable 7: Residence at admission, 2011<strong>Volusia</strong> <strong>County</strong> Number In-State Number Out-of-State NumberDaytona Beach 7,392 Palm Coast 304 Georgia 100DeLand 2,739 Orlando 290 New York 56Deltona 2,593 Sanford 202 Ohio 53Port Orange 1,845 Bunnell 88 North Carolina 43Ormond Beach 1,755 Crescent City 55 Pennsylvania 38New Smyrna Beach 1,191 Altamonte Spgs 38 Tennessee 32Holly Hill 1,134 Tampa 25 Michigan 24Edgewater 851 Other 1846 Other 503Orange City 787 Total 2,848 Total 849South Daytona 684DeBary 359Deleon Springs 278Oak Hill 182Pierson 156Daytona Beach Shores 136Osteen 121Lake Helen 96Seville 40Ponce Inlet 56Other 83Total 22,4782010 26,450 26,577 -5.3 -127 1,3692011 26,175 26,066 -1.0 109 1,400Table 8. Residency Totals and Percent, 2011NumberPercent<strong>Volusia</strong> <strong>County</strong> 22,478 85.9%In-State 2,848 10.9%Out-of-State 849 3.2%Total 26,175 100.0%Four out of five inmates report alocal <strong>Volusia</strong> <strong>County</strong> addressTypically, persons booked are <strong>Volusia</strong> <strong>County</strong> residents. In 2011, 22,478 inmates,or 85.9 percent, reported a local county address.There were 2,848 (10.9 percent) inmates who reported an out-of-county Florida address.Very few inmates booked were from out-of-state. Only 849 inmates reported an outof-stateaddress (3.2 percent).2011 ANNUAL REPORT
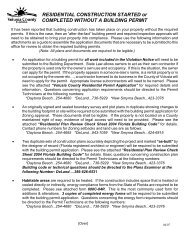
P AG E 12V OLUSI A COUNTY DIVISION OF CORRE CTIONSOffense at admissionIn 2011, drug offenses represented thegreatest number of bookings followed bytraffic and assault. Almost half of allarrests are for one of three offenses—traffic, assault, or drugs.least 1,000 bookings) listed in Table 9.Traffic and drug offenses account forabout 37 percent of all arrests whilearrests for assault remained about sameas it was in 2010.Almost 90 percent of all arrests are forone of the 10 most common offenses (atFigure 15. Assault, drug, and traffic bookings, 2007-2011Drug offensesrepresented thegreatest number andproportion ofbookings in 2011,closely followed bytraffic and assault.252015105200720082009201020110Assault Dangerous drugs Traffic49.5 percent of alladmissions are forone of threeoffenses: traffic,assault, or drugs.Table 9. Trends in the 10 most common offenses charged (at least 1,000) atadmission, 2010-20112010 2011Number % Number %Total, all offenses 47,277 100 46,552 100Assault 6,178 13.1% 5,874 12.6%Burglary 2,342 5.0% 2,731 5.9%Dangerous drugs 9,643 20.4% 8,994 19.3%Fraud 2,735 5.8% 2,345 5.0%Municipal ord violation a 1,262 2.7% 1,317 2.8%Invasion of privacy b 1,429 3.0% 1,499 3.2%Larceny 4,537 9.6% 5,000 10.7%Obstructing police 2,801 5.9% 2,664 5.7%Public peace 1,008 2.1% 1,152 2.5%Traffic 8,988 19.0% 8,205 17.6%Other 6,354 13.4% 6,771 14.5%a Includes municipal and county ordinances, drinking in public, obstruction of sidewalk, and violations ofhousing codes.b Includes entry with a weapon, driving on closed beach, possession of a police monitor, and entering andleaving management area without authorization.2011 ANNUAL REPORT