V OLUSI A COUNTY DIVISION OF CORRE CTIONSP AG E 7Comparison of statewide ADP and incarceration ratesTable 2: Comparison of Florida counties with an average daily populationnear or greater than 1,000 inmates, 2009-2011<strong>County</strong> populationADPNumber andpercent changeIncarceration rate a2009 2010 b 2011 c 2009 2010 2011 2010 to 2011 2009 2010 2011Miami-Dade 2,472,344 2,496,435 2,470,598 5,512 5,858 5,631 -227 -3.9% 2.2 2.3 2.3Broward 1,744,922 1,748,066 1,749,409 4,441 4,549 4,495 -54 -1.2% 2.5 2.6 2.6Orange 1,108,882 1,145,956 1,106,919 3,542 3,632 3,423 -209 -5.8% 3.2 3.2 3.1Hillsborough 1,196,892 1,229,226 1,202,085 3,042 3,227 2,978 -249 -7.7% 2.5 2.6 2.5Duval 900,518 86,4263 900,694 3,470 3,809 3,987 178 4.7% 3.9 4.4 4.4Pinellas 931,113 91,6542 926,670 2,886 3,171 3,087 -84 -2.6% 3.1 3.5 3.3Palm Beach 1,287,344 1,320,134 1,282,808 2,463 2,242 1,561 -681 -30.4% 1.9 1.7 1.2Polk 584,343 602,095 580,855 2,080 2,208 2,091 -117 -5.3% 3.6 3.7 3.6Lee 615,124 618,754 613,235 1,719 1,782 1,719 -63 -3.5% 2.8 2.9 2.8Marion 330,440 331,298 325,513 1,513 1,705 1,686 -19 -1.1% 4.6 5.1 5.2Escambia 312,980 297,619 308,557 1,448 1,637 1,499 -138 -8.4% 4.6 5.5 4.9Brevard 555,657 543,376 553,683 1,284 1,601 1,620 19 1.2% 2.3 2.9 2.9St. Lucie 272,864 277,789 272,633 1,279 1,295 1,249 -46 -3.6% 4.7 4.7 4.6<strong>Volusia</strong> 507,105 494,593 503,120 1,385 1,369 1,400 31 2.3% 2.7 2.8 2.8Manatee 318,404 322,833 319,077 1,053 1,060 1,010 -50 -4.7% 3.3 3.3 3.2Pasco 439,786 464,697 439,824 1,147 1,360 1,356 -4 -0.3% 2.6 2.9 3.1Collier 333,032 321,520 331,305 905 911 922 11 1.2% 2.7 2.8 2.8Osceola 272,788 268,685 275,253 1,061 1,010 911 -99 -9.8% 3.9 3.8 3.3Leon 274,803 275,487 273,280 901 987 966 -21 -2.1% 3.3 3.6 3.5Sarasota 389,320 379,448 388,262 857 890 897 7 0.8% 2.2 2.3 2.3Lake 291,993 297,052 296,293 1,178 1,328 915 -413 -31.1% 4.0 4.5 3.1Alachua 256,232 247,336 253,785 898 1,043 1,036 -7 -0.7% 3.5 4.2 4.1Average and percent change for counties near or greater than 1,000 ADP in 2011 -102 -5.1% 3.2 3.4 3.3(Source: 2009-2011 Florida <strong>County</strong> Detention Facilities’ Average Inmate Populations, <strong>Annual</strong> <strong>Report</strong>s, Florida Department of <strong>Corrections</strong>, Bureau of Planning,Research, and Statistics, Tallahassee, Florida) a Number of residents incarcerated per 1,000 residents. b Data from the U.S.. Census Bureau, c Data from the FloridaDepartment of <strong>Corrections</strong> 2011 <strong>Annual</strong> <strong>Report</strong>, Bureau of Planning, Research, and Statistics, Tallahassee, Florida)Table 3: Average Incarceration RatesPer 1,000 <strong>County</strong> Population in 20111.0 and 0.9 (4 = 6.0 percent)Flagler, Gilchrist, Palm Beach, Union2.0 to 2.9 (13 = 19.4 percent)Brevard, Broward, Clay, Collier, Gulf, Hillsborough, Lee, Miami-Dade,Okaloosa, Sarasota, Seminole, St. Johns, <strong>Volusia</strong>3.0 to 3.9 (21 = 31.3 percent)Calhoun, Charlotte, Hardee, Hernando, Highlands, Holmes, Indian River,Jefferson, Lafayette, Leon, Madison, Manatee, Nassau, Orange, Osceola,Pasco, Pinellas, Polk, Santa Rosa, Sumter, Suwannee4.0 and OVER (29= 43.3 percent)Alachua, Baker, Bay, Bradford, Citrus, Columbia, DeSoto, Dixie, Duval,Escambia, Franklin, Gadsden, Glades, Hamilton, Hendry, Jackson, Lake,Levy, Liberty, Marion, Martin, Monroe, Okeechobee, Putnam, St. Lucie,Taylor, Wakulla, Walton, Washington3.73.53.33.12.92.7Figure 7. Florida incarceration rates for all 67 counties, 2001-2011Incarceration rates per 1,0003.13.3 3.33.53.4 3.42001 2002 2003 2004 2005 2006 2007 2008 2009 2010 2011Florida Department of <strong>Corrections</strong> 2011 <strong>Annual</strong> <strong>Report</strong>, Bureau of Planning, Research, andStatistics, Tallahassee, Florida)3.63.53.23.13.0Florida Department of <strong>Corrections</strong> 2011 <strong>Annual</strong> <strong>Report</strong>, Bureau of Planning,Research, and Statistics, Tallahassee, Florida) <strong>Volusia</strong> <strong>County</strong> has one of the lowest incarceration rates in the state at 2.82011 ANNUAL REPORT
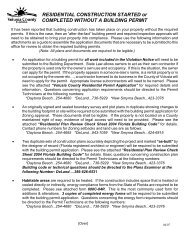
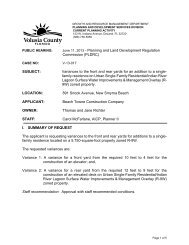
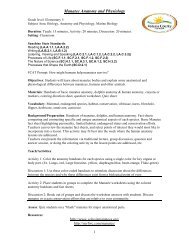
P AG E 8V OLUSI A COUNTY DIVISION OF CORRE CTIONSJail capacity and constructionThe estimated rated capacityfor all jail jurisdictions atmidyear 2010 reached866,974 beds, an increase of2.0% (17,079 beds) frommidyear 2009. This was lessthan the average annualincrease each year since2000 (2.5% or 22,281 beds).Rated capacity is themaximum number of beds orinmates allocated to each jailfacility by a state or local rating official. The percentage ofcapacity occupied at midyear 2010 (86.4%) was the lowestsince 1984. Overall, the nation’s jails were operating at about86% of rated capacity on an average day and about 91% ofrated capacity on their most crowded day in June 2010.Source: Prison and Jail Inmates at Midyear 2010 Bureau ofJustice Statistics)In comparison, <strong>Volusia</strong> <strong>County</strong> operated at 91.6 percent of itsauthorized design capacity in 2010, which represented adecrease of more than 10 percent from 2007 when it operatedat 102 percent capacity. <strong>Volusia</strong> <strong>County</strong> has not added a newfacility or performed any major renovations since theconstruction of the <strong>Volusia</strong> <strong>County</strong> Branch Jail in 1987. The<strong>Corrections</strong> Division continues to work with criminal justiceagencies, the <strong>Volusia</strong> <strong>County</strong> Council, the judiciary, lawenforcement, state attorney, public defender and defenseattorneys to manage the inmate population.This collaborative effort, known as the Public SafetyCoordinating Council, makes policy which expedites caseprocessing, releases and/or diverts nonviolent offenders tocommunity-based programs. These efforts help control thedaily inmate population. However, urbanization, economicconditions, tougher sentencing, and vigorous law enforcementeffort will affect the ability to control future inmate growth andwill present major challenges in the coming years.6021,3841,575Figure 8. Average daily populationgrowth, 1982-20111982 1986 1990 1994 1998 2002 2006 20111,400Figure 9. Historical growth and population projections to 2025ADP19001700150013001100900Historical ADP 1986 to 2011Jail's authorized capacity - 1,4941st proactive effort tocontrol jail population2005 Record ADP - 1,5752011 ADP - 1,400Projected ADP 2012 to 20252.5 Percent Unlikely Case Growth ScenarioRed Line*** * * * * * * * * * * * * ++ + + + + + + + + + + + + +Flat line growth 0%2015 Best Case Growth ScenarioBlue Line (Based on projected2.8 Incaceration rate)7002nd Proactive effort CriminalJustice Coordinating Council50086 90 94 98 02 06 10 15 20 252011 ANNUAL REPORT