Hydro Annual Report 2011b
Hydro Annual Report 2011b
Hydro Annual Report 2011b

You also want an ePaper? Increase the reach of your titles
YUMPU automatically turns print PDFs into web optimized ePapers that Google loves.
<strong>Annual</strong> <strong>Report</strong> – 2011
2<br />
AnnuAl report<br />
Key figures and highlights<br />
Key figures<br />
Amounts in NOK million unless other unit indicated 2011 2010<br />
Revenue 91 444 75 754<br />
Underlying EBIT : a<br />
Bauxite & Alumina 887 633<br />
Primary Metal 2 486 617<br />
Metal Markets 441 321<br />
Rolled Products 673 864<br />
Extruded Products 151 444<br />
Energy 1 883 1 416<br />
Other and eliminations (389) (945)<br />
Total 6 133 3 351<br />
Income (loss) from continuing operations 6 749 2 118<br />
Underlying return on average capital employed<br />
(RoaCE), percent 6.5% 4.0%<br />
Investments b<br />
48 025 6 231<br />
Total assets 132 554 88 788<br />
Share price year-end, NOK 27.74 42.61<br />
Dividend per share, NOK 0.75 0.75<br />
Number of employees, year-end c<br />
22 655 18 894<br />
Recordable injuries, per million hours worked 3.8 3.7<br />
Greenhouse gas emissions, million tonnes CO2e d 7.3 7.7<br />
a<br />
Underlying EBIT<br />
Underlying EBIT increased to<br />
NOK 6,133 million compared with<br />
NOK 3,351 million in 2010, driven by<br />
higher realized alumina and aluminium<br />
prices and higher production volumes,<br />
mainly due to the Vale acquisition.<br />
Underlying results for <strong>Hydro</strong>’s<br />
downstream operations were<br />
impacted by weaker markets which<br />
declined in the second half of 2011.<br />
b<br />
Investments<br />
During 2011, <strong>Hydro</strong> continued to focus<br />
on liquidity and sustaining capital<br />
expenditures. Except for Vale<br />
Aluminium, investments were mainly<br />
related to maintenance activities to<br />
safeguard our production assets.<br />
Highlights<br />
IMPROvED<br />
PERfORMANCE<br />
AMID MARKET<br />
UNCERTAINTy<br />
Underlying operating results<br />
improved in 2011, driven by<br />
higher alumina and aluminium<br />
prices and higher production<br />
volumes. Bauxite & Alumina<br />
achieved significant operational<br />
improvements throughout the<br />
year. Weaker markets in the<br />
second half of the year<br />
impacted results, in particular<br />
for <strong>Hydro</strong>’s downstream<br />
business in Europe.<br />
Deteriorating market conditions<br />
and cost pressure led to<br />
write-downs in the fourth<br />
quarter. Significant measures<br />
have been implemented to<br />
reduce costs and improve<br />
efficiency throughout <strong>Hydro</strong>’s<br />
organization.<br />
c<br />
Number of employees<br />
The increase in number of employees<br />
from 2010 to 2011 is mainly due to the<br />
acquisition of Vale’s former aluminium<br />
business in Brazil, while restructuring<br />
measures elsewhere in the company,<br />
especially within <strong>Hydro</strong> Building<br />
Systems, had an opposit effect on the<br />
overall level.<br />
WELL<br />
POSITIONED<br />
<strong>Hydro</strong> enters 2012 fully<br />
integrated throughout the value<br />
chain and well positioned<br />
among the leaders in the<br />
aluminium industry. Building on<br />
its strong position in a world<br />
with limited resources, <strong>Hydro</strong><br />
will be proactive in securing the<br />
performance of its existing<br />
business and exploiting new<br />
opportunities. Prepared for a<br />
challenging period ahead,<br />
<strong>Hydro</strong> will take the steps<br />
necessary to secure its<br />
operating results and sound<br />
financial position including a<br />
strong emphasis on safety.<br />
d<br />
Greenhouse gas emissions<br />
Due to the Vale aluminium acquisition<br />
<strong>Hydro</strong>’s climate gas emissions from<br />
consolidated activities increased<br />
significantly in 2011. However,<br />
emissions from the company’s<br />
smelters – per ton produced – are<br />
steadily decreasing. Figures include<br />
historical emissions from current<br />
operations.
<strong>Annual</strong> <strong>Report</strong><br />
– 2011<br />
HyDRO’S REPORTING 2011<br />
The enclosed Board of Directors report, together with the Financial<br />
Statements and accompanying notes, fulfills <strong>Hydro</strong>’s Norwegian<br />
statutory requirements for annual reporting. The remainder of the<br />
<strong>Annual</strong> <strong>Report</strong> includes additional information about <strong>Hydro</strong>’s<br />
business, viability performance, financial and operating performance,<br />
risk, shareholder information and corporate governance.<br />
The “<strong>Annual</strong> report - 2011” is available in PDF-format on our website<br />
www.hydro.com/reporting2011 in English. The “Board of Directors’<br />
report and Financial Statements - 2011” is also available in PDFformat<br />
as a separate document in both English and Norwegian. All<br />
parts of the reports can be downloaded and printed in PDF-format,<br />
together with additional, supplementary information. Paper copies of<br />
the reports can also be ordered on our website.<br />
RESULTS IMPROvE<br />
Higher prices and production volumes lift underlying operating results<br />
<strong>Hydro</strong>’s underlying results improved in 2011, driven by higher alumina<br />
and aluminum prices and increased production mainly due to the Vale<br />
acquisition. Underlying EBIT increased to NOK 6,133 million from NOK<br />
3,351 million in 2010.<br />
Primary aluminium production amounted to 2 million mt and we<br />
delivered 3.3 million mt of casthouse products to internal and external<br />
customers. Downstream, we shipped roughly 930 kmt of rolled<br />
products and 535 kmt of extruded products to the market. Our Energy<br />
operations produced 9.6 TWh of renewable hydroelectric power.<br />
AnnuAl report<br />
Index<br />
3<br />
Board of Directors’ report p.10<br />
<strong>Hydro</strong>’s Board of Directors’ report including<br />
key developments.<br />
01: Business description p.21<br />
Detailed operating information is provided for each<br />
of <strong>Hydro</strong>’s businesses including industry overview. Key<br />
regulatory and taxation issues are also outlined.<br />
02: viability performance p.49<br />
The <strong>Hydro</strong> Way forms the basis for our viability<br />
reporting which includes energy and climate change, resource<br />
management, integrity and human rights, community impact,<br />
organization and work environment and innovation.<br />
03: financial and operating performance p.81<br />
Financial and operating results are discussed per business segment and<br />
sub-segment as well as financial income/expense and income tax for <strong>Hydro</strong>.<br />
In addition disclosures about liquidity and capital resources and return on<br />
capital are provided.<br />
04: Risk review p.107<br />
<strong>Hydro</strong>’s risks are described in relation to financial<br />
and commercial risk, operational risk, strategic risk,<br />
compliance risk and market risk.<br />
05: Shareholder information p.115<br />
Read about our share price development, dividend policy,<br />
funding and credit rating policy, the <strong>Annual</strong> General Meeting<br />
and the financial calendar for 2010.<br />
06: Corporate governance p.121<br />
<strong>Hydro</strong>’s corporate governance practice is described in<br />
relation to regulatory compliance, corporate directives and<br />
code of conduct and our governance bodies.<br />
07: financial statements p.f1<br />
<strong>Hydro</strong> prepares its financial statements according to<br />
International Financial <strong>Report</strong>ing Standards (IFRS). Both<br />
<strong>Hydro</strong>s’s consolidated financial statements and the financial<br />
statements for the parent company Norsk <strong>Hydro</strong> ASA<br />
are provided.<br />
08: Appendix p.A1<br />
Terms and definitions.
4<br />
AnnuAl report<br />
<strong>Hydro</strong> in brief<br />
Geographical distribution of operating revenues<br />
NOK million 91,444<br />
Norway 2%<br />
Germany 18.5%<br />
Great Britain 5.6%<br />
France 5.3%<br />
Italy 5.5%<br />
Spain 3.6%<br />
Poland 2.6%<br />
�e Netherlands 2.1%<br />
Austria 2.1%<br />
Other EU 8.4%<br />
Switzerland 9.3%<br />
Other Europe 3.4%<br />
USA 8.9%<br />
Canada 0.3%<br />
Other Americas 3.4%<br />
Asia 17.4%<br />
Australia and New Zealand 1.2%<br />
Africa 0.5%<br />
Our Business<br />
<strong>Hydro</strong> is a resource rich, fully integrated aluminium company<br />
with operations in all major activities along the aluminium<br />
industry’s value chain.<br />
Our new business area, Bauxite & Alumina, includes one of<br />
the world’s largest bauxite mines and the world’s largest and<br />
one of the most cost effective alumina refineries, both located<br />
in Brazil. We have primary metal production facilities in<br />
Europe, Canada, Australia, Brazil and Qatar. We are a leading<br />
worldwide supplier of value-added casthouse products,<br />
such as extrusion ingots, sheet ingots and foundry alloys. In<br />
2011, we delivered 3.3 million metric tons of products to<br />
internal and external customers, mainly from casthouses<br />
integrated with our primary smelters and from an extensive<br />
network of specialized remelt facilities close to customers in<br />
Europe and the U.S.<br />
We are an industry leader as a supplier to a range of downstream<br />
markets, in particular the building, packaging, lithographic,<br />
automotive and transport sectors. We deliver<br />
high-quality, energy-saving aluminium products and solutions,<br />
and have strong positions in markets that provide<br />
opportunities for good financial returns.<br />
With more than 100 years of experience in hydropower, <strong>Hydro</strong><br />
is the second-largest power producer in Norway, and the largest<br />
privately owned producer. We have substantial, self-generated<br />
power capacity to support our production of primary<br />
metal, and are engaged in a number of initiatives to secure<br />
competitive power supplies for our aluminium operations and<br />
to grow our aluminium business.<br />
Project management competence has been and continues to be<br />
crucial to our business. We have a single organization responsible<br />
for the execution of all construction projects, with dedicated<br />
teams, defined work processes and supporting systems<br />
and procedures.<br />
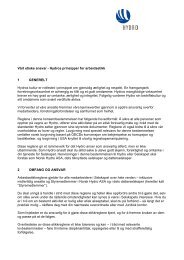
Primary aluminium production<br />
1,000 metric tons<br />
2,000<br />
1,600<br />
1,200<br />
800<br />
400<br />
0<br />
2004<br />
2005<br />
2006<br />
2007<br />
2008<br />
2009<br />
2010<br />
The <strong>Hydro</strong> Way<br />
The <strong>Hydro</strong> Way is our approach to business, an approach that<br />
has existed within our company from the beginning and that<br />
has underpinned our success over the years.<br />
The <strong>Hydro</strong> Way defines our identity - our distinct set of characteristics<br />
- and constitutes a unique way of doing things that<br />
differentiates us from other companies. It also describes how<br />
we run our business in terms of:<br />
• Our mission<br />
• Our values<br />
• Our talents<br />
• Operating model<br />
• Strategic direction<br />
See page 50 for more information about The <strong>Hydro</strong> Way.<br />
2011<br />
Employees<br />
<strong>Hydro</strong>’s organization is made up of about 23,000 employees in 40<br />
countries. These employees represent great diversity, in terms of<br />
education, experience, gender, age and cultural background. We<br />
see this diversity as a significant resource, not least to encourage<br />
innovation. To be able to pull together as a team we depend on an<br />
efficient organization with common values and goals. Good leadership,<br />
proper organizational structure and the right tools are all<br />
essential if we are to achieve this. This includes attracting - and<br />
retaining - the right employees. See page 62 for more information<br />
about our organization.<br />
Key Developments<br />
Underlying EBIT increased to NOK 6,133 million compared<br />
with NOK 3,351 in 2010, driven by higher realized alumina<br />
and aluminium prices and higher production volumes, mainly<br />
due to the vale Aluminium acquisition. Underlying results for<br />
<strong>Hydro</strong>’s downstream operations were impacted by weaker<br />
markets which declined in the second half of 2011 due to<br />
increasing uncertainty relating to global economic developments<br />
and Europe in particular.
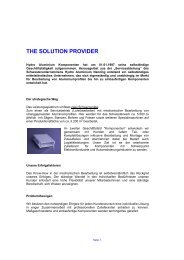
Aluminium market price weakens<br />
LME 3-month in USD/metric tons<br />
3,000<br />
2,750<br />
2,500<br />
2,250<br />
2,000<br />
1,750<br />
1,500<br />
Jan<br />
2010<br />
Apr<br />
2010<br />
Jul<br />
2010<br />
Oct<br />
2010<br />
Jan<br />
2011<br />
Apr<br />
2011<br />
Jul<br />
2011<br />
Oct<br />
2011<br />
Jan<br />
2012<br />
Due to deteriorating market conditions and cost pressures,<br />
<strong>Hydro</strong> wrote down fixed assets by NOK 1.3 billion in the<br />
fourth quarter of 2011. Responding to market developments,<br />
<strong>Hydro</strong> has reduced remelt production, curtailed higher cost<br />
production and reinforced improvements achieved earlier. Significant<br />
measures have been implemented to turn around our<br />
building systems operations.<br />
<strong>Hydro</strong> established its new Bauxite & Alumina business area in<br />
2011 with the acquisition of world-class bauxite and alumina<br />
operations from vale. Significant improvements in operational<br />
stability and capacity utilization were achieved during 2011.<br />
<strong>Hydro</strong>’s new Qatalum smelter in Qatar reached full production<br />
capacity during the third quarter, contributing to<br />
increased production during the year.<br />
Qatalum and Albras in Brazil have contributed to a significant<br />
increase in electrolysis capacity for <strong>Hydro</strong>’s Primary Metal operations,<br />
which has reached 2.4 million metric tons. Cumulative<br />
operating cost improvements have been achieved, representing<br />
roughly NOK 1 billion compared to 2009. However this was<br />
more than offset by higher prices for key raw materials. Cost pressure<br />
has increased for the aluminium industry in general, exacerbated<br />
by a decline in LME prices to relatively weak levels.<br />
Portfolio restructuring continued in 2011 with the sale of<br />
<strong>Hydro</strong>’s non-strategic 20.9 percent interest in the Norwegian<br />
power company, SKS Produksjon, and divestment of its 35<br />
percent interest in the curtailed Alpart alumina refinery, resulting<br />
in total gains amounting to roughly NOK 1.1 billion.<br />
Climate gas emissions per metric ton from our smelters<br />
declined in 2011. <strong>Hydro</strong> did not achieve its safety target in<br />
2011 and suffered three fatal accidents.<br />
Strategic Direction<br />
<strong>Hydro</strong> enters 2012 fully integrated throughout the value chain,<br />
with a global business model based on measured performance.<br />
AnnuAl report<br />
<strong>Hydro</strong> in brief<br />
Estimated primary aluminium cash cost<br />
In USD/metric tons<br />
2,500<br />
2,000<br />
1,500<br />
1,000<br />
500<br />
0<br />
2008<br />
2009<br />
2010<br />
Estimated cash cost excluding LME-linked alumina cost<br />
Estimated LME-linked alumina cost<br />
2011<br />
We are prepared for a challenging period ahead and will take the<br />
steps necessary to secure our operating results and sound financial<br />
position, including a strong emphasis on safety.<br />
Our new Bauxite & Alumina business ensures the supply of key<br />
raw materials to our own operations, enhances our alumina<br />
market position, and creates a strong platform for further<br />
growth. Our main goal for this business in the coming year will<br />
be to reduce operating costs and further improve the capacity<br />
utilization and efficiency of our activities.<br />
To improve the competitiveness of our Primary Metal operations,<br />
we have targeted cost improvements of USD 300 per mt<br />
for our wholly-owned smelters by the end of 2013. following<br />
the completion of a successful ramp-up, we will focus on securing<br />
stable production and the first quartile cost position of<br />
Qatalum in the coming year.<br />
Metal Markets will utilize its position as the leading world-wide<br />
supplier of metal products and our flexible and extensive multisourcing<br />
network to respond to market conditions and create<br />
additional value. Exploiting the full production volumes of<br />
Qatalum will be a key priority.<br />
Improving returns for our Extruded Products and Rolled Products<br />
operations will be a strong focus area in the uncertain markets<br />
expected in 2012. Key priorities will be differentiation and<br />
continuous cost reduction to secure margins, while protecting<br />
our market share.<br />
A key priority for our Energy business will be enhancing the<br />
value of our power production assets, including further optimization<br />
activities. Efforts aimed at sourcing competitive energy<br />
for <strong>Hydro</strong>’s global operations will be strengthened.<br />
<strong>Hydro</strong> is committed to safe operations in all of its business operations.<br />
In 2011, we enhanced our strategy related to people,<br />
social responsibility and the environment.<br />
5
6<br />
AnnuAl report<br />
Letter to shareholders<br />
Short-term challenges<br />
– long-term opportunities: Future proof<br />
Aluminium is an essential building block of modern society and<br />
a surprisingly big part of life. Being an industry leader in a sector<br />
expecting 70 percent growth in demand within the decade should be a<br />
great position for the future. Despite the current economic turbulence,<br />
I have never been more certain that we are future proof.<br />
While financially speaking, aluminium has been challenging<br />
over the past decade, it may not be because of a lack of confidence,<br />
but paradoxically because of an over-confidence in aluminium.<br />
An exaggerated optimism has led to over-investment<br />
and surplus capacity, weighing down prices and profitability,<br />
amplified by weaker demand due to the financial and economic<br />
unrest that started in 2008.<br />
Now placed somewhere between crisis and recovery and in<br />
a multi-speed global economy, our global businesses are<br />
exposed to both flourishing and contracting markets at the<br />
same time. China still drives growth, although at a slower rate<br />
– and while this aluminium giant is still self-supplied with<br />
metal, we can expect increasing imports of bauxite. But with a<br />
slower overall global growth rate, a prolonged European debt<br />
crisis and a U.S. economy that is far from recovery, there is still<br />
plenty of uncertainty looming.<br />
freedom to act<br />
Given the current uncertainty, we cannot count on the market<br />
to lift our profitability, at least not in the short term. We are<br />
focusing our efforts on what we ourselves can do to improve,<br />
further reinforcing our repositioning measures and performance<br />
improvement programs, firmly controlling costs and<br />
margins. We are also maintaining our financial robustness,<br />
rather than focusing on new capacity investments in a situation<br />
of oversupply.<br />
Short-term cash preservation is not the same as having a<br />
short and narrow perspective. On the contrary, it is a crucial<br />
means to safeguard our long-term freedom to act. It was financial<br />
prudence during the financial crisis that enabled us to pursue<br />
and close the vale deal, which would otherwise have been<br />
inconceivable.<br />
It is a balancing act to be dimensioned and designed to<br />
resist short-term volatility, while at the same time preparing<br />
for a future market that eventually will continue to grow.<br />
Still, even the demanding challenges facing us should be<br />
regarded more as an opportunity than a liability. It is often<br />
when confronted with a need to change that we find new<br />
ideas, new solutions, re-think established truths, modernize<br />
structures and habits that may be out of date, and shape the<br />
company for tomorrow.<br />
Improvement culture<br />
The will to improve should be an integrated part of everyday<br />
work. In fact, operational improvements implemented last<br />
year helped offset large parts of the negative impact from deteriorating<br />
markets during the second half of last year. It is<br />
encouraging to see that we are able to transform plans and<br />
ambitions into tangible results.<br />
Qatalum reached full production in 2011. The aim now is<br />
to stabilize operations in the best quartile of the global industry.<br />
Qatalum is already producing above its nameplate<br />
capacity.<br />
Within our Brazilian operations, performance has been stabilized<br />
at a significantly higher level than the previous year. In<br />
the bauxite mine Paragominas, production increased by 23<br />
percent and in the alumina refinery Alunorte by 9 percent.<br />
The Primary Metal improvement program proceeds according<br />
to plan for a USD 300 cost reduction per metric ton of<br />
aluminium by the end of 2013. Similar programs and reviews<br />
with a multitude of actions and measures are ongoing in the<br />
other business areas.<br />
Our researchers are determined in their efforts to realize the<br />
twin goals boosting productivity and curbing energy consumption.<br />
The HAL4e electrolysis cells in Årdal, Norway, are<br />
now running at only 12.5 kWh/kilo of produced aluminium.<br />
Downstream, our researchers manipulate aluminium at the<br />
nano level to generate alloys that have tailor-made properties<br />
for its specific use.<br />
It’s satisfying to see better results. It’s even more satisfying<br />
when they result from great accomplishments.<br />
InspirationAL<br />
The philosophy of continuous improvement - performing better<br />
today than yesterday, better tomorrow than today - should<br />
always inspire us. The will and ability to adapt and change is<br />
key to success, and surprisingly often for the mutual benefit of<br />
business, people and society.<br />
Economic uncertainty can act as a catalyst for change, as<br />
should the climate challenge. The world needs to turn words<br />
into action to combat climate change. In this context, developing<br />
the solutions the world needs to fight climate change, such<br />
as lightweight vehicles, energy-efficient buildings and lower-
cost renewable energy production, will be highly appreciated<br />
and well rewarded.<br />
As a global aluminium champion we have a responsibility<br />
to address the climate challenge, we have the ability to contribute<br />
and I am convinced it will be profitable in the long run.<br />
Challenge responsibly<br />
I believe that aluminium, with its versatile range of properties,<br />
is part of the solution. And I believe that The <strong>Hydro</strong> Way of<br />
doing things is a healthy approach to survive and prosper even<br />
in troubled times. There is a clear connection between performing<br />
well in all aspects of everyday operations and in<br />
achieving the deserved bottom line results.<br />
I am deeply saddened by the fact that three of our colleagues<br />
did not return safely home due to fatal accidents at<br />
<strong>Hydro</strong> plants last year. Zero is the maximum number of fatalities<br />
we can accept. Our operations, precautions and ability to<br />
avoid high-risk incidents should be so good that accidents like<br />
this simply do not happen.<br />
Also, the environmental impact of our operations must be<br />
minimized, regarding greenhouse gas emissions (GHG),<br />
energy consumption, waste, water and biodiversity. I am<br />
pleased that GHG emissions from <strong>Hydro</strong>’s comparable operations<br />
decreased further by 5 percent last year. following the<br />
integration of the vale aluminium assets and after Qatalum<br />
moved into full production, <strong>Hydro</strong>’s nominal GHG emissions<br />
increased. We are committed to continue our determined<br />
efforts in technology development and operational improvements<br />
to resume our long trend in the right direction.<br />
When it comes to the impact of mining and refinery operations,<br />
<strong>Hydro</strong> has plenty to learn, but I also believe that we have<br />
something to contribute. We have become member of the International<br />
Council on Mining and Metals (ICMM) to benefit<br />
from advice from our peers, to report and to exchange knowl-<br />
“We have a<br />
responsibility to address<br />
the climate challenge, we have<br />
the ability to contribute and<br />
I am convinced it will be<br />
profitable in the long run.”<br />
Svein Richard Brandtzæg<br />
President & CEO<br />
AnnuAl report<br />
Letter to shareholders<br />
edge and best practices. In the communities where we now<br />
operate in Brazil, we initiate and take part in important community<br />
infrastructure, social and environmental programs.<br />
We enjoy a very good relationship with local unions. I believe<br />
that we have something to contribute by taking our “<strong>Hydro</strong><br />
model” of respect and cooperation with us to Brazil – and I am<br />
convinced that the unions have a lot to contribute to <strong>Hydro</strong>.<br />
<strong>Hydro</strong> is affiliated with the UN initiative Global Compact,<br />
takes part in the World Business Council for Sustainable<br />
Development and is included on the Dow Jones Sustainability<br />
Indexes and fTSE4Good.<br />
The metal and material of the future<br />
I am still convinced that aluminium is the metal of the future.<br />
Aluminium shall not only take part in creating growth and prosperity<br />
the next decades, but also be a part of the solution to bringing<br />
about growth in a way that respects the limits of nature, people<br />
and society and the limited resources that we all depend upon.<br />
Aluminium is an energy bank. The energy is not wasted<br />
when turned into aluminium, the energy is stored in the metal,<br />
enabling it to be recycled time and again and turned into new<br />
products that we need every day. Consequently, 75 percent of all<br />
aluminium ever produced is still in use. As millions strive to<br />
climb out of poverty and into the global middle-class aluminium<br />
both plays a role in enabling infrastructure developments<br />
and in saving much of the energy and emissions this otherwise<br />
positive development implies. Aluminium is future proof.<br />
Building a bridge between short-term challenges and longterm<br />
opportunities for aluminium is a balancing act and requires<br />
determined efforts. We will challenge our minds, talents and<br />
efforts to solve the challenges ahead, because the long-term prospects<br />
of aluminium are promising and we look forward to take<br />
part in shaping that future.<br />
7
8<br />
AnnuAl report<br />
Board and Management<br />
Board and Management<br />
Board of Directors<br />
From left to right: Eva Persson, Inge K. Hansen, Billy Fredagsvik, Terje Vareberg, Tito Botelho Martins Jr., Sten Roar Martinsen, Bente Rathe, Liv Monica Bargem Stubholt,<br />
Finn Jebsen and Ove Ellefsen.<br />
General Meeting<br />
of Shareholders<br />
Nomination<br />
Committee<br />
Corporate<br />
Assembly<br />
Compensation<br />
Committee<br />
Board of<br />
Directors<br />
Audit<br />
Committee<br />
Internal Audit<br />
President<br />
and CEO<br />
Corporate<br />
Management Board
Corporate Management Board<br />
AnnuAl report<br />
Board and Management<br />
From left to right: Hans-Joachim Kock, Jørgen C. Arentz Rostrup, Hilde Merete Aasheim, Svein Richard Brandtzæg, Oliver Bell, Kjetil Ebbesberg, Arvid Moss, Tom Røtjer,<br />
Wenche Agerup and Johnny Undeli.<br />
Bauxite &<br />
Alumina<br />
Johnny Undeli<br />
CFO<br />
Jørgen C. Arentz Rostrup<br />
Energy and<br />
Corporate Business<br />
Development<br />
Arvid Moss<br />
Primary Metal<br />
Hilde M.<br />
Aasheim<br />
CEO<br />
Svein Richard<br />
Brandtzæg<br />
Metal Markets<br />
Kjetil<br />
Ebbesberg<br />
Communication<br />
Inger Sethov<br />
Corporate Staffs and General Counsel<br />
Wenche Agerup<br />
Rolled Products<br />
Oliver Bell<br />
Extruded Products<br />
Hans-Joachim<br />
Kock<br />
9<br />
Projects<br />
Tom Røtjer
10<br />
BoArD oF DIreCtors’ report<br />
Key developments<br />
Board of Directors’ report<br />
(Taken from “financial statements and Board of Directors<br />
report – 2011”)<br />
Key developments<br />
In 2011, <strong>Hydro</strong> completed the transformation of its business into<br />
a resource rich, fully integrated aluminium company with the<br />
integration of the vale Aluminium operations. With a global<br />
business model based on measured performance, the company is<br />
well positioned among the leaders in the aluminium industry.<br />
The establishment of our new Bauxite & Alumina business area<br />
secures the supply of key raw materials to <strong>Hydro</strong>’s own operations<br />
and creates a strong platform for future growth. These<br />
assets, including the Paragominas bauxite mine and Alunorte<br />
alumina refinery, are technologically advanced, cost-competitive<br />
and integrated through a pipeline that delivers bauxite for processing<br />
into high-grade alumina. The completion of our new<br />
world-class smelter, Qatalum, and the integration of Albras in<br />
Brazil, has significantly increased <strong>Hydro</strong>’s electrolysis capacity to<br />
2.4 million metric tons.<br />
Prepared for a challenging period ahead<br />
There has been a significant increase in uncertainty regarding<br />
economic developments within certain countries and geographic<br />
regions in which <strong>Hydro</strong> operates. In Europe, the fiscal<br />
crisis has escalated resulting in deteriorating economic conditions<br />
in several countries and in Southern Europe in particular.<br />
Recovery has been weak in the US and growth has slowed in<br />
China and other major emerging markets. Cost pressure has<br />
increased for the aluminium industry in general. The negative<br />
effects have been exacerbated by a decline in LME prices to relatively<br />
weak levels. Due to the deteriorating market conditions<br />
and cost pressures, <strong>Hydro</strong> wrote down fixed assets by NOK 1.3<br />
billion in the fourth quarter of 2011.<br />
<strong>Hydro</strong> has concentrated on maintaining and reinforcing improvements<br />
achieved following the previous downturn. The company<br />
has a robust financial position and is prepared to meet the challenges<br />
ahead. Capital investments have been reduced and <strong>Hydro</strong><br />
has maintained a strong focus on operating capital. Substantial<br />
cost reductions have been achieved throughout the organization.<br />
Responding to market developments toward the end of 2011,<br />
<strong>Hydro</strong> reduced remelt production and strengthened its emphasis<br />
on improvement programs and financial discipline. Due to<br />
market conditions, the company decided not to restart the<br />
remaining 85,000 metric tons (mt) of curtailed capacity at our<br />
Sunndal smelter. In January 2012, <strong>Hydro</strong> also decided to curtail<br />
60,000 mt of production at its Kurri Kurri aluminium smelter<br />
which has been negatively impacted by low aluminium prices,<br />
increased raw material costs and the strong Australian dollar. No<br />
restart of previously curtailed capacity is currently planned.<br />
1) Calculated on a consolidated basis excluding <strong>Hydro</strong>’s 50 percent interest in Qatalum.<br />
Due to a continued decline in market demand, <strong>Hydro</strong> has<br />
implemented measures to turn around its Building Systems<br />
business targeting cost improvements of EUR 40 million by the<br />
end of 2012, compared with 2010. further production efficiency<br />
and cost reduction initiatives have been implemented<br />
across the company’s downstream operations.<br />
Underlying operating performance<br />
Underlying EBIT increased to NOK 6,133 million compared<br />
with NOK 3,351 in 2010. Higher realized alumina and aluminium<br />
prices and higher production volumes mainly due to<br />
the vale acquisition had a positive effect on developments for<br />
the year. <strong>Hydro</strong>’s new Bauxite & Alumina business achieved significant<br />
improvements in operational stability and capacity utilization<br />
during 2011. Paragominas, one of the world’s largest<br />
bauxite mines, achieved record production in 2011. However,<br />
underlying results for the new business area were not satisfactory<br />
for the full year.<br />
Cost and other improvements in Primary Metal amounted to<br />
roughly NOK 1 billion compared to 2009 operating cost levels.<br />
This was more than offset, however, by higher prices for key raw<br />
materials including power, carbon and alumina. Qatalum<br />
reached full capacity in the third quarter of 2011 following a<br />
significantly delayed ramp-up due to a power outage in 2010.<br />
Underlying results for <strong>Hydro</strong>’s downstream operations were<br />
impacted by weaker markets, in particular for its European<br />
extrusion and building systems operations. Underlying EBIT<br />
for <strong>Hydro</strong>’s Energy business increased in 2011, mainly due to<br />
higher production.<br />
Due to the vale Aluminium acquisition and Qatalum coming<br />
into full production, <strong>Hydro</strong>’s total greenhouse gas emissions<br />
increased significantly in 2011. However, emissions from the<br />
company’s smelters – per mt aluminium produced – are steadily<br />
decreasing, and <strong>Hydro</strong>’s greenhouse gas emissions declined by<br />
five percent compared to 2010 including the new assets in Brazil<br />
on a comparative basis. 1) <strong>Hydro</strong> did not achieve its safety target<br />
in 2011 and suffered three fatal accidents including two contractors<br />
and one employee.<br />
Priorities for 2012<br />
Building on its strong position in a world with limited resources,<br />
<strong>Hydro</strong> will be proactive in securing the performance of the company’s<br />
existing business and exploiting new opportunities<br />
including to:<br />
• Achieve industry leadership in safety performance and<br />
renew emphasis on corporate responsibility<br />
• Respond to market developments to secure operating results<br />
• Continuously improve the operations and cost position of<br />
bauxite mining and alumina refining<br />
• Further improve the cost position of the smelter portfolio
• Secure stable production and first-quartile cost position of<br />
Qatalum and optimize the commercial value of full<br />
production volumes<br />
• Improve returns for downstream operations<br />
• Maintain capital discipline<br />
<strong>Hydro</strong> will take the steps necessary to secure its operating results<br />
and sound financial position in 2012 and safe operations continues<br />
to be of paramount importance. Zero tolerance for fatal<br />
accidents continues, and <strong>Hydro</strong> is aiming for a 25 percent<br />
reduction in total recordable injuries per million hours worked<br />
or a TRI rate of 2.9 for 2012. following the significant business<br />
expansion in 2011, <strong>Hydro</strong> has revised several important corporate<br />
responsibility strategies that will be on the top of the board’s<br />
agenda for implementation in 2012. These include reducing the<br />
company’s environmental footprint, helping customers reduce<br />
their footprint and improving the environmental qualities of<br />
aluminium as a material. <strong>Hydro</strong>’s overall CSR strategy is built<br />
upon four pillars: integrity and anti-corruption, community<br />
and stakeholder engagement, human rights, and supply chain<br />
and product stewardship. five priorities for <strong>Hydro</strong>’s people<br />
strategy include: performance culture, competence management,<br />
leadership pipeline, diversity and mobility.<br />
further improving the capacity utilization and efficiency of the<br />
company’s new Bauxite & Alumina operations will be a key priority<br />
in 2012. <strong>Hydro</strong> will concentrate on increasing the effectiveness<br />
of its production systems, raising productivity and<br />
pursuing a more systematic execution and follow-up of maintenance<br />
activities. <strong>Hydro</strong>’s aim is to achieve targeted increases in<br />
production levels and to significantly enhance the performance<br />
within these core activities.<br />
<strong>Hydro</strong> will continue to emphasize improving the efficiency of its<br />
smelter portfolio while constantly addressing the cost challenges<br />
facing its Primary Metal business. <strong>Hydro</strong>’s USD 300 per mt cost<br />
improvement program is on track, delivering cumulative saving<br />
of USD 200 per mt by the end of 2011.<br />
Improving returns for <strong>Hydro</strong>’s downstream operations will be<br />
an important issue on the company’s agenda in 2012. Key strategies<br />
include differentiation through innovation and service as<br />
well as continuous cost reduction to secure margins while protecting<br />
market shares. <strong>Hydro</strong> plans to build upon its European<br />
extrusion operations and its world-class rolling mills, focusing<br />
on the high-end product markets. Strong cost control will be a<br />
key objective in general and the company will continue efforts<br />
to turn around activities in southern Europe, working towards a<br />
leaner organization, and securing significant and lasting reductions<br />
in operating costs.<br />
<strong>Hydro</strong> aims to provide its shareholders competitive returns<br />
compared to alternative investments in peer companies, and is<br />
maintaining its dividend policy of paying 30 percent of net<br />
income in ordinary dividends over the business cycle. The com-<br />
BoArD oF DIreCtors’ report<br />
Investor information<br />
11<br />
pany will continue to focus on securing its financial position<br />
through exercising capital discipline to secure an optimal level of<br />
operating capital, and to maintain a sustainable level of capital<br />
expenditures safeguarding the company’s operating portfolio.<br />
Strong cash generation and preserving <strong>Hydro</strong>’s investment grade<br />
credit rating will be key priorities.<br />
Shaping the future<br />
<strong>Hydro</strong> is well prepared for the opportunities ahead in an industry<br />
with attractive long-term fundamentals. However, the current<br />
economic environment represents a significant challenge in<br />
obtaining a satisfactory return on capital for the industry as a<br />
whole and for <strong>Hydro</strong>. In order to secure the viability of its operations<br />
over time, <strong>Hydro</strong> intends to focus on initiatives and business<br />
opportunities that continually improve its cost position.<br />
<strong>Hydro</strong>’s long alumina equity position places it in a market where<br />
we can benefit from mechanisms that will evolve the price of the<br />
company’s core products to better reflect the cost fundamentals<br />
of the industry. <strong>Hydro</strong>’s long-term ambition is to increase its<br />
capacity of low-cost alumina, reinforcing its position as a leading<br />
global supplier. Potential projects include CAP, an alumina<br />
refinery in Barcarena, close to Alunorte, and the possible expansion<br />
of the Paragominas mine.<br />
The Qatalum smelter has been developed with the possibility to<br />
more than double the plant’s annual capacity in the future.<br />
There is also a possibility to expand the low-cost Alouette smelter<br />
in Canada. <strong>Hydro</strong> intends to maintain its technological leadership<br />
which contributes to lower operating costs, reduced emissions<br />
and ensures attractiveness as a partner for world-class<br />
projects. Selective growth of the company’s downstream operations<br />
in emerging markets including Brazil and China will be a<br />
priority going forward.<br />
<strong>Hydro</strong> intends to develop the value of its Norwegian energy<br />
assets and to use <strong>Hydro</strong>’s competence to secure competitive<br />
energy sources for its global activities. <strong>Hydro</strong> is committed to<br />
maintaining the viability of the company’s global smelter portfolio,<br />
which is heavily dependent on securing adequate supplies<br />
of competitively priced energy. Securing long-term, competitive<br />
power sources is of critical importance to sustaining the viability<br />
of <strong>Hydro</strong>’s smelter portfolio in Norway. Identifying opportunities<br />
for long-term, competitive energy sources to protect and<br />
develop the company’s portfolio, taking into consideration<br />
license reversion in Norway and emission legislation in general,<br />
continues to be an important priority for <strong>Hydro</strong>.<br />
Investor information<br />
<strong>Hydro</strong>’s share price closed at NOK 27.74 at the end of 2011.<br />
The return for 2011 was negative, amounting to NOK 14.87<br />
per share, or 35 percent.<br />
<strong>Hydro</strong>’s board of directors proposes to pay a dividend of NOK<br />
0.75 per share for 2011 reflecting the company’s strong com-
12<br />
BoArD oF DIreCtors’ report<br />
Financial and underlying operating results<br />
Share price development in 2011<br />
NOK<br />
55<br />
50<br />
45<br />
40<br />
35<br />
30<br />
25<br />
20<br />
Jan. Feb. Mar. Apr. May Jun. Jul. Aug. Sept. Oct. Nov. Dec.<br />
<strong>Hydro</strong><br />
Oslo Børs Benchmark Index<br />
S&P 500 Index<br />
mitment to provide a cash return to its shareholders. The dividend<br />
reflects our operational performance for 2011 and a<br />
strong financial position, and takes into consideration the<br />
uncertain market outlook.<br />
financial and underlying operating results<br />
Financial results for 2011<br />
EBIT for <strong>Hydro</strong> amounted to NOK 9,827 million compared<br />
with NOK 3,184 million in 2010. EBIT included negative<br />
effects of NOK 211 million from unrealized gains and losses<br />
relating to LME, power, currency and raw material derivative<br />
contracts, and metal effects in our Rolled Products business area.<br />
In 2010, the corresponding effects amounted to a negative<br />
NOK 166 million. The magnitude of these recurring effects<br />
depends on changes in market values, which have been<br />
significant.<br />
Other significant items impacting EBIT include gains and losses<br />
and other costs and charges that are typically nonrecurring for<br />
individual plants or operations. These included rationalization<br />
and impairment charges amounting to NOK 1,607 million and<br />
NOK 317 million for 2011 and 2010, respectively, together<br />
with divestment gains of NOK 1,184 million in 2011 and<br />
NOK 74 million in 2010. These also included effects relating to<br />
the vale Aluminium acquisition amounting to NOK 4,328 million<br />
in 2011 and other items amounting to a net positive effect<br />
of NOK 242 million in 2010.<br />
Net financial expense for the year amounted to NOK 1,288<br />
million compared with net financial income of NOK 522 million<br />
in 2010. These amounts included net foreign currency<br />
losses of NOK 971 million in 2011 and net foreign currency<br />
gains of NOK 513 million for 2010. The currency gains in 2010<br />
related primarily to intercompany balances denominated in<br />
Euro. The gains have no cash effect and are offset in equity by<br />
translation of the corresponding subsidiaries during consolidation.<br />
Corresponding net currency gains in 2011 amounted to<br />
NOK 27 million.<br />
Income taxes amounted to a charge of NOK 1,790 million in<br />
2011, compared with a charge of NOK 1,588 million in 2010.<br />
for 2011, income tax expense was 21 percent of pre-tax income.<br />
The low tax rate results from tax-free gains on the sales of the<br />
shareholding in SKS Produksjon and Alpart, and the tax-free<br />
gain from the revaluation of <strong>Hydro</strong>’s previous ownership interests<br />
in Alunorte, and CAP recognized in the first quarter. The<br />
effect was somewhat offset by impairment charges having no tax<br />
effect and the write down of deferred tax assets recognized in the<br />
fourth quarter.<br />
Net income amounted to NOK 6,749 million in 2011, compared<br />
with NOK 2,188 million in 2010.<br />
Underlying operating results<br />
To provide a better understanding of <strong>Hydro</strong>’s underlying performance,<br />
the following discussion of operating performance<br />
excludes certain items from EBIT (earnings before financial<br />
items and tax) and net income, such as unrealized gains and<br />
losses on derivatives, impairment and rationalization charges,<br />
effects of disposals of businesses and operating assets, as well as<br />
other items that are of a special nature or are not expected to<br />
be incurred on an ongoing basis.<br />
Underlying EBIT improved for Bauxite & Alumina mainly<br />
due to the inclusion of the acquired bauxite and alumina activities<br />
from vale from March 1, 2011. Pro forma underlying<br />
EBIT for Bauxite & Alumina 1) declined to NOK 969 million<br />
in 2011 from NOK 1,225 million in 2010 which included<br />
insurance proceeds from the settlement of a claim for business<br />
interruption. Bauxite production improved throughout the<br />
year. Alumina production at Alunorte increased slightly. Realized<br />
alumina prices improved compared to 2010 driven by<br />
higher LME prices, but positive effects were mostly offset by<br />
increased raw material costs.<br />
Underlying EBIT for Primary Metal improved significantly in<br />
2011 driven by higher realized aluminium prices, higher volumes<br />
and improved earnings for Qatalum following completion<br />
of ramp-up of the plant. Positive developments were<br />
partly offset by substantially higher raw material costs. Inclusion<br />
of the Albras smelter from March 1, 2011 also had a positive<br />
effect on underlying EBIT. Excluding Albras, higher<br />
realized aluminium prices together with higher premiums<br />
contributed about NOK 2.5 billion to underlying EBIT compared<br />
with 2010. LME linked alumina costs increased together<br />
with higher costs for carbon and power. fixed costs for our<br />
1) To provide a presentation of <strong>Hydro</strong>’s performance on a comparable basis, this additional information relating to developments in underlying EBIT for Bauxite &<br />
Alumina is presented including the results of the acquired Vale assets for the full calendar quarter when the acquisition was completed in 2011 and for 2010.<br />
See note 5 to the consolidated financial statements later in this report for more information on the acquisition.
Key financial information<br />
NOK million, except per share data<br />
BoArD oF DIreCtors’ report<br />
Financial and underlying operating results<br />
Revenue 91 444 75 754<br />
Earnings before financial items and tax (EBIT) 9 827 3 184<br />
Items excluded from underlying EBIT 1) (3 694) 167<br />
Underlying EBIT 6 133 3 351<br />
Underlying EBIT :<br />
Bauxite & Alumina 887 633<br />
Primary Metal 2 486 617<br />
Metal Markets 441 321<br />
Rolled Products 673 864<br />
Extruded Products 151 444<br />
Energy 1 883 1 416<br />
Other and eliminations (389) (945)<br />
Underlying EBIT 6 133 3 351<br />
Underlying EBITDA 11 152 6 420<br />
Net income (loss) 6 749 2 118<br />
Underlying net income (loss) 3 947 1 852<br />
Earnings per share 2) 3.41 1.33<br />
Underlying earnings per share 2) 1.89 1.14<br />
Financial data:<br />
Investments 48 025 6 231<br />
Adjusted net interest-bearing debt 3) (19 895) (6 427)<br />
Key Operational information 4)<br />
1) See section Items excluded from underlying EBIT and net income in <strong>Hydro</strong>’s <strong>Annual</strong> <strong>Report</strong> – 2011 for more information on these items.<br />
2) Earnings per share and Underlying earnings per share are computed using net income and underlying net income attributable to <strong>Hydro</strong> shareholders, and using<br />
the weighted average number of ordinary shares outstanding, adjusted for the discount element in the rights issue completed in July 2010. There were no<br />
significant diluting elements.<br />
3) Calculation is based on amounts as of the end of the periods presented. See note 35, Capital Management in <strong>Hydro</strong>’s consolidated financial statements for a<br />
discussion on net interest-bearing debt definitions.<br />
4) Operating statistics include proportionate share of production and prices in equity accounted investments.<br />
5) Including the effect of strategic LME hedges (hedge accounting applied).<br />
6) Excluding ingot trading volumes.<br />
Year<br />
2011<br />
Year<br />
2011<br />
Year<br />
2010<br />
13<br />
Year<br />
2010<br />
% change<br />
prior year<br />
Alumina production (kmt) 5 264 1 976 >100 %<br />
Primary aluminium production (kmt) 1 982 1 415 40 %<br />
Realized aluminium price LME (USD/mt) 5) 2 480 2 113 17 %<br />
Realized aluminium price LME (NOK/mt) 5) 13 884 12 674 10 %<br />
Realized NOK/USD exchange rate 5.60 6.00 (7) %<br />
Metal Markets sales volumes to external market (kmt) 6) 2 091 1 717 22 %<br />
Rolled Products sales volumes to external market (kmt) 929 945 (2) %<br />
Extruded Products sales volumes to external market (kmt) 536 529 1 %<br />
Power production (GWh) 9 582 8 144 18 %
14<br />
BoArD oF DIreCtors’ report<br />
Outlook<br />
smelter portfolio excluding Albras declined somewhat. Underlying<br />
EBIT improved in 2011 for Qatalum, which reached full<br />
production on September 21. Insurance proceeds relating to<br />
the power outage in August 2010 which were included in<br />
underlying results for 2011 amounted to NOK 145 million.<br />
Proceeds amounted to NOK 300 million in 2010, of which<br />
NOK 210 million was included in underlying EBIT.<br />
Developments in underlying EBIT for Metal Markets in 2011<br />
were heavily influenced by net positive currency and inventory<br />
valuation effects compared with significant net negative effects<br />
for 2010. Underlying EBIT excluding these items declined,<br />
impacted by a lower contribution from our sourcing and trading<br />
activities. Results for our remelt operations improved<br />
somewhat for the year. Total metal product sales improved<br />
compared with 2010, mainly due to the inclusion of Albras<br />
casthouse volumes from March 1, 2011 and increased volumes<br />
from Qatalum. The positive effects were partly offset by lower<br />
extrusion ingot and sheet ingot sales volumes in Europe due to<br />
weaker markets.<br />
Underlying EBIT for Rolled Products declined in 2011 compared<br />
to the record results achieved in the previous year,<br />
mainly due to lower sales volumes and somewhat higher operating<br />
costs. volumes declined somewhat in total, reflecting<br />
weaker markets in the second half of 2011. Margins improved<br />
in the first half of 2011 but were under pressure during the<br />
second half, mainly related to the general engineering applications.<br />
Operating costs increased, driven by higher energy<br />
prices and other production related costs.<br />
Underlying EBIT for Extruded Products declined substantially<br />
in 2011, mainly as a result of lower volumes for our<br />
higher margin building systems operations and lower margins<br />
for our European general extrusion operations. Cost reduction<br />
initiatives resulted in lower operating costs, partly offsetting<br />
the negative market developments. Our Americas extrusion<br />
operations and global precision tubing business delivered<br />
improved underlying results for the year. Overall volumes<br />
increased compared to the previous year as markets improved<br />
during the first half of 2011. However, demand weakened in<br />
the second half of the year due to growing economic uncertainty,<br />
impacting our European extrusion business in particular.<br />
Weak demand and increasing overcapacity in Southern<br />
Europe has resulted in significant pressure on margins in<br />
Europe. Measures implemented across our European general<br />
extrusion operations have reduced our operating cost per mt,<br />
partly offsetting margin declines.<br />
Underlying EBIT for Energy increased in 2011, mainly due to<br />
higher production and lower area price differences, partly off-<br />
set by lower prices. In addition, strong results from commercial<br />
activities contributed positively to underlying EBIT for<br />
2011. Direct production costs declined in 2011 due to lower<br />
transmission costs.<br />
Liquidity, financial position, investments<br />
Cash and short-term investments exceeded interest-bearing<br />
debt by roughly NOK 1.7 billion at the end of 2011, down<br />
from NOK 11 billion at the end of 2010. The decline was<br />
mainly due to a net payment of NOK 5.8 billion and debt<br />
assumed of NOK 5.7 billion, both related to the vale Aluminium<br />
acquisition.<br />
<strong>Hydro</strong>’s adjusted debt/equity ratio, defined as net interestbearing<br />
debt divided by adjusted equity, was 0.24 at the end of<br />
the year, well below its targeted maximum ratio of 0.55. 1)<br />
In 2011, cash provided by operating activities of NOK 7.3<br />
billion was more than sufficient to cover operating requirements<br />
and investments of NOK 4.3 billion 2) , as well as dividend<br />
payments of NOK 1.8 billion. Sales of non-strategic<br />
assets amounted to NOK 1.4 billion, representing an additional<br />
source of cash, in addition to net loan proceeds of NOK<br />
0.9 billion. In addition to operating and investment activities,<br />
the main use of cash was the net payment of NOK 5.8 billion<br />
made in connection with the vale Aluminium acquisition.<br />
Except for the vale transaction, investments in 2011 were<br />
mainly limited to maintenance activities to safeguard our production<br />
assets.<br />
Available credit facilities and the commercial paper market<br />
were used to cover fluctuations in cash flow during the year.<br />
Net cash outflow amounted to NOK 2.4 billion for the year,<br />
decreasing cash, cash equivalents and bank overdraft from<br />
NOK 10.7 billion at the end of 2010 to NOK 8.3 billion at<br />
the end of 2011.<br />
<strong>Hydro</strong>’s adjusted funds from operation/adjusted net interestbearing<br />
debt ratio was 0.42 for 2011, which was above our<br />
minimum target of 0.40.<br />
<strong>Hydro</strong> expects that cash from continuing operations, together<br />
with its liquidity holdings and available credit facilities, will be<br />
more than sufficient to cover our planned capital expenditures,<br />
operational requirements, and financing activities in 2012.<br />
Outlook<br />
Demand for most metal products (extrusion ingot, sheet ingot,<br />
foundry alloys and wire rod) in Europe weakened during the<br />
year. North American demand was stronger in general. Demand<br />
1) The adjustments are mainly comprised of net unfunded pension obligations after tax, the present value of operating lease obligations and <strong>Hydro</strong>’s portion of<br />
interest bearing debt in equity accounted investees.<br />
2) Excluding amounts relating to the Vale Aluminium acquisition.
for foundry alloys continued to be strong in Northern Europe<br />
and in Germany in particular, and also improved in Asia. <strong>Annual</strong>ized<br />
production of primary aluminium was relatively stable in<br />
the final quarter of 2011 amounting to 26.6 million mt globally<br />
(excluding China). Corresponding annualized consumption<br />
declined, however, to 24.7 million mt. Recent announcements<br />
of smelter closures and limited new capacity coming on stream<br />
are expected to improve the supply demand balance in 2012.<br />
Demand for primary aluminium is expected to grow by about<br />
3-5 percent in 2012. However, market sentiment continues to<br />
be influenced by significant economic uncertainty.<br />
European demand for downstream products was somewhat<br />
higher compared to 2010 as most markets continued to<br />
recover in the first half of 2011. However, demand weakened<br />
in the second half of 2011 due to increasing economic uncertainty<br />
in Europe and in Southern Europe in particular. Economic<br />
and market developments for 2012 are uncertain with<br />
low visibility. However, certain leading indicators are positive<br />
for rolled products. European demand for extruded aluminium<br />
products is expected to decline in 2012 with the building<br />
and construction market continuing to be the weakest end use<br />
market segment. Outside of Europe, the market outlook is<br />
positive, and within the automotive and transport segments in<br />
particular.<br />
Power production in Norway amounted to 127 TWh, which<br />
is 3 TWh higher than 2010. <strong>Hydro</strong>’s water reservoirs were well<br />
above normal at the end of 2011 and snow reservoirs increased<br />
significantly. As a result, production is expected to be high<br />
through the first quarter of 2012.<br />
Risk<br />
Risk management in <strong>Hydro</strong> is based on the principle that<br />
risk evaluation is an integral part of all business activities.<br />
Consequently, the business areas have the main responsibility<br />
for risk management, utilizing established policies and<br />
procedures. Their work is coordinated by staff units at the<br />
corporate level. The board of directors regularly reviews and<br />
evaluates the overall risk management system and environment<br />
within <strong>Hydro</strong>.<br />
<strong>Hydro</strong> faces risks and uncertainties within its worldwide<br />
business operations and in the global marketplace. The company<br />
is exposed to changing economic and market conditions<br />
and there has been a substantial increase in uncertainty<br />
regarding economic developments within the countries and<br />
geographic regions in which <strong>Hydro</strong> operates. The majority of<br />
<strong>Hydro</strong>’s primary aluminium plants are located in countries<br />
experiencing strong currencies and/or inflationary pressures,<br />
which weaken the competitive position of some of our operations.<br />
Compensating for future market declines is dependent<br />
on the company’s ability to sufficiently reduce our operating<br />
costs. The vale Aluminium acquisition represents a significant<br />
portion of <strong>Hydro</strong>’s capital employed and the company<br />
BoArD oF DIreCtors’ report<br />
Risk<br />
15<br />
may not realize the benefits expected. A deterioration of<br />
<strong>Hydro</strong>’s financial position or downgrade of the company’s<br />
credit rating could increase its borrowing cost and cost of<br />
capital. <strong>Hydro</strong> faces an ongoing risk of counterparty default.<br />
Price volatility can have a significant impact on <strong>Hydro</strong>’s<br />
reported results. <strong>Hydro</strong>’s reported and operating results and<br />
competitive position are influenced by developments in currency-exchange<br />
rates and in particular the U.S. dollar, Brazilian<br />
Real, Euro and Norwegian krone. <strong>Hydro</strong> is exposed to<br />
changing legislation on reducing CO 2 emissions. Major accidents,<br />
legal proceedings or investigations and incidents relating<br />
to HSE and corporate responsibility could impose<br />
significant costs and substantially damage the company’s<br />
reputation.<br />
<strong>Hydro</strong>’s main strategy for mitigating risk related to volatility<br />
in cash flows is to maintain a solid financial position and<br />
strong creditworthiness. In order to protect processing and<br />
manufacturing margins against raw material price fluctuations,<br />
<strong>Hydro</strong>’s downstream and other margin-based operations<br />
are hedged to a certain extent. <strong>Hydro</strong> also uses<br />
derivatives to reduce its overall financial and commercial risk<br />
exposures. forward U.S. dollar currency contracts have been<br />
used and <strong>Hydro</strong> has, to a limited extent, entered into forward<br />
contracts in other currencies to hedge certain revenue<br />
and cost positions. No major currency-forward contracts<br />
were outstanding at the end of 2011.<br />
Controls and procedures<br />
<strong>Hydro</strong> follows the Norwegian Code of Practice for Corporate<br />
Governance of October 2010. A detailed description of<br />
<strong>Hydro</strong>’s compliance with this code is presented on page 132.<br />
Information regarding the company’s shareholder policy can<br />
be found on page 115.<br />
The board’s audit committee carries out a control function and<br />
arranges for the board to deal with the company’s financial<br />
reporting.<br />
Research and development<br />
In 2011, research and development costs recognized as an<br />
expense amounted to NOK 508 million compared to NOK<br />
543 million in 2010.<br />
The greater part of our R&D expenses goes to our in-house<br />
research organization, while the remainder supports work carried<br />
out at external institutions. See Note 14. Our main R&D<br />
centers are in Årdal (primary aluminium technology) and<br />
Sunndal (alloys and casting) in Norway, Bonn in Germany<br />
(rolled products) and Toulouse in france (building systems).<br />
We reviewed our R&D organization in 2011. Starting in<br />
2012, all business areas will be responsible for their own technology<br />
development and execution of their respective technology<br />
strategies. As part of the new organizational model, a
16<br />
BoArD oF DIreCtors’ report<br />
Work environment<br />
Corporate Technology Office has been established to ensure a<br />
holistic and long-term approach to <strong>Hydro</strong>’s technology strategy<br />
and agenda.<br />
Within Bauxite & Alumina, we cooperate across the industry<br />
and with external research institutes to further develop parts of<br />
the production processes and to gain information about different<br />
alumina qualities. We are working together with suppliers<br />
on process development at our alumina refinery Alunorte.<br />
<strong>Hydro</strong>’s proprietary electrolytic process is one of the most efficient<br />
in the world. The primary aluminium plants in Sunndal<br />
in Norway and Qatalum in Qatar are using the newest technology.<br />
Our next generation technology, HAL4e, is ready for<br />
use the next time we build a primary aluminium plant. R&D<br />
in Primary Metal is also key in strengthening competitiveness<br />
by helping improve the cost position at our primary plants.<br />
Prioritized tasks are operational support, implementation of<br />
new technology in existing activities as well as development of<br />
next-generation electrolysis technology.<br />
We work closely with customers to develop products that save<br />
energy and reduce emissions. Aluminium façades can lower<br />
operating costs and help buildings produce as much energy as<br />
they consume during operation. The energy neutrality is<br />
achieved by using heat pumps, integrated photovoltaic systems<br />
and intelligent building design. In 2011, we entered into the<br />
partnership Powerhouse, which is aiming to construct an<br />
energy-neutral commercial building as far north as Trondheim<br />
in Norway.<br />
Work environment<br />
We work continuously to avoid work-related illnesses and<br />
injuries, and track the development through a corporate<br />
reporting tool. Guidelines for assessing risks in the work environment<br />
are used by the business areas to help map and evaluate<br />
<strong>Hydro</strong>’s work environment.<br />
Fatal accidents<br />
Per 100 million hours worked, five-year rolling average<br />
7<br />
6<br />
5<br />
4<br />
3<br />
2<br />
1<br />
0<br />
03/07<br />
04/08<br />
05/09<br />
06/10<br />
<strong>Hydro</strong> employees Contractor employees Total<br />
07/11<br />
Registered sick leave in <strong>Hydro</strong> was 3.1 percent in 2011, down<br />
from 3.3 percent in 2010. The rules for sick-leave registration<br />
differ from country to country. <strong>Hydro</strong>’s sick leave in Norway is<br />
significantly higher than in the rest of the company, on average,<br />
but relatively low compared to the average rate in Norwegian<br />
industry. Sick leave in Norway was 4.4 percent in 2011,<br />
the same as in the previous year. Men’s sick leave was 4.1 percent,<br />
slightly below the 2010 level of 4.2 percent, while women’s<br />
sick leave increased from 5.5 percent in 2010 to 5.7<br />
percent in 2011. Starting in 2012, we will be introducing a<br />
new sick-leave indicator that will be comparable across country<br />
borders.<br />
Our TRI rate (total recordable injuries per million hours<br />
worked) was 3.8 in 2011, which was an increase of 2 percent<br />
compared to the previous year. Our target was a 28 percent<br />
decrease. We had three fatal accidents in our consolidated<br />
operations, and an accident with two fatalities in one of our<br />
minority-owned activities. Even though our safety results are<br />
among the best in industry, we are far from satisfied. In 2012<br />
we are aiming at a 25 percent reduction in the TRI rate to 2.85<br />
with no fatal accidents.<br />
We have initiated several measures to improve performance.<br />
These include a common, company-wide high-risk incident<br />
investigation and communication tool, which will be implemented<br />
in 2012, and we have defined man/machine interface,<br />
traffic and contractors as priorities for 2011 and 2012, and we<br />
are updating our safety risk-assessment handbook.<br />
Environment<br />
We have for several decades monitored our impact on the<br />
environment as part of a holistic approach to value creation.<br />
Our climate strategy is an integral part of our overall business<br />
strategy, including reducing the environmental impact of our<br />
production activities as well as taking advantage of business<br />
opportunities by enabling our customers to do the same. Some<br />
of the measures we pursue include:<br />
Total recordable injuries<br />
Per million hours worked<br />
5<br />
4<br />
3<br />
2<br />
1<br />
0<br />
2007<br />
<strong>Hydro</strong> employees<br />
2008<br />
2009<br />
2010<br />
2011
• Using viable energy sources<br />
• Reducing energy consumption and emissions in production<br />
• Reducing CO 2 emissions through the use of our products<br />
• Increasing the recycling of aluminium<br />
<strong>Hydro</strong>’s greenhouse gas emissions from our current consolidated<br />
activities decreased by 5 percent in 2011 compared with 2010.<br />
following Qatalum coming into full production, total emissions<br />
from our ownership equity, including emissions from electricity<br />
generation, increased by 10 percent. Due to our new assets in<br />
Brazil, our direct greenhouse-gas emissions from consolidated<br />
activities increased by 4.5 million metric tons (mt) compared to<br />
the figures reported in <strong>Hydro</strong>’s board report in 2010.<br />
In 2009, we revised our goal to a specific direct emission from<br />
primary production of 1.52 mt CO2e per mt aluminium in<br />
2013. With performance of 1.61 mt CO2e per mt aluminium<br />
last year, we are approaching this target.<br />
Our ambition is to grow faster than the market in recycling and<br />
to take a strong position in this part of the value chain. By 2020,<br />
we aim to recover 1 million metric tons (mt) of contaminated<br />
and post-consumer scrap annually. We have improved utilization<br />
of our existing capacity to almost 100 percent during the<br />
last two years, and are now recycling more than 270,000 mt<br />
annually. Due to curtailments in remelting and recycling capacity,<br />
growth was only about 3 percent compared to 2010. In<br />
total, <strong>Hydro</strong> is remelting and recycling more than 2 million mt<br />
of aluminium. Our goal for 2012 is to stabilize at above 90 percent<br />
capacity utilization and to develop specific post-consumed<br />
scrap projects for investment in additional capacity. This will<br />
also improve <strong>Hydro</strong>’s carbon footprint.<br />
In addition to our existing climate strategy and recycling strategy,<br />
we decided in 2011 to concentrate on four areas going<br />
forward:<br />
• Ecosystems and biodiversity<br />
• Product stewardship<br />
• Waste and efficient resource use<br />
• Emissions<br />
When bauxite extraction is finished in an area, rehabilitation<br />
starts. <strong>Hydro</strong>’s Paragominas mine started production in 2006 and<br />
the reforestation program started in 2009. We have identified<br />
improvement potentials with regards to reforestation and wildlife<br />
management at Paragominas, and are evaluating possible adjustments.<br />
In total 853 hectares of land was disturbed during 2011<br />
and about 4,700 hectares since the mining operations started. In<br />
2011 we rehabilitated 142 hectares, while approximately 400 hectares<br />
have been rehabilitated in total since the operations started.<br />
Enough and clean water is a challenge in some of the areas<br />
where <strong>Hydro</strong> operates. Local initiatives show that with simple<br />
measures, substantial water savings are achievable. Systematic<br />
mapping of our water situation in 2011 showed that in total,<br />
BoArD oF DIreCtors’ report<br />
Environment<br />
Direct greenhouse gas emissions from <strong>Hydro</strong>’s<br />
consolidated activities<br />
Million metric tons CO2e<br />
10<br />
8<br />
6<br />
4<br />
2<br />
0<br />
CO2<br />
2007<br />
PFC<br />
2008<br />
2009<br />
Figures include historical emission from current operations.<br />
2010<br />
2011<br />
17<br />
about 3 percent of our water input came from water-stressed<br />
areas when regarding annual renewable water supply.<br />
Although the Amazon is recognized for having an abundance<br />
of water we have over the last decades observed that parts of<br />
the area have had repeated droughts. We will therefore carefully<br />
address water as an issue also for our sites in Brazil. Qatalum,<br />
where <strong>Hydro</strong> holds a 50-percent share, gets water from<br />
public water works which is produced by desalination. Sea<br />
water is used for wet cooling towers at the power plant.<br />
With the new assets in Brazil, <strong>Hydro</strong>’s waste production now<br />
includes significant amounts of tailings from bauxite extraction<br />
as well as bauxite residue, or red mud, from alumina refining.<br />
Waste amounts are directly linked to the amount of<br />
produced bauxite and alumina. Tailings consist of mineral<br />
rejects from the extraction process mixed with water. No<br />
chemicals are added. The tailings at the Paragominas bauxite<br />
mine in Brazil are stored in dedicated tailing ponds where the<br />
particles settle. Separated water is transferred to a clarification<br />
dam before being reused in the process. There is a minor runoff<br />
to the river downstream of the tailings, which is required to<br />
maintain an ecological flow. The run-off is monitored and the<br />
water quality satisfies the requirements set by the authorities.<br />
In 2011, <strong>Hydro</strong> produced 5.9 million mt of tailings.<br />
Bauxite residue is a by-product of the alumina refining process.<br />
Alunorte uses the Bayer process, which includes use of<br />
caustic soda. The lye is recovered and reused in the process as<br />
part of a closed-loop system to reduce production costs and<br />
lower the alkalinity of the residue. In 2011, <strong>Hydro</strong> produced<br />
6.4 million mt of bauxite residue.<br />
Spent potlining (SPL) from the electrolytic cells used in primary<br />
aluminium production is defined as hazardous waste. In<br />
2011, <strong>Hydro</strong> produced 24,804 mt of SPL, a 29 percent<br />
decrease from 2010. Production of SPL varies with the relin-
18<br />
BoArD oF DIreCtors’ report<br />
Emergency preparedness<br />
ing of smelter cells which is normally done every 4-7 years for<br />
established smelters. We expect an increase in the SPL production<br />
from consolidated smelters in a couple of years.<br />
Emergency preparedness<br />
We are responsible for infrastructure and functions which<br />
could be critical for community operations, locally and/or<br />
regionally, and we operate large-scale production sites where a<br />
catastrophe could influence the safety of the community. We<br />
are thereby subject to control and follow-up by national<br />
authorities. These high-risk issues are core to our emergency<br />
planning and we keep a high state of readiness through regular<br />
training and monitoring exercises. A central emergency team<br />
supports line management and ensures crisis handling in<br />
accordance with <strong>Hydro</strong>’s requirements and expectations.<br />
A threat and vulnerability assessment forms the basis for preventive<br />
measures in all business areas, including our new activities<br />
in Brazil.<br />
Integrity and human rights<br />
<strong>Hydro</strong>’s Integrity Program is our main means to prevent corruption<br />
and human rights violations. The program is based on<br />
<strong>Hydro</strong>’s code of conduct which is approved by the board of directors.<br />
The program includes risk mapping, tools and training.<br />
<strong>Hydro</strong> supports the principle of freedom of association and collective<br />
bargaining and has a long tradition in maintaining a<br />
good dialog with employee organizations. As an employer,<br />
owner and purchaser, our most important role related to human<br />
rights is to secure decent working conditions in our own organization,<br />
in minority-owned companies and with our suppliers. In<br />
countries where the right to form trade unions is restricted, we<br />
try to find alternative fora to uphold the right of employees to<br />
influence their work situation, like in Qatar and China.<br />
In 2011, <strong>Hydro</strong> reviewed its strategy for sponsorships and<br />
partnerships. To support the strategy and improve our overview,<br />
we initiated a reporting pilot which includes reporting<br />
requirements on outcomes for <strong>Hydro</strong> and the society. <strong>Hydro</strong><br />
spent in 2011 more than NOK 61 million on community<br />
investments, charitable donations and sponsorships of which<br />
more than half was related to social investments.<br />
Total payments (taxes, fees, etc.) to host governments 1)<br />
<strong>Hydro</strong>’s supplier requirements related to corporate responsibility<br />
are an integral part of all stages of the procurement process.<br />
The requirements cover issues related to environment, human<br />
rights, anti-corruption and working conditions, including<br />
work environment. Implementation is risk-based and takes<br />
into consideration contractual value, country risk, etc. The<br />
principles include auditing rights and the contractors’ responsibility<br />
toward subcontractors and their suppliers.<br />
Our most important voluntary commitments are the support of<br />
the principles set out in the Universal Declaration of Human<br />
Rights and the UN Global Compact. We also support the<br />
OECD’s Guidelines for Multinational Enterprises and report<br />
voluntarily on payments to host governments, in connection<br />
with exploration and production of bauxite and alumina, based<br />
on the principles in the Extractive Industries Transparency Initiative.<br />
In 2011, we became a member of the International<br />
Council on Mining and Metals (ICMM) and are committed to<br />
following the ICMM’s 10 Principles. We use the Global <strong>Report</strong>ing<br />
Initiative (GRI) G3 Guidelines for voluntary reporting of<br />
sustainable development. See www.hydro.com/gri<br />
Employees<br />
<strong>Hydro</strong> had 22,655 permanent employees at the end of 2011,<br />
an increase from 18,894 in 2010. In addition, we had 1,368<br />
temporary employees as well as contractor employees representing<br />
about 8,900 full-time equivalents during 2011. The<br />
increase in employees last year was mainly due to the acquisition<br />
of vale’s former aluminium business, while restructuring<br />
measures elsewhere in the company, especially within <strong>Hydro</strong><br />
Building Systems, had an opposite effect on the overall level.<br />
We now have the highest number of employees in Brazil, followed<br />
by Germany, Norway and the U.S.<br />
<strong>Hydro</strong> reviewed its people strategy in 2011. The strategy’s five<br />
pillars are our performance culture, competence management,<br />
leadership pipeline, diversity, and mobility.<br />
We see the importance of maintaining our position as an attractive<br />
employer. New employees are offered essential training to<br />
better understand the organization and their work tasks and to<br />
gain the required competence within health, security, safety and<br />
environment. In 2011, we initiated a program to welcome our<br />
NOK million 2011 2010 2009 2008 2007<br />
Australia - - (0.7) 0.4 6<br />
Brazil 48 98 160 139 89<br />
1) Total payments to host governments in connection with the exploration and production of bauxite and alumina. Payments include benefit streams, profit tax,<br />
royalty, license fees, rental fees, entry fees, etc. The reporting is based on the principles in the Extractive Industries Transparency Initiative (EITI). The table is<br />
included in auditor’s review of <strong>Hydro</strong>’s viability performance reporting 2010, but not in the financial audit. <strong>Hydro</strong> divested in 2011 its ownership share in Alpart,<br />
Jamaica.
Share of non-Norwegian leaders<br />
Percent<br />
50<br />
40<br />
30<br />
20<br />
10<br />
0<br />
2007<br />
Top 50 leaders<br />
2008<br />
Top 200 leaders<br />
2009<br />
2010<br />
2011<br />
new employees in Brazil, which included an introduction package<br />
about <strong>Hydro</strong> and the company’s ambitions and values. Our<br />
aim is that all the new employees in Brazil should take part in<br />
2012 in a program to learn about <strong>Hydro</strong>’s values, HSE and<br />
social responsibility principles, and value chain.<br />
We emphasize diversity with regard to nationality, culture, gender<br />
and educational background when recruiting and when<br />
forming management teams and other working groups. While<br />
84 percent of top management are Norwegian or German, only<br />
36 percent of <strong>Hydro</strong>’s employees are the same. Women are represented<br />
in all business area management teams, and most<br />
female executives hired in recent years have been recruited internally.<br />
We are aiming at further diversity at all levels and plan to<br />
launch a diversity awareness program globally in 2012.<br />
fourteen percent of <strong>Hydro</strong>’s employees globally are women,<br />
compared to 11 percent in Brazil and Germany, 18 percent in<br />
Norway and 19 percent in USA. Around 80 new employees<br />
were recruited to the Norwegian part of the organization in<br />
2011, compared to 100 in 2010. Of these, 19 percent were<br />
women in 2011, compared to 20 percent in 2010.<br />
We are continually adjusting working conditions so that all<br />
employees, regardless of disabilities or physical limitations,<br />
have the same opportunities.<br />
All employees shall be secured a total salary that is fair, competitive<br />
and in accordance with the local industry standard.<br />
Only relevant qualifications such as performance, education,<br />
experience and other professional criteria shall be taken into<br />
account when making appointments, or when providing training,<br />
settling remuneration and awarding promotion. There are<br />
no significant gender-pay differentials for employees earning<br />
collectively-negotiated wages in Norway. Salary conditions in<br />
the Norwegian business are reviewed on a regular basis. No<br />
BoArD oF DIreCtors’ report<br />
Board developments<br />
Share of women leaders<br />
Percent<br />
50<br />
40<br />
30<br />
20<br />
10<br />
0<br />
2007<br />
Top 50 leaders<br />
2008<br />
Top 200 leaders<br />
2009<br />
2010<br />
The total share of women at all levels in <strong>Hydro</strong> was 14 percent in 2011.<br />
2011<br />
19<br />
significant gender-related differences were found in 2011. If<br />
significant differences are found at any level, we have a tradition<br />
for closing the gaps within a short time.<br />
HSE, organization development and social responsibility are<br />
part of the bonus evaluation for the President and CEO and<br />
other members of the corporate management board. See Note<br />
10 and 11 for further information on executive<br />
compensation.<br />
The board of directors would like to acknowledge <strong>Hydro</strong>’s<br />
employees for their high spirit, significant adaptability and<br />
important achievements at operations across the world, and<br />
for strengthening <strong>Hydro</strong>’s competitiveness in a challenging<br />
market situation.<br />
Board developments<br />
The board of directors has an annual plan for its work. It includes<br />
recurring topics such as strategy review, business planning, risk<br />
and compliance oversight, financial reporting, people strategy,<br />
succession planning as well as HSE and CSR. The board has also<br />
used significant time on the completion of the vale transaction<br />
and integration follow up. This included a visit to Brazil and<br />
<strong>Hydro</strong>’s mining operations in Paragominas, the Alunorte refinery,<br />
the Albras smelter and <strong>Hydro</strong>’s regional headquarter in Rio de<br />
Janeiro. The visit included follow-up of the integration and operations<br />
of the businesses acquired from vale, and different social<br />
programs established in connection with these operations. The<br />
board of directors was also involved in evaluating market developments<br />
including continuous evaluation of curtailed capacity.<br />
In 2011, the board of directors also completed a self-assessment<br />
and a separate assessment of the board’s chairperson. Both were<br />
presented to the nomination committee. The evaluation processes<br />
were facilitated by an external service provider.
20<br />
BoArD oF DIreCtors’ report<br />
Net income and dividend – Norsk <strong>Hydro</strong> ASA<br />
The board of directors held 10 meetings in 2011 with an<br />
attendance of 92 percent. The compensation committee held<br />
seven meetings and the audit committee nine meetings.<br />
Tito Botelho Martins Jr. joined the board of directors on february<br />
28, 2011 as a 10th board member. On May 13, Ove<br />
Ellefsen was elected as board member. He replaced Jørn B.<br />
Lilleby as one of the Board’s three employee representatives.<br />
Net income and dividend<br />
- Norsk <strong>Hydro</strong> ASA<br />
Norsk <strong>Hydro</strong> ASA (the parent company) had net income of<br />
NOK 2,613 million in 2011 compared with a net income of<br />
NOK 1,712 million in 2010.<br />
Terje Vareberg<br />
Chair<br />
Finn Jebsen<br />
Board member<br />
Sten Roar Martinsen<br />
Board member<br />
Tito Martins<br />
Board member<br />
Oslo, March 20, 2012<br />
Bente Rathe<br />
Deputy chair<br />
Inge K. Hansen<br />
Board member<br />
Liv Monica Bargem Stubholt<br />
Board member<br />
<strong>Hydro</strong>’s board of directors proposes to pay a dividend of NOK<br />
0.75 per share for 2011 reflecting the company’s strong commitment<br />
to provide a cash return to its shareholders. The dividend<br />
reflects our operational performance for 2011 and a<br />
strong financial position, and takes into consideration the<br />
uncertain market outlook.<br />
Unrestricted equity after the proposed dividend payment<br />
amounted to NOK 28,013 million at the end of the year.<br />
According to Section 3-3 of the Norwegian Accounting Act,<br />
the board of directors confirms that the financial statements<br />
have been prepared on the assumption of a going concern.<br />
Billy Fredagsvik<br />
Board member<br />
Ove Ellefsen<br />
Board member<br />
Eva Persson<br />
Board member<br />
Svein Richard Brandtzæg<br />
President and CEO
Capital employed - – upstream focus<br />
December 31, 2011: 83 460 MNOK<br />
3%<br />
9%<br />
38%<br />
6% 3%<br />
41%<br />
6,133<br />
Underlying EBIT 2011<br />
Bauxite & Alumina<br />
Primary Metal<br />
Metal Markets<br />
Rolled Products<br />
Extruded Products<br />
Energy<br />
NOK MILLION<br />
BusIness DesCrIptIon<br />
Edit... Index<br />
21<br />
01:<br />
Business description<br />
Operating segments p.22<br />
History and development p.23<br />
Business and operating<br />
information p.24<br />
Regulation and taxation p.46<br />
Other information p.48<br />
QuICK overvIew<br />
<strong>Hydro</strong> is a fully integrated, leading worldwide supplier of alumina,<br />
primary aluminium, aluminium casthouse products and fabricated<br />
aluminium products.<br />
We have substantial interests in bauxite and alumina including one<br />
of the world’s largest bauxite mines and the world’s largest and<br />
one of the most cost efficient alumina refineries, both located in<br />
Brazil. We operate or are partners in modern, cost-efficient primary<br />
metal production facilities in Europe, Canada, Australia, Brazil and<br />
Qatar, and in flexible remelting plants in a range of countries in<br />
Europe, the U.S. and Asia.<br />
We are an industry leader for a range of downstream products and<br />
markets, in particular the building, packaging, lithographic and<br />
automotive sectors. We supply high-quality, value-added<br />
aluminium products and solutions, and have strong positions in<br />
markets that provide opportunities for good financial returns.<br />
With more than 100 years of experience in hydropower, <strong>Hydro</strong> is<br />
the second-largest power producer in Norway, and the largest<br />
privately owned producer.
22<br />
BusIness DesCrIptIon<br />
Operating segments<br />
operating segments<br />
<strong>Hydro</strong> is a fully integrated aluminium company with attractive<br />
positions in alumina and power, two of the most important<br />
raw materials in the production of primary metal. We are<br />
one of the world’s largest producers and suppliers of alumina<br />
and primary aluminium. Our captive power position, based<br />
on substantial self-generated hydroelectric capacity in Norway<br />
and a dedicated gas-fired plant at Qatalum gives us secure<br />
access to energy at competitive prices.<br />
Downstream, <strong>Hydro</strong> is an industry leader for a range of aluminium<br />
products and markets, in particular the building,<br />
packaging, lithographic and automotive sectors. Our ambition<br />
is to be recognized as the world’s foremost aluminium solutions<br />
supplier, working in partnership with our customers and<br />
driving our business forward.<br />
following the completion of the acquisition of vale aluminium,<br />
1) <strong>Hydro</strong>’s business is divided into six operating segments<br />
including Bauxite & Alumina, Primary Metal, Metal Markets,<br />
Rolled Products, Extruded Products and Energy:<br />
Aluminium upstream production facilities<br />
Bauxite/alumina<br />
Smelters<br />
Remelters<br />
• Bauxite and Alumina includes our bauxite mining activities<br />
comprised of our 60 percent ownership interest in the Paragominas<br />
mine and 5 percent interest in Mineracao Rio de<br />
Norte (MRN), both located in Brazil, as well as our 91 percent<br />
interest in the Brazilian alumina refinery, Alunorte.<br />
These activities also include <strong>Hydro</strong>’s long-term sourcing<br />
arrangements and alumina commercial operations, and its<br />
81 percent interest in the joint venture partnership Companhia<br />
de Alumina do Para (CAP), for a new alumina refinery<br />
close to Alunorte.<br />
• Primary Metal consists of our primary aluminium production,<br />
remelting and casting activities at our wholly-owned<br />
smelters located in Norway, Germany and Australia, and<br />
<strong>Hydro</strong>’s share of the primary production in partly-owned<br />
companies located in Norway, Slovakia, Qatar, Australia,<br />
Canada and Brazil.<br />
• Metal Markets includes all sales and distribution activities<br />
relating to products from our primary metal plants and<br />
operational responsibility for our stand-alone remelters,<br />
which are located in most major European markets, the<br />
United States and Taiwan. Metal Markets also includes<br />
metal sourcing and trading activities, which secures a com-<br />
1) On February 28, 2011 <strong>Hydro</strong> completed the take-over of the majority of Vale’s aluminium business in Brazil. See note 5 to the consolidated financial statements<br />
later in this report for more information on the acquisition.
petitive supply of standard aluminium ingots for our global<br />
production system, and provides operational risk management<br />
through LME hedging activities.<br />
• Rolled Products consists of our rolling mills, which are<br />
located primarily in Europe. Rolled Products also includes<br />
our 50 percent interest in the AluNorf rolling mill in<br />
Germany.<br />
• Extruded Products consists of our extrusion-based business,<br />
located mainly in Europe and the Americas, which is focused<br />
on delivering solutions to the building and construction,<br />
transportation, and engineered products industries.<br />
Extruded Products also includes our aluminium building<br />
systems and precision tubing activities.<br />
• Energy is responsible for managing <strong>Hydro</strong>’s captive hydropower<br />
production, external power sourcing arrangements to<br />
the aluminium business and identifying and developing<br />
competitive energy solutions for <strong>Hydro</strong> worldwide.<br />
History and development<br />
Norsk <strong>Hydro</strong> ASA was organized under Norwegian law as a<br />
public company in 1905 to utilize Norway’s large hydroelectric<br />
energy resources for the industrial production of nitrogen<br />
fertilizers. Our history, spanning many industries and several<br />
continents, has been underpinned by three distinctive<br />
strengths: the spirit of entrepreneurship, a dedication to innovation<br />
and the careful nurturing of our talents and values.<br />
An emphasis on industrial research and new business alliances<br />
enabled us to expand our fertilizer operations following the<br />
first World War. In 1928-29, improved fertilizer technology<br />
was introduced at <strong>Hydro</strong>’s first industrial sites in Telemark in<br />
Southern Norway. Advancements in electricity transmission<br />
technology paved the way for the construction of a new fertilizer<br />
plant at Herøya, close to Porsgrunn. This provided us<br />
with easier access to important raw materials and ideal harbor<br />
conditions.<br />
An era of diversification<br />
In the three decades following the Second World War, <strong>Hydro</strong><br />
rebuilt itself into an industrial conglomerate, expanding into a<br />
number of new businesses in Norway. In 1951, we began producing<br />
magnesium metal and polyvinyl chloride at Porsgrunn.<br />
We constructed the Røldal-Suldal hydroelectric power plant to<br />
provide energy for our operations at Karmøy, and opened an<br />
aluminium reduction and semi-fabricating plant there in 1967.<br />
In order to secure stable access to raw materials and energy for<br />
our fertilizer operations, we investigated opportunities to participate<br />
in oil and gas production in the middle of the 1960s.<br />
After several years, <strong>Hydro</strong> and its partners discovered oil and<br />
gas in the Ekofisk and frigg fields on the Norwegian Continental<br />
Shelf. Our experience in the chemical process industry<br />
and abundant natural gas liquids resources provided the<br />
BusIness DesCrIptIon<br />
History and development<br />
23<br />
foundation for investments in the petrochemicals industry in<br />
Norway. In 1978, we commenced production of ethylene and<br />
vinyl chloride monomer.<br />
During this time, we also pioneered new labor relations practices<br />
aimed at democratizing the workplace and increasing the<br />
cooperation between management and employees, leading to a<br />
spirit of collaboration which continues to define the company<br />
today.<br />
Decades of global expansion<br />
<strong>Hydro</strong> expanded globally in the 1980s. We developed our fertilizer<br />
operations into one of the leading suppliers in Europe.<br />
We also entered a new era as an oil company, becoming operator<br />
of the Oseberg offshore oil field. Research continued to<br />
drive our development as we introduced new technologies for<br />
deep-water oil and gas production and horizontal drilling. In<br />
1986-87, we acquired the Norwegian state-owned aluminium<br />
company, Årdal og Sunndal verk, and several European aluminium<br />
extrusion plants from Alcan and Alcoa, establishing<br />
<strong>Hydro</strong> Aluminium as a major business within <strong>Hydro</strong> and an<br />
important player in the European aluminium industry.<br />
More recently, we have developed our businesses further<br />
through substantial acquisitions, including Saga Petroleum in<br />
1999, vAW Aluminium in 2002 and Spinnaker Exploration<br />
Company in 2005. We also invested significant capital towards<br />
the expansion of existing alumina and aluminium production<br />
facilities, including our fully owned Sunndal primary metal<br />
plant in Norway the part-owned Alouette smelter in Canada<br />
and three substantial expansions of the Alunorte alumina<br />
refinery in Brazil. This was followed by the decision to participate<br />
in the construction of the Qatalum smelter in Qatar. In<br />
2007, <strong>Hydro</strong> completed the first phase of the giant Ormen<br />
Lange gas field, considered one of the largest industrial projects<br />
ever undertaken in Norway. A significant portion of the<br />
expansion of these businesses was financed through the sale of<br />
non-core operations.<br />
Throughout this period, we have continued to focus on<br />
improving working conditions, and have developed principles<br />
and directives underlying our global commitment to a viable<br />
society.<br />
Restructuring and concentration<br />
The first decade of the new millennium also encompassed a<br />
major restructuring of our downstream operations, the closure<br />
of higher cost smelters, and ultimately, the transformation of<br />
<strong>Hydro</strong> into a focused aluminium and energy company. In<br />
2004, we demerged our fertilizer business through the creation<br />
of yara, and we merged <strong>Hydro</strong>’s petroleum activities with Statoil<br />
to form Statoil<strong>Hydro</strong> in 2007, now called Statoil. We<br />
completed the divestment of our Polymers activities in 2008<br />
and our automotive structures business in 2009.
24<br />
BusIness DesCrIptIon<br />
Business and operating information<br />
At the same time, <strong>Hydro</strong> invested roughly NOK 18 billion in<br />
its aluminium and energy businesses in Norway, including<br />
NOK 11 billion in its Norwegian smelter system, NOK 2.2<br />
billion upgrading and expanding its hydropower production<br />
operations and NOK 3 billion in research, development and<br />
production support relating to both its upstream and downstream<br />
aluminium operations. As a result, annual electrolysis<br />
production in Norway increased from 760,000 mt to about<br />
900,000 mt, including the shutdown of roughly 250,000 mt<br />
of older, higher cost and higher emission capacity.<br />
Transforming transaction<br />
In 2011, <strong>Hydro</strong> transformed its business through the acquisition<br />
of the aluminium assets of vale SA, securing its position<br />
in bauxite and alumina and lifting the company to the top tier<br />
in the aluminium industry. Combining vale Aluminium with<br />
<strong>Hydro</strong> has resulted in a stronger company, fully integrated<br />
into bauxite, with a long alumina position and a preferred<br />
standing in a more consolidated market place.<br />
for further information, see www.hydro.com/about hydro/<br />
our history<br />
Business and operating information<br />
The following section includes a description of the industry<br />
developments impacting our business, our strategies for developing<br />
and exploiting our competitive strengths, key performance<br />
targets, including results, and a description of operations<br />
for each of our business areas including key revenue and cost<br />
drivers.<br />
See section – financial and operating review – later in this<br />
report for comparative production and sales volume information<br />
for our different business areas.<br />
Alumina price<br />
% of LME per tonne alumina for long-term contracts<br />
12-13.5%<br />
1990-2002<br />
Source: <strong>Hydro</strong> estimates<br />
13-14.5%<br />
2003-2007<br />
13.5-15%<br />
2008-2009<br />
15-16%<br />
2010-2012<br />
Bauxite & Alumina<br />
Industry overview<br />
Bauxite rock is composed mainly of aluminium oxide and aluminium<br />
hydroxide containing minerals. There are three main<br />
qualities: Gibbsite, Boehmite and Diaspore. The qualities<br />
determine the processing requirements, with corresponding<br />
influence on operating costs and the eventual quality of the<br />
resulting alumina. Gibbsite, the highest quality bauxite, is<br />
found mainly in Brazil. Bauxite is typically mined in open pits<br />
and either processed into alumina in close proximity to the<br />
mining operations or shipped to alumina refineries around the<br />
world for processing. Around 80 percent of global alumina<br />
refining, excluding China, is based on integrated bauxite<br />
sources. In China, about 55 percent of alumina refining is<br />
based on integrated sources.<br />
Guinea, Australia and Brazil are the three largest bauxite producing<br />
countries, which account for 66 percent of available<br />
bauxite globally. Within the bauxite mining industry sector, five<br />
of the largest mines controlled around 35 percent of global production<br />
last year, which amounted to about 250 million mt.<br />
Alumina is one of the most significant cost elements in the<br />
production of aluminium. The alumina market is competitive,<br />
but relatively few players hold a long position, compared with<br />
the primary aluminium market.<br />
Bauxite and alumina price developments<br />
Bauxite and alumina prices have been strongly influenced by<br />
developments in China, which is heavily dependent on<br />
imported bauxite. In 2011, China imported roughly 43 million<br />
mt of bauxite, representing roughly 45 percent of its<br />
bauxite requirements and the quality of Chinese domestic<br />
bauxite is deteriorating. However, China has recently started<br />
to mine underground bauxite deposits in order to maximize its<br />
use of domestic resources.<br />
Alumina contract durations<br />
35%<br />
6 years) Spot (< 2 years)<br />
Medium-term contracts (3-5 years)<br />
55%<br />
20%<br />
25%<br />
Source: <strong>Hydro</strong> estimates
Further improved bauxite and alumina production<br />
<strong>Annual</strong>ized production, million mt<br />
10<br />
8<br />
6<br />
4<br />
2<br />
0<br />
*Pro-forma<br />
1H* 2H 1H* 2H<br />
Alunorte<br />
Paragominas<br />
Alumina prices, as a percentage of LME, have been increasing.<br />
Since 1990, contract prices have risen from a level of around<br />
12 percent of LME reference prices to around 15-16 percent<br />
in 2011. This reflects a general trend where the owners of natural<br />
resources are taking an increasing share of profits. This<br />
trend is expected to continue. There has also been a shift in the<br />
alumina market towards shorter contract durations.<br />
Cost developments<br />
Similar to aluminium, the alumina cost curve has shifted<br />
upwards in the last five years, increasing roughly USD 60 per<br />
mt mainly driven by cost increases in bauxite and fuel.<br />
Strategy and targets<br />
following the successful integration of the vale assets and<br />
business organization, operational stability and further<br />
improvements are key priorities for <strong>Hydro</strong>’s new Bauxite &<br />
Alumina business area. Our goal is to achieve continuous<br />
incremental improvements in capacity utilization by developing<br />
a platform of operational excellence and safe, sustainable<br />
practices to promote responsible, cost-effective operations.<br />
Improve the operating performance<br />
of Paragominas and Alunorte<br />
Our main goal in the coming year will be to continually<br />
improve the capacity utilization and efficiency of our operations.<br />
We will concentrate on increasing the effectiveness of<br />
our production systems, higher productivity and more systematic<br />
execution and follow-up of maintenance activities. Our<br />
aim is to achieve targeted increases in production levels based<br />
on <strong>Hydro</strong>’s strong performance culture.<br />
Reinforce safe and sustainable business practices<br />
The ongoing implementation of appropriate HSE and CSR<br />
strategies reflecting our major presence in Brazil, will be at the<br />
top of our agenda. <strong>Hydro</strong>’s mission is to create a more viable<br />
society by developing natural resources and products in<br />
World cash cost curve<br />
Site cost curve 2011<br />
In USD/t<br />
500<br />
400<br />
300<br />
200<br />
100<br />
Source: CRU<br />
Alunorte<br />
BusIness DesCrIptIon<br />
Bauxite & Alumina<br />
Weighted average cash cost 272<br />
25<br />
0<br />
0 20<br />
40 60 80 100<br />
Capacity: Million ton<br />
innovative and efficient ways. This principle will guide our<br />
actions as we develop our new business.<br />
Expand our bauxite and alumina capacity<br />
Our ambition is to increase our capacity of low-cost alumina,<br />
reinforcing our position as a leading global supplier. Projects<br />
under evaluation include CAP, a new alumina refinery in Barcarena,<br />
close to Alunorte, with an initial capacity of 1.9 million<br />
metric tons and potential for expansions up to 7.4 million mt<br />
and the expansion of the Paragominas mine to 15 million mt.<br />
Improve the commercial value of our resource base<br />
We support the development of market mechanisms that<br />
evolve the pricing structure of our core products to better<br />
reflect the fundamentals of the industry. This includes actively<br />
promoting index pricing and working to establish a premium<br />
for our high quality alumina.<br />
2011 targets<br />
• Stabilize operations at Paragominas and continue to deliver<br />
production increases<br />
• Stabilize production at Alunorte at a level over 6 million mt on<br />
an annual basis<br />
2011 results<br />
• Operations at Paragominas stabilized with record production<br />
of 9 million mt (annualized) in the second half of the year<br />
• Improved operational stability in Alunorte with production over<br />
6 million mt (annualized) in the second half of the year<br />
2012 targets<br />
• Continue to stabilize and improve production and operational<br />
performance at our sites<br />
• Further HSE improvements with a focus on high-risk incidents<br />
Ambitions going forward<br />
We are strongly committed to safety and to eliminating high-risk<br />
incidents in our operations. Going forward, we intend to capitalize on<br />
our long position in bauxite and alumina in a resource constrained<br />
world. We intend to secure and grow our capacity to enable the<br />
expansion of our metal business and to enhance our position in<br />
a profitable bauxite and alumina market. This will increase our<br />
attractiveness as a partner in new ventures and our ability to influence<br />
the further restructuring of the aluminium industry as a whole.
26<br />
BusIness DesCrIptIon<br />
Bauxite & Alumina<br />
Operations<br />
<strong>Hydro</strong>’s bauxite is mined in open pits, and sorted and crushed<br />
into sizes suitable for transportation as slurry by pipeline<br />
approximately 240 kilometers to Alunorte for refining into alumina.<br />
Alumina processing begins by removing the water from<br />
the bauxite slurry, then mixing the bauxite with caustic soda at<br />
high temperature and pressure. The resulting mixture is pumped<br />
into a digester, where a chemical reaction dissolves the alumina.<br />
This process produces a sodium aluminate solution, which is<br />
transferred into tanks to separate impurities through settling<br />
and filtration. The cooled sodium aluminate solution is then<br />
pumped into precipitators to grow alumina crystals, which are<br />
transferred to thickening tanks and further to fluid bed calciners<br />
to remove water, producing pure alumina.<br />
Cost and revenue drivers<br />
The main cost drivers for bauxite are labor, maintenance/consumables<br />
and energy, representing around 65 percent of the<br />
cash cost of mining activities. Labor, the largest cost factor<br />
accounting for about 25 percent, is influenced by Brazilian<br />
wage levels and productivity developments. Maintenance/consumables<br />
are influenced by inflation and efficiency in<br />
operations.<br />
for alumina refining, bauxite and energy represent nearly 70<br />
percent of cash costs. Caustic soda is also important, accounting<br />
for about 15 percent of costs. Bauxite purchases from Paragominas,<br />
and under long-term contracts from MRN, are based on<br />
prices partly linked to the LME and to alumina market prices.<br />
Realized alumina prices, the key revenue driver, represent<br />
roughly 13-14 percent of LME reference prices for <strong>Hydro</strong>’s<br />
combined internal and external sales portfolio. Based on existing<br />
contract terms, similar percentages are expected though<br />
2015, with only minor volumes available for sale before 2016.<br />
Over time, we expect market mechanisms will likely evolve the<br />
price of our core products to better reflect the cost fundamentals<br />
of the industry.<br />
Competitive strengths<br />
• Paragominas, one of the world’s largest bauxite mines with<br />
a current reserve life of roughly 30 years<br />
• Significant bauxite resources beyond current reserves<br />
• High quality Gibbsite bauxite delivering refining benefits<br />
in the form of lower investment and operating costs<br />
• Unique integrated pipeline generating increasing<br />
economies with higher production and potential<br />
expansions. Low environmental impact<br />
• Alunorte, the world’s largest alumina refinery, and one of<br />
the most cost effective on an integrated cash cost basis<br />
• High quality, low variability, differentiated alumina<br />
• Favorable long alumina position with market prices trending<br />
upwards, shorter contract durations and growing spot market<br />
• Substantial expansion opportunities to 15 million mt of<br />
bauxite and 8 million mt of alumina<br />
Bauxite mining<br />
Paragominas is located in the Brazilian state of Pará. The mine<br />
has a nominal production capacity amounting to 9.9 million<br />
metric tons, 12-percent moisture bauxite on an annual basis<br />
which represents about 4 percent of global capacity. We own<br />
60 percent of Paragominas with an option to increase our<br />
interest to 100 percent by 2015.<br />
Operations at Paragominas commenced in the first quarter of<br />
2007, and began supplying raw material to the Alunorte alumina<br />
refinery at the same time. An expansion – Paragominas<br />
II – was completed in the second quarter of 2008. The potential<br />
for further expansion is estimated to be 5.0 million mt per<br />
year.<br />
Mining at Paragominas is currently based on traditional technology<br />
and equipment. Operations include a mining fleet of<br />
about 170 vehicles and 850 employees. Going forward, productivity,<br />
and therefore operating cost improvements, can be<br />
achieved through the introduction of continuous mining technology,<br />
including large-scale excavators and long-distance conveyor<br />
systems.<br />
The site is connected to a 244-kilometer slurry pipeline with<br />
an annual capacity of 14.9 million mt. It is the only bauxite<br />
slurry pipeline in the world, and has significant integration<br />
advantages combined with a very low environmental impact.<br />
The following table includes production volumes for the Paragominas<br />
mine (on a 100 percent basis):<br />
Nominal Recovery<br />
Million mt Mine type 2011 2010 2009 Capacity rate<br />
Final bauxite<br />
production<br />
Open pit 8.2 7.5 6.2 9.9 70%<br />
Paragominas supplies all of its production to Alunorte. In<br />
2010 and 2011, Paragominas provided about 52 and 51<br />
Bauxite production<br />
Million mt<br />
10<br />
8<br />
6<br />
4<br />
2<br />
0<br />
2007<br />
2008<br />
2009<br />
2010<br />
2011<br />
Target
Alumina production<br />
Million mt<br />
7<br />
6<br />
5<br />
4<br />
3<br />
2<br />
1<br />
0<br />
1995<br />
1996<br />
1997<br />
1998<br />
1999<br />
2000<br />
2001<br />
2002<br />
2003<br />
percent of Alunorte’s bauxite requirements, respectively. The<br />
remainder was provided by MRN, in which <strong>Hydro</strong> has a 5<br />
percent ownership interest. 1)<br />
Alumina refining<br />
<strong>Hydro</strong>’s major alumina asset is its 91 percent interest in Alunorte.<br />
following the completion of a third expansion in 2008,<br />
the Alunorte refinery has an annual capacity of approximately<br />
6.3 million mt of alumina. Alunorte is competitive due to the<br />
high quality of its alumina, advantages in scale and technology,<br />
low energy consumption and labor costs. The plant has several<br />
cost advantages, including an efficient energy mix of heavy fuel<br />
oil and coal, competitive caustic soda consumption due to<br />
high quality bauxite and a potential for lower transport costs<br />
through higher pipeline throughput.<br />
The following table includes production volumes for Alunorte<br />
(on a 100 percent basis):<br />
Million mt 2011 2010 2009<br />
Nominal<br />
Capacity<br />
Alumina production 5.8 5.8 5.9 6.3<br />
CAP, a new alumina refinery to be located in Barcarena, close<br />
to Alunorte, has been under evaluation for development in a<br />
joint venture between <strong>Hydro</strong> and Dubai Aluminium Company<br />
Limited (<strong>Hydro</strong>’s share, 81 percent). The refinery is<br />
expected to have an initial annual capacity of 1.9 mt, with the<br />
potential for expansions up to 7.4 million mt over four phases.<br />
The plant will be supplied with bauxite from the Paragominas<br />
mine.<br />
CAP is expected to be built on technology and project execution<br />
experienced gained from Alunorte. Development is<br />
expected to be carried out in parallel with an expansion of the<br />
Paragominas mine. In March 2012, a decision was taken to<br />
1) Earnings from our investment in MRN are included in “Financial income.”<br />
2004<br />
2005<br />
2006<br />
2007<br />
2008<br />
2009<br />
2010<br />
2011<br />
Target<br />
Alumina position<br />
9,000<br />
8,000<br />
7,000<br />
6,000<br />
5,000<br />
4,000<br />
3,000<br />
2,000<br />
1,000<br />
0<br />
2011 2012<br />
Alunorte equity<br />
2013<br />
BusIness DesCrIptIon<br />
Bauxite & Alumina<br />
2014<br />
Sourcing contracts<br />
Smelter demand incl. share in JV’s<br />
2015<br />
2016<br />
Potential<br />
2017<br />
2018<br />
2019<br />
27<br />
2020<br />
postpone the devleopment of CAP due to market<br />
uncertainity.<br />
Commercial operations<br />
<strong>Hydro</strong> sources bauxite from Paragominas and MRN and alumina<br />
from Alunorte, and a number of external sources. In<br />
addition to its own equity interests, <strong>Hydro</strong> has a volume offtake<br />
agreement for vale’s 40 percent interest in Paragominas<br />
and a contract for 40 percent of the volume produced by<br />
MRN, which amounted to 17 million mt (100 basis) in 2011.<br />
External sources for alumina include <strong>Hydro</strong>’s contract with<br />
Rio Tinto for the supply of 500,000 mt of alumina annually<br />
from 2006 through 2030. We have also exercised an option for<br />
an additional 400,000 mt of alumina deliveries linked to the<br />
expansion of Rio Tinto’s yarwun refinery in Australia in addition<br />
to other short and medium-term purchase contracts.<br />
These contracts typically have pricing formulas based upon a<br />
percentage of the LME price.<br />
We also enter into contracts to buy and sell alumina in order<br />
to optimize our physical alumina portfolio on a short and<br />
medium-term basis.<br />
See section later in this report financial review, Proforma information,<br />
Bauxite & Alumina for external volumes of bauxite and<br />
alumina purchased and external volumes of alumina sold.
28<br />
BusIness DesCrIptIon<br />
Primary Metal<br />
Primary Metal<br />
Industry overview<br />
Primary aluminium is derived from the naturally occurring<br />
ore, bauxite, which is refined into alumina. Aluminium smelting<br />
is a capital-intensive, technology-driven industry concentrated<br />
in relatively few companies. Geographically, China is<br />
the largest consumer and producer of aluminium, impacting<br />
market fundamentals. India, Russia and the Middle East are<br />
also growing in importance in the production of aluminium.<br />
Secondary aluminium is derived from remelting and recycling<br />
aluminium scrap. Scrap is generated both in the production<br />
and use of aluminium products. Recycling only requires about<br />
5 percent of the amount of energy that is needed for electrolysis.<br />
20-25 percent of aluminium products are made from used<br />
consumer scrap. Roughly 75 percent of all aluminium produced<br />
since the Hall-Heroult process was discovered in 1886<br />
is still in use.<br />
Aluminium is used in a variety of applications in several industries.<br />
The major consumer segments are transportation, building<br />
and construction, and packaging. The major consuming<br />
areas are China, Western Europe, North America and Japan.<br />
Demand for aluminium products in mature markets like North<br />
America and Europe is normally in line with economic developments,<br />
but tends to be pro-cyclical – i.e. falling to a greater<br />
extent than other products, but also growing faster during a<br />
recovery. We expect growth in global market demand of 5 to 7<br />
percent in 2012, followed by stable long-term growth, driven<br />
primarily by infrastructure investments and economic development<br />
in China and other large, developing economies.<br />
Structural developments<br />
As a result of industry consolidation, relatively few companies<br />
are producing a substantial portion of primary metal on a global<br />
2011 Global aluminium consumption* by end use<br />
Total market 61,742 mt<br />
24%<br />
6%<br />
9%<br />
9%<br />
6%<br />
12%<br />
10%<br />
24%<br />
* Consists of semi fabricated products (included recycled aluminium)<br />
Source: CRU LT 2011<br />
Electrical<br />
Machinery &<br />
equipment<br />
Transport<br />
Consumer<br />
durables<br />
Foil stock<br />
Other<br />
Construction<br />
Packaging<br />
Top 10 world primary aluminium<br />
producers in 2011<br />
Million metric tons<br />
5<br />
4<br />
3<br />
2<br />
1<br />
0<br />
UC Rusal<br />
Source: CRU<br />
basis. <strong>Hydro</strong>, the fifth largest producer, has increased its capacity<br />
by nearly 50 percent in 2011, with the ramp up of Qatalum in<br />
Qatar and the integration of the Albras smelter in Brazil. Several<br />
important smaller producers in emerging markets exhibit strong<br />
growth ambitions. However, access to sufficient bauxite<br />
resources appears to be a constraint. There are also several new<br />
operators in China, which are presently focusing on supplying<br />
the Chinese market.<br />
Most companies appear to be targeting integration into both<br />
energy and bauxite, while the focus on downstream integration<br />
has been lower. As a result, the downstream aluminium industry<br />
has evolved significantly, with consolidation as well as spin-offs<br />
from large integrated aluminium companies. Today, there are<br />
only two major global integrated aluminium companies – Alcoa<br />
2011 Global aluminium consumption* by region<br />
Total market 61,742 mt<br />
12%<br />
41%<br />
Rio Tinto Alcan<br />
5%<br />
Alcoa<br />
Chalco<br />
15%<br />
<strong>Hydro</strong><br />
4%<br />
3%<br />
5%<br />
15%<br />
Dubal<br />
* Consists of semi fabricated products (included recycled aluminium)<br />
Source: CRU LT 2011<br />
BHP Billiton<br />
China Power Investment<br />
Xinfa Group<br />
Aluminium Bahrain<br />
Western Europe<br />
Eastern Europe<br />
& CIS<br />
North America<br />
& Mexico<br />
South America<br />
Japan<br />
China<br />
Other Asia<br />
Middle East<br />
& Africa<br />
East Hope Aluminium
and <strong>Hydro</strong> – but both have also restructured their downstream<br />
portfolios significantly during the last several years.<br />
Restructuring is expected to continue as the major metals and<br />
mining companies reduce their exposure to downstream operations<br />
and streamline their metal portfolios, targeting specific<br />
markets to increase the scale of their core operations. These<br />
developments have led to the opportunity for <strong>Hydro</strong> to acquire<br />
the aluminium operations of vale. New capacity is also<br />
expected to be developed in emerging, fast-growing markets.<br />
Aluminium price developments<br />
Primary aluminium is traded on various metal exchanges, primarily<br />
the London Metal Exchange (LME). The Shanghai<br />
futures Exchange (SHfE) has grown in importance for international<br />
trade of standard ingots with China. However, China<br />
has followed a policy of promoting a balanced internal market<br />
and has used incentives to discourage the export of primary<br />
metal, while encouraging the export of higher-value added<br />
fabricated and semi-fabricated products.<br />
Aluminium prices are heavily influenced by economic and<br />
market developments. During the financial crisis of 2008/2009<br />
prices exhibited an historic decline as turmoil in the financial<br />
markets spread into the general economy. Prices remained<br />
volatile but improved continuously throughout 2010 and into<br />
the first half of 2011 before falling to around USD 2000 per<br />
mt at the end of the year. In addition, as a result of trading by<br />
financial investors in the derivative markets, price volatility has<br />
been high during the past several years and may continue.<br />
<strong>Report</strong>ed inventories increased significantly in the previous<br />
downturn, more than doubling from under 3 million mt to over<br />
7 million mt, representing about 2 months of global consumption.<br />
Inventories have remained at around this level with a large<br />
portion of the metal owned by financial investors<br />
Aluminium price in USD/mt<br />
3,500<br />
3,000<br />
2,500<br />
2,000<br />
1,500<br />
1,000<br />
LME (3m quarterly average)<br />
LME forward (January 9)<br />
BusIness DesCrIptIon<br />
Primary Metal<br />
29<br />
taking advantage of low interest rates, warehouse incentives and<br />
contango in the forward aluminium markets. The increase in<br />
inventories has resulted in a tight physical market and historically<br />
high ingot premiums, although premiums have declined recently.<br />
Cost developments<br />
In the last five years, the aluminium industry cost curve has<br />
increased on average about USD 300 per metric ton, mainly due<br />
to higher input costs driven by strong demand for raw materials<br />
in emerging economies and in China in particular. More than half<br />
of the increase is related to power with the remainder reflecting<br />
higher costs for carbon and alumina. The upward trend paused<br />
temporarily in 2009 as commodity prices in general fell. However,<br />
costs increased in 2010, and there has been a further increase<br />
in cost pressure during 2011.<br />
In the future, primary aluminium production is expected to be<br />
developed in energy-rich areas where power prices are more competitive<br />
than in developed energy markets such as Europe and the<br />
U.S. Such countries and regions are expected to include the Middle<br />
East, India, Iceland and some countries in Africa, Asia and<br />
South America. China will also continue to be an important producer<br />
and consumer of primary metal.<br />
Strategy and targets<br />
A key ongoing strategic focus for Primary Metal is the continuous<br />
improvement of the efficiency of our smelter system,<br />
while constantly addressing the cost challenges facing our<br />
business. In order to secure the viability of our operations over<br />
time, we intend to focus on business opportunities that<br />
enhance our cost position. We also intend to maintain our<br />
technological leadership, which contributes to lower operating<br />
costs, reduced emissions and ensures our attractiveness as a<br />
partner for world-class projects within an industry with sound<br />
long-term fundamentals.<br />
Improve our average smelter-cost position<br />
A core strategy for <strong>Hydro</strong> has been the continual upgrading of its<br />
smelter portfolio, replacing higher cost, less-competitive production<br />
with new capacity in larger and more efficient smelters. To<br />
further improve our competitiveness we are executing an<br />
improvement program targeting USD 300 per mt for our<br />
wholly-owned smelters by the end of 2013. Substantial savings<br />
have already been achieved, and we expect to meet our target<br />
through further improvements in efficiency and reduced costs in<br />
areas such as purchasing, logistics, technology, manning and<br />
organization. following the completion of a successful ramp-up,<br />
another key priority in the coming year will be to secure stable<br />
production and the first quartile cost position of Qatalum.<br />
Optimize our position in alumina, power, carbon<br />
and other key raw material costs<br />
With the vale acquisition, we have secured our equity alumina<br />
coverage and captured the value of this important part of the<br />
value chain. We also have an industry-leading captive power
30<br />
Improvement program increased to USD 300 per mt<br />
Improvement initiatives:<br />
• Operational improvements<br />
– Improved current efficiency<br />
– Reduced power consumption<br />
– Reduced anode consumption<br />
• Fixed cost reductions and lean operations<br />
• Further operational improvements<br />
• Technology costs/spin-offs<br />
• Investments<br />
• Maintenance and relining<br />
• Procurement<br />
• Logistics<br />
• Organization and manning<br />
• Casthouse product margin<br />
position, and roughly two-thirds of our energy usage is based<br />
on hydro power. We are continually working to secure competitive<br />
power arrangements as long-term contracts expire.<br />
We are also increasing our focus on the procurement and supplier<br />
portfolio for our carbon requirements and seeking<br />
increasing efficiencies in the activities driving other operating<br />
costs.<br />
Focus on selective growth projects<br />
Our growth efforts are directed toward projects that improve<br />
<strong>Hydro</strong>’s cost position in the industry, while maintaining a<br />
strong focus on sustainable development. A second phase of<br />
the Qatalum smelter has the potential to increase the plant’s<br />
annual capacity to 1.2-1.5 million mt (<strong>Hydro</strong> share, 50 percent).<br />
There is also potential to expand the low-cost Alouette<br />
smelter in Canada from 600,000 mt to 900,000 mt (<strong>Hydro</strong><br />
share 20 percent).<br />
Strong performance culture<br />
Reduced specific energy consumption<br />
kwh/Kg aluminium*<br />
15.0<br />
14.5<br />
14.0<br />
13.5<br />
13.0<br />
12.5<br />
12.0<br />
11.5<br />
11.0<br />
BusIness DesCrIptIon<br />
Primary Metal<br />
1998<br />
2003<br />
2008<br />
2009<br />
2010<br />
* Average specific energy consumption from 100%-owned Norwegian smelters<br />
2011 Qatalum HAL4e<br />
<strong>Annual</strong> cost savings compared to 2009:<br />
300<br />
250<br />
200<br />
150<br />
100<br />
50<br />
0<br />
Real 2010<br />
2011<br />
2012<br />
2013 onwards<br />
Advance our operational excellence<br />
and technological leadership<br />
We focus on extracting measurable benefits from the application<br />
of our AMPS system (Aluminium Metal Production System),<br />
a methodology designed to ensure best practices and<br />
operating efficiencies across our portfolio. We are developing<br />
new proprietary smelting technology with the aim at raising<br />
our cost competitiveness, to further strengthen our environmental<br />
standards and to support our growth ambitions.<br />
2011 targets<br />
• Safe and efficient operations<br />
• Effective integration of Albras smelter<br />
• Cost reductions extended to USD 300 per mt, including USD<br />
175 per mt by end 2011<br />
• Complete Qatalum ramp-up<br />
• Continue strong capital discipline<br />
2011 results<br />
• Despite high attention, TRI targets not achieved, however good<br />
performance compared with industry standards<br />
• Albras integrated into Primary metal smelter portfolio<br />
• Cost reductions of USD 200 per mt achieved, program on track<br />
• Qatalum ramp-up successfully completed<br />
• Strong focus on capital discipline resulting in reduced sustaining<br />
capital expenditure from NOK 1,371 million to NOK 1,050 million<br />
2012 targets<br />
• Safe and efficient operations<br />
• Cost reductions targeted to USD 300 per mt, including USD 235<br />
per mt by end 2012<br />
• Secure first quartile cost position for Qatalum<br />
• Continue strong capital discipline<br />
Ambitions going forward<br />
<strong>Hydro</strong> has an ambition to expand its upstream activities while<br />
maintaining a strong emphasis on sustainable cost development.<br />
We will continue to focus on lean smelter operations, operational<br />
excellence and safety. The ongoing development of next-generation<br />
technology, HAL4e, will provide a strong technological basis for<br />
continued organic growth, increased efficiency and lower emissions.
Operations<br />
<strong>Hydro</strong>’s primary aluminium plants have reduction facilities<br />
with pot lines and casthouses, where liquid and remelted aluminium<br />
is cast to form value-added products such as extrusion<br />
ingot, primary foundry alloys, sheet ingot and wire rod, in<br />
addition to standard ingot.<br />
Cost and revenue drivers<br />
The main cost drivers for the production of primary aluminium<br />
include alumina, power and carbon, which together comprise<br />
Aluminium smelting process<br />
Electrical power<br />
Wire rod<br />
Extrusion ingot<br />
Gas scrubber<br />
Sheet ingot<br />
BusIness DesCrIptIon<br />
Primary Metal<br />
31<br />
about 75 percent of the cash costs of electrolysis metal. Approximately<br />
two metric tons of alumina are required to produce one<br />
metric ton of aluminium, representing about 30 percent of the<br />
production cost of primary aluminium. 1) Energy represents on<br />
average about 25-30 percent of the operating costs. Carbon<br />
anodes consumed in the smelting process account for 15-20 percent<br />
of the total production cost of primary aluminium.<br />
Realized aluminium prices are the single most important revenue<br />
driver. Realized prices lag three-month LME prices by<br />
Primary foundry alloys<br />
Primary aluminium is produced in reduction plants where pure aluminium is formed from alumina by an electrolytic process. This process is carried out in electrolytic cells,<br />
in which the carbon cathode placed in the bottom of the cells forms the negative electrode. Anodes, which are made of carbon, are consumed during the electrolytic process<br />
when the anode reacts with the oxygen in the alumina to form CO 2 . The process requires electric energy, about 13 kWh per kilo aluminium produced in modern production lines.<br />
Silo<br />
Steel shell<br />
Cathode (carbon in base and sides)<br />
Anode (carbon)<br />
Electrolyte (960ºC)<br />
Alumina<br />
Electrolysis (potline)<br />
Liquid aluminium<br />
... is transported to casthouse<br />
Direct chill<br />
curing of<br />
aluminium<br />
ingots
32<br />
BusIness DesCrIptIon<br />
Primary Metal<br />
roughly 3-4 months for our smelter system with the exception<br />
of Qatalum and Albras which lag the LME spot prices by<br />
about one month.<br />
Competitive strengths<br />
• Worldwide production network of modern, cost efficient<br />
primary aluminium facilities including the Norwegian<br />
plant in Sunndal, which is the largest and most modern<br />
primary metal plant in Europe, and Qatalum, our new,<br />
world-class smelter in Qatar<br />
• Attractive partner with nearly half of our capacity sourced<br />
from joint venture arrangements<br />
• Competitive position on the industry cash-cost curve<br />
• Culture of continuous improvement and solid track record<br />
of continually upgrading efficiency of smelter portfolio<br />
• Most primary aluminium output sold in the form of<br />
value-added casthouse products<br />
• Captive alumina position with 100 percent coverage<br />
• Robust power position, largely based on hydropower.<br />
Substantial coverage of current production until 2020 and<br />
beyond<br />
• Technological leadership and world-class smelter<br />
technology<br />
Aluminium smelter system<br />
<strong>Hydro</strong> is one of the world’s largest producers of primary aluminium,<br />
with production from 12 wholly or partly owned<br />
plants in 2011. In 2011, we produced 1.982 mt of primary<br />
aluminium. Actual electrolysis production continued to be<br />
impacted by curtailments that were completed at several plants<br />
in the first half of 2009. See the section, financial and operating<br />
performance, for actual electrolysis and casthouse production<br />
for the years 2010 and 2009.<br />
Power<br />
Internal supply contracts between our hydropower production<br />
operations and our aluminium metal business covered about<br />
half of the energy consumption of our wholly owned Norwegian<br />
smelters in 2011. The remainder was mainly covered by<br />
external supply contracts with Statkraft, a Norwegian electricity<br />
company. These contracts will expire in 2020. In addition,<br />
<strong>Hydro</strong> has a power contract with the Swedish company<br />
vattenfall for the supply of close to 18 TWh of electricity over<br />
an eight-year period, starting in 2013. Energy for Qatalum is<br />
provided by an integrated natural gas-fired power plant supplied<br />
by <strong>Hydro</strong>’s joint venture partner, Qatar Petroleum.<br />
Albras purchases electricity from the Tucuru hydroelectric<br />
power plant under a long-term agreement from Eletronorte.<br />
Approximately two thirds of our energy requirements are provided<br />
by hydropower.<br />
Energy for the remainder of our smelter system is covered<br />
under medium to long-term contracts with the exception of<br />
our German smelter in Neuss, which is covered in the shortterm<br />
market.<br />
In 2011, a new long-term contract was agreed for our Tomago<br />
smelter in Australia and a Memorandum of Understanding<br />
was signed for the potential expansion of Alouette and extension<br />
of the existing contract. In Brazil, a dialog has been established<br />
between the government and industry to address<br />
challenging power costs due to inflation and the strong BRL.<br />
Anodes<br />
Most of our smelters produce anodes on-site, and several of<br />
these facilities have been upgraded and expanded over the<br />
years.<br />
Technology and HSE<br />
Our proprietary technology plays an important role in securing<br />
our competitive position. We believe our technology serves<br />
as an industry benchmark for environmental performance,<br />
and sets high standards for safety and productivity. We have<br />
targeted a 25 percent reduction in research and development<br />
costs compared to 2009, which will mainly impact lower priority<br />
projects as part of our USD 300-per-mt improvement<br />
program.<br />
We have a strong commitment to safety including a systematic<br />
review and followup of several key performance indicators.<br />
One of these, the TRI rate (total recordable injuries per million<br />
hours worked), increased in 2011 to 3.1 from a level of<br />
2.5 in 2010. for 2012, we have targeted a reduction of 23<br />
percent to 2.4.<br />
1) We purchase alumina from Alunorte based on prices linked to the LME, with a lag of one month. Prices are adjusted monthly based on the average monthly<br />
LME three-month prices, applied with a one-month delay.
Plant Country<br />
Employees<br />
(per Dec. 31)<br />
Electrolysis<br />
capacity<br />
(000 mt) 1)<br />
Casthouse<br />
capacity<br />
(000 mt)<br />
Karmøy Norway 418 184 3) 230 extrusion ingot,<br />
wire rod<br />
Årdal Norway 562 192 330 sheet ingot,<br />
foundry alloys<br />
Sunndal Norway 709 390 4) 515 extrusion ingot,<br />
foundry alloys<br />
Main<br />
products Key characteristics 2)<br />
• Two prebake lines, one Sødererg line<br />
(Søderberg line shut-down first quarter 2009)<br />
• R&D center, rolling mill, extrusion plant and other<br />
downstream activities<br />
• Two prebake lines<br />
• Substantial anode production<br />
• Technology and competence center<br />
• Two prebake lines<br />
• Major expansion completed 2004<br />
• Largest and most modern plant in Western Europe<br />
• Casthouse expansion and other enhancements<br />
completed in 2007<br />
Høyanger Norway 159 62 120 sheet ingot • One prebake line<br />
• New casting furnace installed 2009<br />
Søral<br />
(49.9%)<br />
Slovalco<br />
(55.3%)<br />
Norway 287<br />
(100% basis,<br />
per Dec. 31)<br />
Slovakia 479<br />
(100% basis)<br />
90 5) 95 extrusion ingot • Joint venture between <strong>Hydro</strong> and<br />
Rio Tinto Alcan (RTA).<br />
• Plant expansions in 1997 and 2003<br />
• Long-term power contracts through 2012<br />
165 179 extrusion ingot,<br />
foundry alloys<br />
• Joint venture with Ziar nad Hronom, Slovakia<br />
• One prebake line<br />
• Long-term power contract through 2013<br />
• Among the world’s lowest cost smelters<br />
Neuss Germany 684 235 6) 370 sheet ingot • Three prebake lines<br />
• Key supplier to Alunorf rolling mill<br />
• Power supplied under short-term contracts<br />
Kurri Kurri Australia 519 180 185 extrusion ingot,<br />
foundry alloys<br />
Tomago<br />
(12.4%)<br />
Qatalum<br />
(50%)<br />
Alouette<br />
(20%)<br />
Albras<br />
(51%)<br />
Australia 1 051<br />
(100% basis)<br />
Qatar 1 114<br />
(100% basis)<br />
Canada 1 093<br />
(100% basis)<br />
Brazil 1 286<br />
(100% basis)<br />
67 67 standard ingot,<br />
extrusion ingot,<br />
sheet ingot<br />
300 313 extsruion ingot,<br />
foundry alloys<br />
BusIness DesCrIptIon<br />
Primary Metal<br />
• Three prebake lines<br />
• Completed substantial plant upgrade in 2006<br />
• Long-term power contract through 2017<br />
• Joint venture with RTA and GAF<br />
• Three prebake lines<br />
• Largest producer in Australia<br />
• Expansions in 1992, 1998, 2002 and 2006<br />
• Joint venture with Qatar Petroleum<br />
• Two prebake lines<br />
• Worlds largest one-step smelter construction<br />
• Among world’s lowest cost smelters<br />
116 116 standard ingot • Joint venture with RTA, AMAG and SGF/Marubeni<br />
• Two prebake lines<br />
• Largest producer in North America<br />
• Among the world’s lowest cost smelters<br />
• Expansion completed May 2005<br />
460 425 standard ingots • Joint venture with NAAC<br />
• 4 prebake lines<br />
• Largest producer in South America<br />
• Liquid sales to Alunar (32 kt)<br />
1) Production and casthouse capacity for part-owned companies represents our proportional share. For financial reporting, Søral and Qatalum are accounted for as an<br />
equity investment while Tomago and Alouette are consolidated on a proportional basis. Slovalco and Albras are fully consolidated in terms of volumes and financial results.<br />
2) See discussion below regarding power supply for our four wholly owned Norwegian smelters.<br />
3) Capacity reduced by 120,000 mt due to permanent closure of Søderberg line in the first quarter of 2009.<br />
4) Actual production impacted by temporary shutdown of about 100,000 mt of capacity in the second quarter of 2009.<br />
5) Actual production impacted by temporary shutdown of about 43,000 mt of capacity (<strong>Hydro</strong> share) in the first quarter of 2009.<br />
6) Actual production impacted by temporary shutdown of about 190,000 mt of capacity in the second quarter of 2009.<br />
33
34<br />
BusIness DesCrIptIon<br />
Metal Markets<br />
Inventory development 2011*<br />
1,000 tonnes Days<br />
250<br />
200<br />
150<br />
100<br />
50<br />
0<br />
0<br />
Dec Jan Feb Mar Apr May Jun Jul Aug Sep Oct Nov Dec<br />
Product stocks Total inventory in days of production<br />
Ingot trading stock<br />
Raw materials stock<br />
Metal Markets<br />
Strategy and targets<br />
<strong>Hydro</strong>’s flexible and extensive multi-sourcing system enables<br />
us to rapidly adjust our remelt production to market demand.<br />
We intend to capitalize on this flexibility going forward to<br />
secure our position in an uncertain market and to create additional<br />
value on top of LME for our primary capacity. We will<br />
also exploit this competitive advantage to optimize our casthouse<br />
utilization, increase our business volume and provide a<br />
strong basis for strategic alliances. Optimizing the commercial<br />
value of the full production volumes of Qatalum will be a key<br />
priority for the coming year as we grow further our market<br />
positions in the U.S. and Asia.<br />
Strengthen our margin management<br />
Our broad network of primary casthouses, stand-alone remelters,<br />
and partly owned primary sources enables us to create value<br />
in servicing our internal and external downstream customers<br />
while optimizing our logistical operations. Through offering a<br />
diversified product mix, scrap conversion services, commercial<br />
services and technical support, we plan to enhance our margins<br />
while protecting and developing our market shares. We will<br />
continue to focus on strengthening our margin management to<br />
contribute towards improved and more stable earnings in our<br />
primary casthouses and stand-alone remelters.<br />
Increase our business volume with limited asset<br />
investment and grow in recycling<br />
We have focused on building a strong position in the metal<br />
products markets to optimize the capacity of our integrated<br />
casthouses, grow our remelt operations and offer substantially<br />
higher volumes of value-added products into the marketplace.<br />
Subject to improved market conditions, we intend to increase<br />
our aluminium recycling activities to become a European<br />
leader in line with our position as the leading supplier of casthouse<br />
and semi-fabricated aluminium products. We expect<br />
5<br />
* Incl. WIP<br />
40<br />
35<br />
30<br />
25<br />
20<br />
15<br />
10<br />
Sales of casthouse value added products<br />
and ingot trading<br />
Million tonnes<br />
4,000<br />
3,000<br />
2,000<br />
1,000<br />
0<br />
2002<br />
2003<br />
2004<br />
Liquid production<br />
Remelting primary casthouses<br />
Stand-alone remelters<br />
2005<br />
2006<br />
2007<br />
2008<br />
�ird party metal products<br />
Ingot trading, external sales<br />
2009<br />
2010<br />
2011 targets<br />
• Safe operations and improved profitability for all remelt<br />
operations<br />
• Margin improvements for all casthouse products, including<br />
primary smelter casthouses<br />
• Execution of Qatalum marketing plan for full production volumes<br />
• Further develop recycling business opportunities<br />
2011 results<br />
• Increase in TRI incidents in total but with a significant reduction<br />
in Asian operations.<br />
• Further improvement in remelt operations and flexible use of<br />
remelting during a softening market<br />
• Improved margins for remelter and primary casthouse products<br />
despite increasingly challenging market conditions<br />
• Increased market share in the U.S. and Asia through successful<br />
marketing of Qatalum production with high share of value added<br />
products<br />
• Continued strong operational performance in metal sourcing and<br />
trading<br />
• Matured portfolio of recycling projects further and continued<br />
technology development, although postponed decision related<br />
to recycling center at Karmøy<br />
2012 targets<br />
• Safe operations with continuous TRI rate reduction<br />
• Pursue optimal market position regarding margin and volume<br />
developments<br />
• Achieve operational improvements in commercial activities and<br />
production operations from defined performance programs<br />
• Gain market share in new high purity aluminium products<br />
• Progress on execution of <strong>Hydro</strong>’s recycling strategy<br />
Ambitions going forward<br />
Our vision is to be the preferred partner for casthouse products<br />
and services. Our ambition is to utilize the flexibility of our multisourcing<br />
system and manage our product portfolio globally in<br />
order to optimize margins and increase our global market share,<br />
including developing positions in emerging markets. We will<br />
continue a strong focus on safety, and maintain firm discipline on<br />
operating costs and capital expenditures.<br />
2011<br />
that the strong global growth in recycled aluminium will continue<br />
at a high pace, driven by growing environmental concerns<br />
and the need to save energy and other resources.
Active risk management<br />
We have developed expertise within our sourcing and trading<br />
operations to enhance the value of our commercial portfolio,<br />
using strategies aimed at reducing the exposure of our margins<br />
to changes in the LME commodity prices and currency rates.<br />
We will continue to leverage this expertise by developing and<br />
executing strategies to hedge such risk exposures within our<br />
upstream and downstream businesses, mainly resulting from<br />
time lags between our manufacturing process and the pricing<br />
of products to our customers.<br />
Operations<br />
Metal Markets includes all sales and distribution activities<br />
relating to products from our primary metal plants, our standalone<br />
remelters and our high purity aluminium business. We<br />
operate nine remelters, which recycle scrap as well as standard<br />
ingot 1) into new products. We also market metal products<br />
from our part-owned smelters and third parties and engage in<br />
other sourcing and trading activities, including hedging activities<br />
on behalf of all business areas in <strong>Hydro</strong>.<br />
Cost and revenue drivers<br />
Our results are mainly impacted by the operating results of our<br />
stand-alone remelters and high purity aluminium business,<br />
margins on sales of third party products and results from physical<br />
and LME trading activities.<br />
Revenues for our stand-alone remelters are influenced by volumes<br />
and product premiums over LME. Costs are driven by<br />
the cost of scrap and standard ingot premiums over LME,<br />
freight costs to customers and operational costs including<br />
energy consumption and prices.<br />
Our results can be heavily influenced by currency effects 2) and<br />
ingot inventory valuation effects 3)<br />
Competitive strengths<br />
• Leading worldwide supplier of extrusion ingot, sheet ingot,<br />
wire rod and foundry alloys<br />
• Extensive multi-sourcing system including broad network<br />
of primary casthouses, stand-alone remelters, and partly<br />
owned primary sources<br />
• Flexible sourcing system enabling significant, rapid and<br />
cost effective volume adjustments<br />
• Growing market position in US and Asia through Qatalum<br />
volumes<br />
• Commercial expertise and risk management competence<br />
enabling us to secure manufacturing margins<br />
European supply network<br />
Primary casthouse<br />
Remelter<br />
Part-owned primary source<br />
BusIness DesCrIptIon<br />
Metal Markets<br />
35<br />
Remelting<br />
We have a network of nine stand-alone remelt plants that convert<br />
scrap metal and standard ingot into extrusion ingot. We<br />
have six plants in Europe, one in Taiwan and two in the U.S.<br />
with a total capacity of about 0.6 million mt including roughly<br />
0.4 million mt in Europe. Our facilities in Europe are located<br />
in Luxembourg, the United Kingdom, Germany, Spain and<br />
france. Total remelt activity, including remelted metal from<br />
casthouses integrated with our primary metal plants and thirdparty<br />
sourcing, normally represents about half of our total<br />
sales of metal each year. In addition to remelting scrap returned<br />
from customers, we purchase clean scrap and end-of-life scrap<br />
from third parties. Standard ingot is procured globally under a<br />
combination of short and long-term contracts.<br />
1) Aluminium standard ingot is a global aluminium product traded on the London Metal Exchange (LME).<br />
2) Currency effects are comprised of the effects of changes in currency rates on sales and purchase contracts denominated in foreign currencies (mainly U.S.<br />
dollars and Euro for our Norwegian operations) and the effects of changes in currency rates on the fair market valuation of dollar denominated derivative<br />
contracts (including LME futures) and inventories mainly translated to Norwegian kroner. These amounts can be very substantial. <strong>Hydro</strong> manages its external<br />
currency exposure on a consolidated basis in order to take advantage of offsetting positions.<br />
3) Ingot inventory valuation effects are comprised of hedging gains and losses relating to standard ingot inventories in our metal sourcing and trading operations.<br />
Increasing LME prices result in unrealized hedging losses, while the offsetting gains on physical inventories are not recognized until realized. In periods of<br />
declining prices, unrealized hedging gains are offset by write-downs of physical inventories.
36<br />
BusIness DesCrIptIon<br />
Rolled Products<br />
Sourcing and trading<br />
To supplement our own equity standard ingot production, we<br />
source standard ingot for remelting in <strong>Hydro</strong>’s remelters and<br />
primary casthouses from third parties. Third-party contracts<br />
are also executed in order to optimize our total portfolio position<br />
and to reduce logistics costs. We also sell standard ingot to<br />
external customers.<br />
Our main hedging objectives are to secure margins in our midstream<br />
and downstream businesses, and to obtain the prevailing<br />
average LME price for our smelting system. Our sourcing<br />
and trading operation acts as an internal broker for all LMEhedging<br />
transactions by our business units in order to consolidate<br />
our exposure positions, reduce transaction costs and<br />
utilize our trading knowledge and expertise. 4)<br />
Markets, products and customers<br />
Most of our aluminium is sold in the form of value-added<br />
casthouse products such as extrusion ingot, sheet ingot, wire<br />
rod and foundry alloys. Our product with the highest volume<br />
is extrusion ingot, which is sold to extruders producing aluminium<br />
profiles. The most important end-use segments<br />
include the building and construction industry, transport and<br />
general engineering. Our key market region for extrusion<br />
ingot is Europe, followed by the U.S. and Asia. With the<br />
ramp-up of Qatalum, the Asian and U.S. markets will become<br />
increasingly important to <strong>Hydro</strong>.<br />
foundry alloys, our second-largest product in terms of sales<br />
volume, are sold to foundries producing cast parts primarily<br />
for the automotive industry. Our largest market for primary<br />
foundry alloys is Europe, but Asia is becoming increasingly<br />
important. Sheet ingot is sold to European rolling mills, with<br />
packaging and transportation as the most important end-use<br />
segments. Wire rod is sold to wire and cable mills in Europe<br />
for power transmission and other electrical applications.<br />
We also produce and sell high purity aluminium products and<br />
other specialty products, mainly used in the electronics industry<br />
in products like electrolytic capacitors, semi-conductors and flatpanel<br />
displays, as well as in aviation and aerospace applications.<br />
In addition to marketing our own products, we have commercial<br />
agreements to market products from part-owned smelters<br />
including a full marketing responsibility for all of the casthouse<br />
production at the smelter in Qatar.<br />
Our regional market teams are key to our customer approach,<br />
delivering commercial, technical, logistical and scrap conversion<br />
services. Optimized solutions such as our customer service<br />
programs and online customer portal add further value<br />
and help build and reinforce customer relationships.<br />
Rolled Products<br />
Industry overview<br />
The aluminium rolled products industry is characterized by<br />
economies of scale, with significant capital investments<br />
required to achieve and maintain technological capabilities<br />
and to meet demanding customer qualification standards. Service<br />
and efficiency demands from large customers have encouraged<br />
consolidation among suppliers. Worldwide consumption<br />
amounted to approximately 19.7 million mt in 2011. China<br />
has become the single most important market, representing<br />
roughly 30 percent of global consumption. North America,<br />
Europe and the remaining regions account for roughly 23 percent<br />
each. In Western Europe, the five largest producers represent<br />
about 80 percent of the market. In general, a certain level<br />
of overcapacity prevails in the Chinese, Western European and<br />
North American markets.<br />
Strategy and targets<br />
Securing increasing returns for our Rolled Products business<br />
operations continues to be our key priority. We will focus on<br />
managing our margins while maintaining market share, as we<br />
continue to emphasize product development in close cooperation<br />
with our customers, resulting in more high-grade products.<br />
Key priorities will be continuous cost reduction and the<br />
2011 targets<br />
• Further HSE improvement to secure safe operations<br />
• Margin development for non-contracted volumes above<br />
2010 levels<br />
• Product optimization program implemented at focus plants<br />
• Increased cost efficiency compared to 2010 achievements<br />
• Operational performance improvements from ramp-up of<br />
Rolled Products Business System<br />
2011 results<br />
• Despite high attention, TRI rate on same level as in 2010<br />
• Average margins above 2010 level<br />
• Product optimization program on track in all plants<br />
• Cost per ton higher than 2010, impacted by lower volumes<br />
and somewhat lower labor productivity<br />
• Further improvement in claim rate and delivery reliability<br />
2012 targets<br />
• Further HSE improvement, with focus on high risk areas<br />
• Defend margin level<br />
• Maintain customer focus with further improvement in delivery<br />
reliability and quality<br />
• Finalization of the product optimization program<br />
• Operational performance improvements with focus on<br />
productivity and higher cost efficiency<br />
• Improve inventory turnover rate, strong focus on<br />
counterparty risk<br />
Ambitions going forward<br />
We are committed to safety and to eliminating serious accidents<br />
in our operations. We aim to increase the returns of our business,<br />
concentrating on margins, cost efficiency and operational excellence<br />
– supported by the Rolled Products Business System, involving all<br />
employees in continuous improvement. We will stay focused on<br />
innovation and technology to sharpen our competitive edge.<br />
4) These hedging activities which are designed to mitigate cash exposures can generate significant underlying accounting effects partly due to asymmetrical<br />
accounting treatment.
Contribution margin to profit<br />
EUR per ton indexed to 2006 baseline<br />
112%<br />
110%<br />
108%<br />
106%<br />
104%<br />
102%<br />
100%<br />
2007<br />
2008<br />
cost-effective procurement of materials and supplies. We plan to<br />
enhance profitability by differentiation through innovation and<br />
service, optimizing the flexibility inherent in our production<br />
system and focusing on the core assets within our portfolio.<br />
Build on our strong position in Europe<br />
We intend to develop and improve our market share by leveraging<br />
our preferred supplier position and optimizing our margins<br />
through the mix of products that we deliver to the market.<br />
With a focus on our strong position within packaging, general<br />
engineering, lithographic sheet, construction and automotive,<br />
we will continue to emphasize the quality of our products and<br />
services to our customers in order to drive the performance of<br />
our business.<br />
Sustain our cost reductions through<br />
continuous improvement<br />
We will maintain our focus on efficiency throughout our operating<br />
environment through the optimization of shift models,<br />
continuous cost management and the ongoing implementation<br />
of programs such as our Rolled Products Business System<br />
Hot rolling process<br />
2009<br />
2010<br />
Sheet ingot Preheating<br />
2011<br />
Claim rate<br />
Indexed compared to 2006 baseline<br />
100%<br />
80%<br />
60%<br />
40%<br />
20%<br />
0%<br />
2007<br />
2008<br />
BusIness DesCrIptIon<br />
Rolled Products<br />
2009<br />
2010<br />
2011<br />
37<br />
designed to enhance the operational excellence of our system.<br />
We plan to exploit the strengths in our asset base and core<br />
competencies by optimizing production runs and shifting volumes<br />
between plants to obtain optimal product flow.<br />
Operations<br />
The rolling process consists of heating 600 millimeters (mm)<br />
sheet ingot to about 500 degrees Celsius and gradually rolling<br />
it into thicknesses of 3-13 mm for further processing. An alternative<br />
process, continuous casting, converts molten metal<br />
directly into coiled strip, typically 4-8 mm thick. Once cool,<br />
the thinner metal is further processed in cold rolling mills,<br />
producing various types of products including foil, lithographic<br />
sheet, sheet and strip.<br />
Cost and revenue drivers<br />
Rolled products is a margin driven business based on a conversion<br />
price where the LME cost element is passed on to the<br />
customer. Contracts are generally medium term. The cost<br />
structure includes a high proportion of fixed costs, so results<br />
are volume sensitive.<br />
Hot reversing mill Finishing mill<br />
The slabs are preheated before entering the hot reversing mill. The sheets are rolled to the desired thickness in the finishing mill.
38<br />
BusIness DesCrIptIon<br />
Rolled Products<br />
Competitive strengths<br />
• Largest producer in European rolling industry with<br />
estimated 17 percent market share in Europe<br />
• Global reach with 33 percent export for high-end markets,<br />
serving key customers in the Americas, Middle East and<br />
Asia-Pacific<br />
• World class assets including Alunorf, (50 percent) the<br />
world’s largest rolling mill, and Grevenbroich, the world’s<br />
largest multi-product finishing mill<br />
• World leading positions in high-end products foil and<br />
lithographic sheet<br />
Rolling mills<br />
Our flat rolled products operations are primarily located in<br />
Europe, where we generated approximately 74 percent of our<br />
total sales volume in 2011. More than half of our European<br />
production was produced in the Grevenbroich/AluNorf rolling<br />
system in Germany, which is one of the most modern and<br />
efficient rolling operations in the world. Grevenbroich is the<br />
center of our rolled aluminium foil and lithographic sheet<br />
operations. Our plants employ around 4.000 people.<br />
Our production network mainly comprises the so-called “wallto-wall”<br />
processing, including an integrated casthouse combined<br />
with both hot and cold rolling mills. Around 8 percent of our<br />
production is based on a continuous casting process taking place<br />
at the Karmøy plant in Norway and the plant in Malaysia.<br />
Around half of the metal we process is sourced internally,<br />
based on arm’s-length prices related to the LME price and<br />
Plant Country<br />
Business unit<br />
Shipments<br />
in % Key characteristics<br />
Lithography 18 • Largest supplier in the lithographic products market<br />
Packaging and<br />
Building<br />
Automotive, Heat-<br />
Exchanger and<br />
General Engineering<br />
Capacity<br />
(000 mt)<br />
Main<br />
products Key characteristics<br />
sheet ingot premium. External supplies of sheet ingot and<br />
standard ingot amounted to approximately 49 percent of our<br />
total requirements in 2011. In addition, we recycle process<br />
scrap from customers and scrap collected from the market,<br />
together with our own process scrap.<br />
Markets, products and customers<br />
Our ambition is to be the preferred supplier by focusing on quality,<br />
product development and innovative solutions, together with<br />
excellent customer service and overall cost effectiveness. To<br />
ensure a strong market orientation, our sales function is organized<br />
centrally along business lines. This is supported by sales<br />
offices in Europe – in france, the U.K., Spain, Italy, Switzerland,<br />
Poland, Sweden and Denmark – and in Brazil, the U.S. and Singapore<br />
where we optimize market contact and sales potential.<br />
Our rolled products business is organized into three productbased<br />
business units serving the different market segments in<br />
which we operate.<br />
Packaging & Building<br />
Foil: ISO certified, we serve customer needs in the rigid and<br />
semi-rigid packaging industry offering plain and converted<br />
strip and foil in thicknesses ranging from 0.006-0.500 mm.<br />
We provide packaging solutions combining high-quality manufacturing<br />
with innovation, cost effectiveness and sound ecological<br />
characteristics. We also offer a wide range of services<br />
relating to our packaging products in terms of consulting and<br />
technical support. In addition, we are specialists in thin-gauge<br />
foil for flexible packaging, offering foil as thin as 6.0 µm for<br />
Grevenbroich Germany 650 Foil, lithographic sheet, strip • Grevenbroich is the center of our foil and lithographic business<br />
• Supplied by nearby Alunorf hot-rolling mill<br />
Alunorf 50%<br />
• Alunorf is currently the world's largest hot-rolling mill<br />
• 50/50 joint venture with Novelis<br />
• Partly supplied with sheet ingot from nearby Neuss<br />
Rheinwerk smelter<br />
• Newly invested recycling furnace<br />
Hamburg Germany 180 General engineering,<br />
• Integrated casthouse<br />
automotive, heat exchanger • Major upgrade in 2000-2001<br />
Slim Italy 95 General engineering, heat • Integrated casthouse<br />
exchanger, packaging<br />
• New cold-rolling mill and major upgrade of hot-rolling mill in 2005-2006<br />
Karmøy Norway 95 General engineering • Continuous casting<br />
Holmestrand Norway 83 Building, heat exchanger,<br />
general engineering<br />
• Integrated casthouse<br />
AISB Malaysia 30 Foil, general engineering,<br />
packaging<br />
• Continuous casting<br />
42 • Main markets include beverage can, foil packaging and lacquered building products<br />
• Global player with strong lead leadership position in the high value-added liquid packaging market segment<br />
40 • Serving OEMs and their suppliers with strip and sheet for body, component and chassis applications<br />
• Automotive and non-automotive heat-transfer applications<br />
• Genereal engineering products used in building and transportation applications such as trucks
Flat rolled products consumption<br />
Western Europe 2011<br />
Total market 3,650 Kmt<br />
14%<br />
5%<br />
15%<br />
12%<br />
Source: CRU quarterly November 2011<br />
17%<br />
27%<br />
10%<br />
Transport<br />
Building &<br />
construction<br />
Foil stock<br />
Can stock<br />
Packaging<br />
Engineering<br />
Other<br />
the packaging of food and pharmaceuticals as well as for technical<br />
applications, including converted qualities with a variety<br />
of lacquered, laminated and coated finishes. Production of foil<br />
is concentrated in our Grevenbroich rolling mill supplemented<br />
by our operations in Malaysia and Italy. TetraPak, with liquid<br />
packaging, is one of our key customers.<br />
Beverage can: <strong>Hydro</strong> is a major worldwide supplier of body,<br />
end and tab stock in the form of rolled coil for the production<br />
of aluminium beverage cans. Our modern and efficient production<br />
facilities, technical know-how and experienced development<br />
support facilitate the delivery of high-quality materials<br />
to meet the specific requirements of can manufacturers. Our<br />
Grevenbroich plant is dedicated to the production of <strong>Hydro</strong>’s<br />
quality proprietary can-end stock efficiEND®, which promotes<br />
productivity and cost-effective manufacturing. Key customers<br />
include Ball and Crown.<br />
Building (coated): <strong>Hydro</strong> is one of the leading manufacturers<br />
of coated aluminium strip, with many years of experience in<br />
the building market. We offer customers a portfolio of costeffective<br />
solutions from our dedicated production lines in our<br />
Grevenbroich and Holmestrand rolling mills, including product<br />
applications for roller shutters, ceilings, composites and<br />
curtains for windows.<br />
Automotive, Heat Exchanger & General Engineering<br />
General engineering: <strong>Hydro</strong> is a leading supplier of hot and<br />
cold rolled aluminium strip and sheet, offering a comprehensive<br />
range of products tailored to meet the individual requirements<br />
of a variety of applications in the industrial and<br />
consumer products sectors. Examples include coil and sheet<br />
for wholesalers; aluminium coil for transformers and electrical-technical<br />
applications; and coil, sheet and circles for household<br />
applications such as cookware, baking trays and ladders.<br />
We operate modern and efficient manufacturing processes,<br />
offering quality products and extensive technical support.<br />
BusIness DesCrIptIon<br />
Rolled Products<br />
Global flat rolled products consumption 2011<br />
Total market 19,683 Kmt<br />
15%<br />
29%<br />
2% 4%<br />
5%<br />
Source: CRU quarterly November 2011<br />
24%<br />
23 %<br />
Europe<br />
North America<br />
South America<br />
China<br />
Asia Pacific<br />
Africa<br />
Middle East<br />
39<br />
Heat exchanger: Our rolling mills produce a wide variety of<br />
strip and sheet used in the manufacture of heat exchangers for<br />
passenger and commercial vehicles as well as other product<br />
applications. We are the largest supplier in Europe, working<br />
with key customers such as Behr, Denso and Modine to<br />
develop specially adapted alloys and optimized production<br />
techniques to fit their manufacturing processes. Production is<br />
currently being centralized within our Hamburg plant.<br />
Automotive: We are the second-largest supplier of aluminium<br />
sheet and coil to the European automotive market for interior<br />
and exterior vehicle body parts, chassis and component applications.<br />
Key customers include BMW and Daimler, Peugeot<br />
and Porsche. Production is focused within our Grevenbroich<br />
and Hamburg plants.<br />
Lithography<br />
<strong>Hydro</strong> is the leading global supplier of lithographic sheet for<br />
printing plates, a market characterized by demanding requirements<br />
for surface quality, metal characteristics and mechanical<br />
properties. We differentiate our products through innovation,<br />
consistent high quality and extensive service to our customers.<br />
Key customers in this segment include Kodak, fujifilm and<br />
AGfA. Our litho production is concentrated at the Grevenbroich<br />
plant.
40<br />
BusIness DesCrIptIon<br />
Extruded Products<br />
Extruded Products<br />
Industry overview<br />
In Europe, the five largest producers of extruded products represent<br />
about half of the market. The remainder is very fragmented,<br />
with about 220 producers. Imports represent about 9<br />
percent of the total European market. There has been chronic<br />
overcapacity in the extrusion industry in Europe. However,<br />
companies with superior products and services, and competitive<br />
costs, are able to defend margins that lead to sustainable<br />
returns. Most of <strong>Hydro</strong>’s extrusion business falls within this<br />
category. Overcapacity has increased in southern European<br />
markets since the previous economic downturn, resulting in<br />
stronger competition in Europe in general during 2011. further<br />
restructuring is expected due to margin pressure and a<br />
weak demand outlook for building and construction, an<br />
important segment within the European industry.<br />
The North American extrusion industry is somewhat more<br />
consolidated than the European industry. Today, the four largest<br />
producers represent about 50 percent of the market, while<br />
another five medium-sized producers cover about 15 percent<br />
of the market. In 2011, around 10 percent of the market was<br />
supplied by imports, down from around 20 percent in 2010.<br />
The imposition of anti-dumping and countervailing duties on<br />
extruded products from China has had a substantial impact on<br />
the market penetration of Chinese extruders. Despite this and<br />
the market exit of over 25 extruders during the previous economic<br />
downturn, margins remain under pressure due to overcapacity<br />
and cyclically weak demand. further restructuring<br />
could occur.<br />
Brazil represents over half of the South American extrusion<br />
market, followed by Argentina. The market is immature and<br />
the consumption of extruded products is relatively low. There<br />
are many small operators, however, four of the largest suppliers<br />
cover more than 50 percent of the market volume.<br />
The European building systems industry remains fragmented,<br />
with five large producers and a significant number of smaller<br />
Extrusion margins indexed<br />
Margins<br />
40-60% above<br />
Margin Standards Margin <strong>Hydro</strong><br />
100<br />
80<br />
60<br />
40<br />
20<br />
operators that serve regional markets. Overcapacity in southern<br />
Europe and the U.K., due to the sharp decline in the construction<br />
market, has resulted in increasing competition.<br />
Precision tubing is a global business, mainly focused on heat<br />
transfer applications for the automotive market such as air<br />
conditioning and refrigeration systems. Non-automotive<br />
applications are growing in importance, supported by increasing<br />
substitution of aluminium for copper. The industry is relatively<br />
fragmented, with about 15 key producers covering a<br />
substantial share of the total market.<br />
Strategy and targets<br />
Continuous improvements to increase our productivity and<br />
reduce our costs will be a key priority in the coming year for<br />
Extruded Products together with significant cost reductions<br />
for our Building Systems operations. Margin management<br />
continues to be a key focus area to secure profitability. We also<br />
intend to secure our leading position in Europe and our strong<br />
position in the U.S. while expanding our business in key<br />
emerging markets including Brazil and China.<br />
Improve the profitability of our building<br />
systems operations<br />
following a continued market decline we are aiming for significant<br />
cost reductions for our Building Systems operations.<br />
We will maintain our efforts to turnaround our activities in<br />
southern Europe as we work towards a leaner organization and<br />
securing significant reductions in operating costs.<br />
Capture opportunities in an uncertain<br />
market environment<br />
While keeping a sharp eye on costs, we will focus on protecting<br />
our margins to ensure an attractive level of profitability.<br />
We will actively pursue opportunities to further increase our<br />
share of the market by offering superior value and targeting<br />
advanced market segments. Maintaining a lean level of operating<br />
capital will also be a strategic focus, together with the careful<br />
follow-up of our counterparty risk.<br />
NOC days indexed<br />
FY 2009 FY 2010 FY 2011
Build on the high performance of<br />
our European operations<br />
We intend to improve operational performance, and target further<br />
business development, based on our existing platform of<br />
technological strength and strong market positions in Europe. We<br />
will continue to work closely with our customers to ensure top<br />
product innovation and design as well as excellent service levels.<br />
Going forward, we aim to capitalize on our strong building systems<br />
brands – Wicona, Domal/Alumafel and Technal – each of<br />
which represents distinct value propositions to customers.<br />
Selective growth of our strong performers,<br />
especially in emerging markets<br />
We will continue to grow our high-performance businesses.<br />
Entry into new markets will be a priority and we intend to be<br />
recognized as an industry specialist in energy-neutral building<br />
solutions. We will also prioritize investments designed to<br />
ensure stable operations and good safety standards, and which<br />
maintain the value of our assets.<br />
Operations<br />
The extrusion process involves pressing preheated metal (450-<br />
500 degrees Celsius) under high pressure (1,600-6,500 tons)<br />
through a die which forms the metal into the desired shape.<br />
Dies come in thousands of shapes, sizes and levels of complexity.<br />
Surface treatments such as anodizing, powder coating, lacquering<br />
and various mechanical treatments, like grinding and<br />
The extrusion process<br />
The ingots are preheated, extruded through a die and hardened before surface treatment.<br />
BusIness DesCrIptIon<br />
Extruded Products<br />
2011 targets<br />
• Safe operations with a return to trend of continual reductions in<br />
TRI rate<br />
• Grow volumes and reinforce leading position in Europe<br />
• Execute further rationalization in European operations<br />
• Execute growth projects in emerging markets<br />
2011 results<br />
• TRI reduction lower than target despite high attention<br />
• Increased overall volumes within a challenging market<br />
environment<br />
• Significant cost cutting measures implemented in southern<br />
Europe and Scandinavia<br />
• Preparation for ramp up of growth investments in China and<br />
Brazil in place<br />
2012 targets<br />
• Safe operation with continued focus on TRI reduction<br />
• Successful implementation of cost improvement program<br />
• Improve overall cost effectiveness compared to 2011<br />
• Further development of differentiation strategy and strengthen<br />
basis for premium prices<br />
• Capture growth opportunities, especially in emerging markets<br />
Ambitions going forward<br />
Our goal is to remain the clear performance leader in Europe’s<br />
extrusion-based industries, including building systems, reinforcing<br />
our leadership position through selective growth and further<br />
development of new high-performing solutions. We focus on<br />
innovation and technology to sharpen our competitive edge. We<br />
are committed to safety and to eliminating serious accidents in our<br />
operations. We will actively adjust capacity in markets with insufficient<br />
demand. We intend to further expand in emerging markets to grow<br />
our business and improve the profitability of our operations.<br />
41
42<br />
BusIness DesCrIptIon<br />
Extruded Products<br />
polishing, are employed to reduce corrosion and mechanical<br />
wear or provide decorative appearance. In addition, extrusions<br />
often go through some form of fabrication activity, like<br />
machining, which includes cutting, drilling and tapping.<br />
Other value-added activities include joining in the form of<br />
welding, adhesive bonding, bolting or riveting.<br />
Cost and revenue drivers<br />
The extruded products business is characterized by mainly<br />
short-term contracts for a large number of small orders from<br />
small to medium size customers. Most products are value<br />
added and produced to order. We sell only a limited amount of<br />
commodity type products.<br />
A strong cost focus and careful attention to margin levels are<br />
critical success factors. Results are volume sensitive, however,<br />
production volume is flexible through adjustments to operating<br />
shifts and contract labor.<br />
Competitive strengths<br />
• More than 40 locations in 19 countries, enabling us to be<br />
close to our customers with a strong regional presence<br />
• Leading market position in Europe in general extrusions and<br />
building systems focusing on energy-efficient building solutions<br />
• Strong position in the U.S. and Brazil<br />
• Global leader in heat transfer product applications within<br />
our precision tubing business<br />
Extrusion operations<br />
Our extrusion operations consist mainly of general soft alloy<br />
extruded products and building systems for a diverse customer<br />
base within the transportation, building, electrical and engineering<br />
market sectors. Our major extrusion and extrusionrelated<br />
fabrication and building systems operations are located<br />
throughout Europe and in North America. We also have a<br />
solid foothold in South America, and are developing new<br />
extrusion capacity in Brazil and China where we are targeting<br />
growth in these key emerging markets.<br />
Sector Headquarter Sites Employees Key Characteristics<br />
Our general extrusion activities are organized into three geographic<br />
business sectors – Extrusion Eurasia, Extrusion North<br />
America and Extrusion South America. Our Building Systems<br />
and Precision Tubing operations are organized as separate<br />
business sectors.<br />
Markets, products and customers<br />
General extrusions<br />
We sell high-quality, custom made extrusion profiles to customers<br />
in most industries. About half of our products go to the<br />
building and construction markets, with the remainder split<br />
evenly between transportation and consumer/other market<br />
segments. We do not focus on low margin, standard profiles.<br />
Our local extruders work closely with customers, tailoring aluminium<br />
profiles and providing supporting services that enable<br />
them to manufacture and distribute quality products.<br />
A key success factor for our European extrusion business is an<br />
extensive network of smaller, relatively independent extrusion<br />
plants, ensuring good market alignment and close contact<br />
with customers. At the same time, we actively benchmark<br />
across our operations, applying best practices with a framework<br />
of continuous improvement to ensure the efficiency of<br />
our manufacturing operations. Many of the plants in our system<br />
are characterized by modern equipment and advanced<br />
technology. We also have significant competence and experience<br />
in fabrication and surface treatment.<br />
In the U.S., we serve highly diverse markets and provide a<br />
wide range of end-use products. We focus on serving customers<br />
and segments where close integration and special services<br />
create additional value, and have a particular competence in<br />
complex fabrication and assembly services.<br />
In South America, we have differentiated our products in terms of<br />
quality, service and selection, in particular within the building and<br />
construction market segment. This has enabled us to improve our<br />
margins by offering greater value to our customers.<br />
Extrusion Eurasia Lausanne 33 3 400 • 33 Locations including sales offices<br />
• 19 Extrusion plants in 11 European countries including<br />
Austria, Belgium, Denmark, France Germany, Italy,<br />
Norway, Portugal, Poland, Spain and U.K.<br />
• Eight sites dedicated to die production or fabrication<br />
Extrusion North America Baltimore, Maryland 8 1 350 • Sites in Midwest (4), southeast (2) and western part of the<br />
U.S. (1)<br />
• Fabrication facility in Mexico<br />
Extrusion South America 2 500 • Third largest extruder in South America<br />
• Plants in Argentina and Brazil<br />
Building Systems Lausanne 145 2 650 • Designs and delivers solutions for aluminium building<br />
applications<br />
• European based with 140 locations<br />
• Three locations in Asia and two in the Americas<br />
• Operations include sales, technical support, distribution<br />
and other services<br />
Precision Tubing Lausanne 8 1 350 • Specializes in products used in heat transfer applications<br />
for automotive and industrial customers<br />
• Global producer with production in Belgium, Brazil, China,<br />
Denmark, Germany, Mexico, U.K. and U.S.
European extrusion consumption (total 3,030 Kmt)<br />
By end-use<br />
6%<br />
6%<br />
13%<br />
6%<br />
49%<br />
Source: CRU January 2012, Estimate 2011<br />
19%<br />
Transport<br />
Construction<br />
(incl. solar sector)<br />
Electrical<br />
Consumer durables<br />
Machinery &<br />
Equipment<br />
Other<br />
Building systems<br />
We offer extensive geographic coverage and superior products in<br />
a European market that favors solutions linked to regional<br />
building habits and local culture. Each of our brands – Technal,<br />
Wicona and Domal/Alumafel – represents a distinct system that<br />
permit our customers to tailor offerings to their market needs,<br />
ranging from single window replacements to the complete<br />
facades for major structures such as new airports and high-rise<br />
buildings. Our solutions enable attractive designs, with a variety<br />
of functional characteristics, while efficient distribution and<br />
logistics operations ensure quick and accurate deliveries.<br />
We are at the forefront of development within energy-neutral<br />
buildings, including buildings that produce more energy than<br />
they consume. We have research centers in france, Germany,<br />
India, Italy and Spain, and have participated in the design and<br />
construction of several showcase and commercial buildings.<br />
We are a market leader within this segment, a position recognized<br />
through industry awards at BAU 2011 and the INTER-<br />
SOLAR Trade fair 2010, both in Germany, and at BATIMAT<br />
2011 in Paris.<br />
precision tubing<br />
We produce and sell products used in heat transfer applications,<br />
mainly for the automotive market, which represents<br />
about 75 percent of the total market segment. We are also<br />
active in the general heat transfer applications, a growing market<br />
segment, and applications for transporting liquids and<br />
gases. We operate globally and have leading market positions<br />
in Europe, North America and South America, and a smaller,<br />
developing market position in Asia.<br />
Key customers for products such as air conditioning and cooling<br />
systems, radiators, heat pumps, charge air coolers, transmission<br />
oil coolers and evaporators include volkswagen,<br />
Denso, BMW, Delphi, TI, valeo, Hutchinson, visteon, Parker<br />
and Behr.<br />
BusIness DesCrIptIon<br />
Energy<br />
43<br />
European extrusion consumption (total 3,030 Kmt)<br />
By region<br />
31% 36%<br />
5%<br />
12% 11%<br />
6%<br />
Source: CRU January 2012, Estimate 2011<br />
Germany<br />
Italy<br />
Spain<br />
France<br />
U.K.<br />
Other Western<br />
Europe<br />
Energy<br />
Industry overview<br />
There has been a common Nordic electricity market since the<br />
late 1990s. In 2011, the mix of power generation was comprised<br />
of hydropower (54 percent), nuclear power (22 percent)<br />
and other sources, mainly thermal power (24 percent). Power<br />
generation in Norway is almost entirely based on hydropower.<br />
Total annual Nordic consumption is approximately 400 TWh.<br />
The Nordic system price and area prices are set in day-ahead<br />
auctions at the Nord Pool Spot market. These prices provide<br />
the main reference price for financial contracts, mainly traded<br />
at an exchange operated by Nasdaq OMX. There are five price<br />
areas in Norway, two in Denmark and one in finland. A division<br />
of Sweden into four areas in November 2011 has improved<br />
the energy supply to Mid-Norway where <strong>Hydro</strong> has a significant<br />
share of its Norwegian smelter capacity, reducing the tendency<br />
of high area price differentials. The main price drivers<br />
are precipitation, temperature, fuel costs, emission allowance<br />
costs and trading with adjoining markets on the European<br />
continent. variations in hydrological conditions also have<br />
caused significant annual and seasonal price variations<br />
throughout the history of the market.<br />
In April 2009, the EU approved an energy and climate package<br />
aimed at reducing greenhouse gas emissions, increasing the<br />
share of renewable energy and improving energy efficiency, all<br />
by 20 percent, by 2020. Implementation has and will continue<br />
to have a significant influence on energy prices and the energy<br />
and climate policy in all EU/EEA countries.<br />
Emission trading has increased electricity prices by up to 50 percent<br />
in periods with high emission allowance cost in Europe,<br />
including the Nordic market where electricity is predominantly<br />
gene rated by non-emitting sources. Revised EU emission trading<br />
legislation indicates that compensatory measures in the form<br />
of state aid from national governments could be given to
44<br />
BusIness DesCrIptIon<br />
Energy<br />
indu stries exposed to competition from non-EU countries with<br />
less onerous emission policies (carbon leakage). Draft guidelines<br />
were issued by the EU commission in December 2011, and are<br />
expected to be finalized in 2012. Actual compensation for the<br />
period from 2013-2020 depends, however, on implementation<br />
of measures in each EU/EEA country.<br />
A common electricity certificate market for Norway and Sweden<br />
has been established from the beginning of 2012 with the<br />
objective to support the development of new renewable generation<br />
capacity. The certificate system is designed to guarantee<br />
an increase in annual renewable generation in the Norwegian/<br />
Swedish market of almost 26 TWh by 2020.<br />
Strategy and targets<br />
<strong>Hydro</strong> is the second-largest power plant operator in Norway,<br />
with more than 100 years of experience in hydropower production.<br />
We intend to develop the value of our Norwegian<br />
assets and to use our extensive energy competence to secure<br />
competitive energy sources for our global activities. Operational<br />
excellence will continue to be a key priority to secure<br />
cost effective, safe and reliable production.<br />
Develop our captive power capacity<br />
<strong>Hydro</strong>’s hydroelectric, renewable power position ensures access<br />
to energy at predictable costs, reducing exposure to fluctuating<br />
generation fuel and carbon emission costs. Our ambition is to<br />
increase <strong>Hydro</strong>’s share of captive power from renewable<br />
sources, and further explore opportunities within our existing<br />
concession areas in Norway. Securing and increasing the value<br />
of our energy assets is a key priority. Construction of the new<br />
Holsbru and vasstøl power stations is expected to be completed<br />
in 2012 and we are planning further upgrading investments<br />
through 2015.<br />
Value-enhancing power asset management<br />
and operational excellence<br />
We are continuously developing our expertise in optimizing<br />
power production and market operations. Our objective is to<br />
Robust power coverage<br />
Power coverage (%), based on consolidated production in 2011<br />
100%<br />
75%<br />
50%<br />
25%<br />
0%<br />
2011<br />
2013 2015 2017 2019<br />
20<br />
15<br />
minimize the cost of industrial sourcing and maximize the<br />
value of our production assets, including active participation<br />
in power markets. We have made significant cost and safety<br />
improvements in our hydro power plant operations during the<br />
last decade, and we will continue to pursue further performance<br />
improvements. Safe and reliable operations remain<br />
among our top priorities in 2012.<br />
Sourcing competitive energy for our global operations<br />
Access to competitive energy is a major success factor in our<br />
value chain. We have large energy exposures on nearly every<br />
continent. We are engaged in a number of initiatives to identify<br />
and secure competitive energy supplies for <strong>Hydro</strong>’s operations.<br />
We are actively involved in promoting a responsible<br />
energy policy in the regions where we operate.<br />
9.4<br />
(7-11)<br />
10<br />
5<br />
0<br />
2011 targets<br />
• Operational excellence and safe operations<br />
• Realize committed development and upgrade projects within targets<br />
• Value enhancement through optimization using asset flexibility<br />
• Competitive framework conditions and energy sourcing for<br />
aluminium operations<br />
2011 results<br />
• Positive development in operating performance and no<br />
recordable injuries<br />
• Progress as planned on development and upgrade projects<br />
• Strong power portfolio optimization results<br />
• Progress made on securing competitive framework conditions<br />
• Memorandum of understanding entered into for Alouette power<br />
sourcing<br />
2012 targets<br />
• Continued operational excellence and strong focus on safe<br />
operations<br />
• Successful completion of two new power stations<br />
• Continue positive development in the commercial activities<br />
• Competitive energy sourcing for aluminium operations and<br />
development of strategic options in Brazil<br />
Ambitions going forward<br />
Our goal is to develop our equity power position and capitalize on<br />
our energy competence, supporting the sourcing of power to our<br />
operations on a global basis.<br />
Generation and power sourcing<br />
7<br />
TWh<br />
Norway<br />
1-5<br />
1<br />
12.5<br />
Sourcing on<br />
long-term contracts<br />
Normal production<br />
Consumption in<br />
Primary Metal<br />
Contract sales and<br />
concession power<br />
Spot sales
Operations<br />
<strong>Hydro</strong> is a global energy player, purchasing and consuming substantial<br />
quantities of energy for its smelters, rolling mills and<br />
alumina refinery operations. We are the largest privately owned<br />
power producer in Norway, operating 17 hydroelectric power<br />
plants with a total installed capacity of approximately 1,850<br />
MW and annual normal production of 9.4 TWh. 1) We also purchase<br />
around 7 TWh annually under long-term contracts,<br />
mainly with the Norwegian state-owned company, Statkraft.<br />
Cost and revenue drivers<br />
Production volumes and market prices are strongly influenced<br />
by hydrological conditions. Seasonal factors affect both supply<br />
and demand. We have a relatively stable cost base and annual<br />
contribution to underlying EBIT, but with the potential for<br />
large quarterly variations due to volatile spot volumes and prices.<br />
Ownership percent<br />
Rated capacity<br />
(MW) (100%)<br />
Sogn (100 %)<br />
Tyin 374<br />
Skagen 252<br />
Fivlemyr 2<br />
Herva 40<br />
Total Sogn 3.1<br />
Røldal-Suldal Kraft (95.2%)<br />
Middyr 1<br />
Svandalsflona 18<br />
Novle 48<br />
Røldal 160<br />
Suldal I 170<br />
Suldal II 148<br />
Kvanndal 45<br />
Total Røldal-Suldal Kraft 2.8<br />
Telemark (100%) 1)<br />
Frøystul 47<br />
Vemork 2) 204<br />
Såheim 2) 187<br />
Moflåt 29<br />
Mæl 38<br />
Svelgfoss 92<br />
Total Telemark 3.4<br />
Skafså (33%)<br />
Åmdal 2) 21<br />
Osen 2) 15<br />
Skree 2) 7<br />
Gausbu 2) 7<br />
Total Skafså 0.1<br />
BusIness DesCrIptIon<br />
Energy<br />
45<br />
There is potential for optimization of our total power portfolio<br />
in the market and in cooperation with smelters.<br />
Competitive strengths<br />
• Substantial power coverage until 2020<br />
• Substantial captive power 2) through equity hydro power in<br />
Norway and natural gas fired power in Qatar<br />
• High share of renewable energy<br />
• Strong earnings with stable and solid cash generation<br />
Norwegian power assets<br />
Our power plants are located in three main areas – Telemark,<br />
Sogn and Røldal-Suldal – and managed from a common operations<br />
center at Rjukan in Telemark. We also have a 33 percent<br />
interest in Skafså Kraftverk ANS in Telemark.<br />
1) <strong>Annual</strong> hydro power production can vary by as much as 20 percent in either direction, depending on variations in hydrological conditions.<br />
2) Our captive power covers about two thirds of the energy needs of our smelter operations, including Qatalum and the newly acquired Albras smelter in Brazil.<br />
Total 9.4<br />
1) All plants in Telemark are wholly owned except for Svelgfoss, in which <strong>Hydro</strong> owns 70.22 percent.<br />
2) No reversion.<br />
Normal annual<br />
production (TWh)<br />
(<strong>Hydro</strong> share) Key characteristics / concession period<br />
• Total catchment area 761 km 2<br />
• New Tyin power station opened 2004<br />
• Concession expiration Tyin 2051 and Fortun 2057<br />
• Total catchment area 793 km 2<br />
• Concession expiration 2022<br />
• Total catchment area 4 108 km 2<br />
• No reversion except for Frøystul 50% 2044,<br />
Moflåt and Mæl 2049
46<br />
BusIness DesCrIptIon<br />
Regulation and taxation<br />
Solid operational performance<br />
Production cost 2010<br />
NOK/MWh<br />
60<br />
40<br />
20<br />
0<br />
Company <strong>Hydro</strong> Average<br />
In addition to sourcing power for our aluminium operations,<br />
<strong>Hydro</strong> sells about 1 TWh of the electricity related to concession<br />
power obligations to the local communities where the<br />
power plants are located. Power is also sold on existing contracts<br />
to our former petrochemicals business.<br />
We optimize power production daily based on the market outlook<br />
and the hydrological situation within <strong>Hydro</strong>’s water reservoirs.<br />
By utilizing the flexibility of the hydro power plants and<br />
the volatility in the spot market price, <strong>Hydro</strong> aims to realize a<br />
premium above the average spot price. Our total Norwegian<br />
power portfolio, including our own production, is balanced in<br />
the market on the Nord Pool Power Exchange. Spot market<br />
sales vary significantly between dry and wet years, with an<br />
average of 3 TWh, excluding the effects of curtailed smelter<br />
capacity.<br />
In order to secure continued robust production in the Rjukan<br />
area, a significant upgrade project has been initiated, which is<br />
expected to be completed in 2015. In addition, new power<br />
stations at Holsbru (Sogn) and vasstøl (Røldal-Suldal) are<br />
expected to commence operations during 2012, with a combined<br />
installed capacity of 54 MW and a normal annual production<br />
just above 100 GWh.<br />
regulation and taxation<br />
Source: PA Consulting Group Benchmark Study 2010<br />
<strong>Hydro</strong> is subject to a broad range of laws and regulations in the<br />
countries and legal jurisdictions in which we operate. These laws<br />
and regulations impose stringent standards and requirements and<br />
potential liabilities regarding accidents and injuries, the construction<br />
and operation of our plants and facilities, air and water pollutant<br />
emissions, the storage, treatment and discharge of waste<br />
waters, the use and handling of hazardous or toxic materials,<br />
waste disposal practices, and the remediation of environmental<br />
contamination, among other things. We believe we are in material<br />
compliance with currently applicable laws and regulations.<br />
Aluminium – regulation<br />
Environmental matters<br />
<strong>Hydro</strong>’s aluminium operations are subject to a broad range of<br />
environmental laws and regulations in each of the jurisdictions<br />
in which they operate. These laws and regulations, as interpreted<br />
by relevant agencies and the courts, impose increasingly<br />
stringent environmental protection standards regarding,<br />
among other things, air emissions, the storage, treatment and<br />
discharge of waste water, the use and handling of hazardous or<br />
toxic materials, waste disposal practices, and the remediation<br />
of environmental contamination. The costs of complying with<br />
these laws and regulations, including participation in assessments<br />
and remediation of sites, could be significant.<br />
Aluminium production is an energy-intensive process that has<br />
the potential to produce significant environmental emissions,<br />
especially air emissions. Carbon dioxide and perfluorocarbons<br />
(PfCs), both greenhouse gases, are emitted during primary<br />
aluminium production.<br />
In the European Union and other jurisdictions, various protocols<br />
address transboundary pollution controls, including the<br />
reduction in emissions from industrial sources of various toxic<br />
substances such as polyaromatic hydrocarbons, and the control<br />
of pollutants that lead to acidification.<br />
The European Union has a framework of environmental directives<br />
integrated into the Water framework Directive (2000/60/<br />
EC) regarding discharges of dangerous substances to water.<br />
The directive does not, however, set specific emission limit values<br />
for specific pollutants. The implementation of the directive<br />
is done through specific legislation on bathing waters, drinking<br />
water, nitrates in ground and surface waters, and urban<br />
wastewater treatment. Based upon the information currently<br />
available regarding implementation in the Member States and<br />
Norway, <strong>Hydro</strong>’s management does not believe it will have a<br />
material negative impact on its business. The European Union<br />
has also adopted Directive 2008/105/EC on environmental<br />
quality standards in the field of water policy, which sets environmental<br />
quality standards (EQS) for surface waters for a<br />
number of priority substances and priority hazardous substances<br />
(PHS). These standards must be observed from 2015.<br />
Among the substances found on the PHS list are polycyclic<br />
aromatic hydrocarbons, which are sometimes emitted by the<br />
aluminium industry. Any emissions, discharges and losses of<br />
such substances (i.e. PHS) must cease in the EU by 2025.<br />
<strong>Hydro</strong> will develop its own implementation plan to ensure<br />
compliance with the new rules.<br />
<strong>Hydro</strong> has a number of facilities that have been operated for a<br />
number of years or have been acquired after operation by other<br />
entities. Subsurface contamination of soil and groundwater has<br />
been identified at a number of such sites and may require remediation<br />
under the laws of the various jurisdictions in which the<br />
plants are located. <strong>Hydro</strong> has made provisions in its accounts for
expected remediation costs relating to sites where contamination<br />
has been identified that, based on presently known facts, it<br />
believes will be sufficient to cover the cost of remediation under<br />
existing laws. Because of uncertainties inherent in making such<br />
estimates or possible changes to existing legislation, it is possible<br />
that such estimates may prove to be insufficient and will need to<br />
be revised and increased in the future. In addition, contamination<br />
may be determined to exist at additional sites that could<br />
require future expenditures. Therefore, actual costs could be<br />
greater than the amounts reserved.<br />
<strong>Hydro</strong> believes that it is currently in material compliance with<br />
the various environmental regulatory and permitting systems<br />
that affect its facilities. However, the effect of new or changed<br />
laws or regulations or permit requirements, or changes in the<br />
ways that such laws, regulations or permit requirements are<br />
administered, interpreted or enforced, cannot always be accurately<br />
predicted.<br />
Integrated pollution prevention and control<br />
Under the EU Directive on Integrated Pollution Prevention<br />
and Control 1996/61/EC (the “IPPC Directive”), industrial<br />
installations require national operating permits based on best<br />
available techniques (BAT) for pollution prevention and control.<br />
The European Commission has issued a guidance document<br />
relevant for the aluminium industry: Best Practice<br />
Reference (BREf) for the Non-ferrous Metals Industries<br />
(2001). In 2000, the Norwegian authorities established stricter<br />
emission limits for the aluminium industry in Norway from<br />
January 1, 2007, in line with the IPPC Directive. <strong>Hydro</strong>’s aluminium<br />
production facilities comply with the new requirements.<br />
The IPPC Directive has been amended by Directive<br />
2010/75/EU on Industrial Emissions (IED), while the related<br />
BREf note is in the process of being revised at the European<br />
level. The new IED requirements will be applicable from<br />
2013. We expect <strong>Hydro</strong> to be in a position to comply with the<br />
new rules.<br />
Climate gases<br />
The EU Emissions Trading Directive 2003/87/EC (the ETS<br />
Directive) establishes a scheme for trading greenhouse gas<br />
emission allowances. The directive establishes an internal emission<br />
trading system (ETS) in CO 2 emission allowances for the<br />
period 2005-2012. During this period, the aluminium industry<br />
has not been included in the emission-trading directive,<br />
but has been exposed to the EU emission-trading system<br />
through the effects of the law on the power generation industry<br />
and the resulting increase in power prices (“indirect<br />
effects”). The implementation of the ETS Directive in Germany,<br />
which resulted in a major pass-through of CO 2 allowance<br />
prices by producers to customers, has led to significant<br />
increases in the cost of electricity, which again have necessitated<br />
restructuring throughout Germany’s aluminium industry.<br />
This EU Directive is also relevant for the EEA, and Norway<br />
joined the EU ETS in 2008.<br />
BusIness DesCrIptIon<br />
Regulation and taxation<br />
47<br />
In April 2009, the European Union adopted a new law amending<br />
these rules (Directive 2009/29/EC) to include primary and<br />
secondary aluminium production where combustion units have<br />
a total rated thermal input exceeding 20 MW in the ETS for the<br />
period from 2013-2020 for the direct emissions of CO 2 and<br />
PfC gases from aluminium plants. Aluminium production is<br />
qualified as an industrial sector exposed to a high risk of “carbon<br />
leakage” (i.e. risk of European operations losing market share to<br />
less carbon-efficient installations outside the EU).<br />
This means aluminium producers would, in principle, receive<br />
a high percentage of the emission allowances they need free of<br />
charge (100 percent free allocation for smelters operating at<br />
the EU-agreed benchmark value). The free allocation of emission<br />
allowances is agreed until 2020, but the list of sectors<br />
exposed to the risk of carbon leakage will be amended in 2014.<br />
<strong>Hydro</strong> expects to meet the benchmark values by 2013, so the<br />
financial impact of these regulations should be limited.<br />
Rolling operations are also covered by the new rules and will<br />
be allocated allowances free of charge based on a green house<br />
gas efficiency benchmark. <strong>Hydro</strong>’s extrusion operations are not<br />
covered by the ETS directive, except for their remelting activities,<br />
where <strong>Hydro</strong> expects to be close to, or within, the benchmark<br />
values by 2013.<br />
Even more important for the aluminium industry are provisions<br />
allowing Member States to grant financial compensation for the<br />
increase in electricity prices due to ETS implementation, while<br />
observing EU state aid rules. These rules are in the process of<br />
being amended, and draft amended EU Guidelines for Environmental<br />
State Aid were issued by the EU Commission in December<br />
2011, and are expected to be finalized early in 2012. The<br />
amended guidelines could be used by Member States for providing<br />
compensation from 2013 onwards. At this point in time,<br />
however, <strong>Hydro</strong> cannot estimate the level of such compensation<br />
in the various jurisdictions it operates in the EEA.<br />
EU aluminium tariffs<br />
In 2007, the EU reduced the import duty on non-EU imports<br />
of primary unalloyed aluminium from 6 percent to 3 percent.<br />
Aluminium metal produced in the EEA is exempt from such<br />
duty. The level of import duty for unworked, unalloyed aluminium<br />
has been reviewed in 2010, and the tariff level has<br />
been kept at 3 percent.<br />
The World Trade Organization (WTO) round of negotiations on<br />
tariff and non-tariff barriers on industrial products may ultimately<br />
lead to further reduction, and perhaps elimination, of aluminium<br />
tariffs. Nevertheless, the WTO negotiations are not expected to<br />
have a substantial impact on <strong>Hydro</strong> in the near future.<br />
In the absence of a WTO multilateral trade agreement, the EU<br />
has been negotiating bilateral free-trade agreements with various<br />
third countries of interest to <strong>Hydro</strong>, which will, in time,
48<br />
BusIness DesCrIptIon<br />
Regulation and taxation<br />
lead to the suspension of aluminium tariffs with such third<br />
countries.<br />
Chemicals legislation – REACH<br />
The European Union Regulation (EC) No. 1907/2006 concerning<br />
the Registration, Evaluation, Authorization and<br />
Restriction of Chemicals (known as “REACH”) was adopted<br />
in late 2006 and entered into force in the EU on June 1, 2007.<br />
Aluminium is covered by this regulation and the regulation<br />
has also been applicable in Norway since June 2008 through<br />
the EEA agreement.<br />
The main aim of REACH is to protect European citizens and<br />
the environment from exposure to hazardous chemicals. This<br />
will be achieved by requiring producers and importers of<br />
chemicals to register them formally and to evaluate their health<br />
and safety impacts. In some cases, REACH may require producers<br />
and importers to replace hazardous chemicals with<br />
those of less concern. The registration of chemicals will be a<br />
lengthy process over a number of years, and will be prioritized<br />
by volumes produced.<br />
<strong>Hydro</strong> is on track to implement REACH, having successfully<br />
completed the first stage in the legal process, i.e. the full registration<br />
of substances produced and/or imported above 1,000<br />
metric tons/year by the legal deadline of November 30, 2010.<br />
The next step in the implementation of REACH is the registration<br />
of substances produced and/or imported in volumes<br />
above 100 metric tons/year by June 1, 2013.<br />
Energy – regulation and taxation<br />
The Norwegian regulatory system<br />
for hydropower production<br />
The ownership and utilization of Norwegian waterfalls for i.e.<br />
hydropower production, other than small-scale power production,<br />
requires a concession from the Ministry of Oil and<br />
Energy. According to new legislation passed in 2008, new concessions<br />
may no longer be granted to private entities such as<br />
<strong>Hydro</strong>. Moreover, private entities may not acquire nor own<br />
more than one-third of the shares in companies that own<br />
hydropower plants.<br />
Our waterfall rights and hydropower plants in Norway were<br />
acquired and developed under previous legislation that allowed<br />
for private ownership. Approximately one-third of our normal<br />
annual production in Norway – about 3 TWh per year – was<br />
acquired before concession laws were enacted and does not<br />
contain any compulsory reversion to the Norwegian state.<br />
About two-thirds of our normal annual production, or 6 TWh<br />
per year, are subject to concessions granted at the time the<br />
waterfall rights were acquired. Such power plants operate<br />
under concession terms of Norwegian state reversion, with<br />
individual concessions expiring in two main parts around<br />
2022 and 2050. <strong>Hydro</strong>’s power plants at Røldal-Suldal, with a<br />
normal annual production of 2.8 TWh, will be the first significant<br />
production facilities to revert to the Norwegian state<br />
towards the end of 2022. Reversion to the Norwegian state can<br />
be avoided if the power plants, or two-thirds or more of the<br />
shares of the entity that owns the power plants, are sold to a<br />
public entity prior to reversion.<br />
Under the new legislation, private entities like <strong>Hydro</strong> may be<br />
granted a concession to lease a waterfall for up to 15 years.<br />
Taxation of hydropower production<br />
in Norway<br />
Profits from <strong>Hydro</strong>’s hydropower production in Norway are<br />
subject to ordinary income tax, currently 28 percent. Revenue<br />
for ordinary income tax purposes is based on realized prices.<br />
Dams, tunnels and power stations are, for tax purposes, depreciated<br />
on a linear basis over 67 years, and machinery and generators<br />
over 40 years. However, such fixed assets are depreciated<br />
over the concession period if that is shorter. Transmission and<br />
other electrical equipment are depreciated at a 5 percent<br />
declining balance.<br />
A natural resource tax of NOK 13 per MWh is currently levied<br />
on water-generated electricity. The tax is fully deductible from<br />
the ordinary income tax.<br />
In addition, a special resource rent tax, currently at 30 percent,<br />
is imposed on hydropower production in Norway. Unlike the<br />
ordinary income tax, financial costs are not deductible against<br />
the basis for the resource rent tax. Uplift is a special deduction<br />
in the net income, computed as a percentage of the average tax<br />
basis of fixed assets (including intangible assets and goodwill)<br />
for the income year. The percentage, which is determined<br />
annually by the Ministry of finance, essentially provides for a<br />
certain return on fixed assets above which income becomes<br />
subject to the resource rent tax. The percentage used to calculate<br />
the uplift for 2011 was 2.1 percent.<br />
Revenue for resource rent tax is, with certain exceptions, calculated<br />
based on the plant’s hourly production, multiplied by the<br />
area spot price in the corresponding hour. However, revenues<br />
from sales under certain long-term contracts are valued at contract<br />
price, and power supplied to <strong>Hydro</strong>’s own industrial production<br />
facilities is valued at the price in the so-called<br />
“Statkraft’s 1976 contracts” for tax purposes, which for 2011,<br />
was 246.46 NOK/MWh. As most of <strong>Hydro</strong>’s hydropower<br />
production is used for our own industrial production or sold<br />
under qualifying contracts, only a minor portion of our production<br />
has been subject to spot-price taxation.<br />
other information<br />
As a public limited company organized under Norwegian law,<br />
<strong>Hydro</strong> is subject to the provisions of the Norwegian Public Limited<br />
Companies Act. Our principal executive offices are located at<br />
Drammensveien 260, vækerø, N-0240 Oslo, Norway; telephone<br />
number: +47 2253 8100. <strong>Hydro</strong>’s internet site is www.hydro.com
Direct greenhouse gas emissions from <strong>Hydro</strong>’s<br />
consolidated activities<br />
Million metric tons CO2e<br />
10<br />
8<br />
6<br />
4<br />
2<br />
0<br />
CO2<br />
2007<br />
PFC<br />
2008<br />
2009<br />
Figures include historical emissions from current operations.<br />
2010<br />
2011<br />
vIABIlItY perForMAnCe<br />
Edit... Index<br />
49<br />
02:<br />
Viability performance<br />
viability – The <strong>Hydro</strong> Way p.50<br />
Energy and climate change p.50<br />
Resource management p.53<br />
Integrity and human rights p.56<br />
Community impact p.59<br />
Organization and<br />
work environment p.62<br />
Innovation p.67<br />
About the reporting p.70<br />
Auditor’s report p.72<br />
facts and figures p.74<br />
GRI index p.80<br />
UN Global Compact<br />
Communication on Progress p.80<br />
QuICK overvIew<br />
<strong>Hydro</strong>’s mission is to create a more viable society by developing<br />
natural resources and products in innovative and efficient ways.<br />
In our terms, pursuing viability comprises a specific way of bridging<br />
viability and business, and a set of performance areas where we<br />
measure our progress.<br />
We have an integrated approach to our reporting, and our Viability<br />
performance should be seen in context with the other parts of<br />
<strong>Hydro</strong>’s <strong>Annual</strong> <strong>Report</strong> 2011.<br />
Here we first describe The <strong>Hydro</strong> Way, a set of guiding principles<br />
that govern our activities and underpin our approach to viability.<br />
Next, we report on our viability performance in 2011 according to a<br />
set of areas that capture our most important viability issues while<br />
corresponding to generally acknowledged domains of reporting.
50<br />
viability – The <strong>Hydro</strong> way<br />
The <strong>Hydro</strong> Way is our approach to business. It’s an approach<br />
that has lived within <strong>Hydro</strong> since 1905 and has guided our<br />
development over the years.<br />
The <strong>Hydro</strong> Way originates from our company’s identity – our<br />
unique set of characteristics – and constitutes a way of doing<br />
things that differentiates us from other companies.<br />
The <strong>Hydro</strong> Way explains how we run our business through:<br />
• Our mission<br />
• Our values<br />
• Our talents<br />
• Operating model<br />
• Strategic direction<br />
These principles help us set priorities and serve as a reference<br />
point when questions arise. Our mission describes our higher<br />
purpose and is supported by our values and our talents, which<br />
define how we conduct our business:<br />
<strong>Hydro</strong>’s mission is to create a more viable society by developing<br />
natural resources and products in innovative and efficient ways.<br />
In order to ensure a uniform high standard, <strong>Hydro</strong>’s corporate<br />
directives lay down requirements. They are compulsory for all<br />
parts of the organization and build on The <strong>Hydro</strong> Way. The<br />
directives address various issues including strategy and<br />
Talents<br />
vIABIlItY perForMAnCe<br />
Viability – The <strong>Hydro</strong> Way<br />
How<br />
we are<br />
organized<br />
How we<br />
cooperate<br />
Strategic direction<br />
Mission<br />
How<br />
we make<br />
decisions<br />
How we<br />
operate<br />
values<br />
business planning, economy and finance, risk management,<br />
organizational and employee development, health, safety,<br />
security and environment (HSE), as well as ethics and social<br />
responsibility.<br />
We have based our viability reporting on The <strong>Hydro</strong> Way since<br />
2004. This, together with risk analyses and an extensive stakeholder<br />
dialogue, has, over many years, guided us in defining<br />
the main elements that are most material for us to report on:<br />
• Energy and climate change<br />
• Resource management<br />
• Integrity and human rights<br />
• Community impact<br />
• Organization and work environment<br />
• Innovation<br />
The underlying details in the reporting are based on different<br />
reporting frameworks that are important to us, including the<br />
UN Global Compact, Global <strong>Report</strong>ing Initiative (GRI) and<br />
the International Council of Mining and Metals’ 10 Principles.<br />
Based on our annual business planning process and continuous<br />
stakeholder dialogue, we review the details in our reporting. following<br />
the vale transaction in 2011, we have become the owner<br />
of substantial activities in Brazil, including bauxite mining, alumina<br />
refining and primary aluminium production. A consequence<br />
is that more reporting indicators have become relevant<br />
to us including GRI’s Mining and Metals Supplement. Read<br />
more about our reporting principles at page 70.<br />
<strong>Hydro</strong> has been listed on the Dow Jones Sustainability Indexes<br />
(DJSI) each year since the index series started in 1999. We are<br />
also listed on the corresponding UK index, fTSE4Good.<br />
energy and climate change<br />
We have monitored our impact on the environment for several<br />
decades as part of a holistic approach to value creation. Our<br />
climate strategy is an integral part of our overall business strategy,<br />
including reducing the environmental impact of our production<br />
activities as well as taking advantage of business<br />
opportunities by enabling our customers to do the same. Some<br />
of the measures we pursue include:<br />
• Using viable energy sources<br />
• Reducing energy consumption and emissions in<br />
production<br />
• Reducing CO 2 emissions and energy consumption through<br />
the use of our products<br />
• Increasing recycling of aluminium<br />
Renewable energy is our preferred choice. About two-thirds of<br />
the electricity used in our primary aluminium production is<br />
from renewable sources, and we are the second-largest hydropower<br />
producer in Norway with normal production of 9.4<br />
TWh per year. In 2011, we produced 9.6 TWh, see page 92.
The Qatalum aluminium plant, in which we own 50 percent,<br />
came into full production in September 2011. The plant uses<br />
natural gas as its energy source. The International Energy<br />
Agency recognizes natural gas as an important energy source<br />
that can help reduce global temperature increases. In addition,<br />
the use of natural gas in Qatalum is an efficient way of utilizing<br />
local energy sources. In Brazil and Australia, we use power<br />
from the grid. The grid in Brazil is mainly supplied by hydropower,<br />
while the grid in Australia is mainly supplied by coal<br />
power. At Alunorte and Paragominas in Brazil, the main<br />
energy sources are fuel oil, coke and diesel.<br />
The greenhouse gas emissions from <strong>Hydro</strong>’s current consolidated<br />
activities decreased by 5 percent in 2011, compared with<br />
2010. After Qatalum moved into into full production, total<br />
emissions from our ownership equity – including indirect<br />
emissions from electricity generation – increased by 10 percent.<br />
Due to our new assets in Brazil, our direct greenhouse gas<br />
emissions from consolidated activities increased by 4.5 million<br />
metric tons compared to the figures reported in <strong>Hydro</strong>’s annual<br />
report 2010.<br />
In 2009, we revised our goal to a specific direct emission of<br />
1.52 mt CO2e per mt aluminium in 2013. With a performance<br />
of 1.61 mt CO2e per mt aluminium last year excludin<br />
newly aquired Albras, we are approaching this target. The<br />
improvement represents a net annual reduction of more than<br />
200,000 mt CO2e compared to 2009, when the specific emissions<br />
were 1.85 mt CO2e per mt aluminium.<br />
Energy efficiency is an important part of <strong>Hydro</strong>’s 300 USD/<br />
mt cost-saving program (see page 29). On average, our fullyowned<br />
primary aluminium plants consumed 13.79 kWh of<br />
electricity to produce one kilogram of aluminium in 2011, an<br />
improvement of 0.09 kWh/kg aluminium. This equals an<br />
annual energy reduction of more than 80 GWh from 2009.<br />
Our HAL4e technology, which we are testing in full scale, has<br />
Optimizing transportation<br />
As an energy-intensive industry, climate-gas emissions from<br />
the transportation of raw materials and products is estimated to<br />
constitute less than 5 percent of <strong>Hydro</strong>’s total emissions. Still, it is<br />
important to continue reducing these emissions. As an example,<br />
<strong>Hydro</strong>’s rolled products business leverages several concepts<br />
to secure customer-oriented logistics at lower CO 2 emissions<br />
and less cost. One is to use trains or ships for long distances,<br />
trucks for shorter distances. One project (Germany-Spain) has<br />
been calculated to save around 260,000 km driven per year. The<br />
business also uses a multi-drop concept to serve more customers<br />
from one truck and then reverse the logistics, which brings finished<br />
material to the customer and returns with scrap. A similar approach<br />
is used in e.g. <strong>Hydro</strong> Building Systems.<br />
Direct greenhouse gas emissions from <strong>Hydro</strong>’s<br />
consolidated activities<br />
Million metric tons CO2e<br />
10<br />
8<br />
6<br />
4<br />
2<br />
0<br />
CO2<br />
2007<br />
PFC<br />
2008<br />
2009<br />
Greenhouse gas emissions from<br />
<strong>Hydro</strong>'s ownership equity<br />
Million metric tons CO2e<br />
15<br />
12<br />
9<br />
6<br />
3<br />
0<br />
2007<br />
2008<br />
vIABIlItY perForMAnCe<br />
Energy and climate change<br />
Figures include historical emission from current operations.<br />
2009<br />
2010<br />
2010<br />
Bauxite & Alumina Downstream production Electricity generation<br />
Metal production Remelters<br />
2011 target<br />
• Further lift our recycling volume to improve capacity utilization<br />
• Develop new business opportunities within recycling<br />
2011 result<br />
• The electrolysis process of aluminium production emitted 1.61<br />
mt CO2e/mt aluminium, compared to 1.63 mt last year<br />
• Recycling of contaminated and post-consumer scrap increased<br />
by 3 percent<br />
• Feasibility study for recycling facilities carried out in Neuss,<br />
Germany and Karmøy, Norway<br />
2012 target<br />
• Stabilize at above 90 percent capacity utilization in recycling<br />
2011<br />
2011<br />
Ambition<br />
• Aluminium production emits 1.52 mt CO2e/mt aluminium in 2013<br />
• Recycle 1 million metric tons of contaminated and postconsumer<br />
scrap by 2020<br />
51<br />
Greenhouse gas emissions based on <strong>Hydro</strong>’s ownership equity as per December 31,<br />
2011. Emissions from electricity generation are based on electricity consumption<br />
and IEA “CO 2 Emissions from Fuel Consumption” 2008 factors. Emissions include 1.9<br />
million mt CO2e from <strong>Hydro</strong>’s ownership equity in the Qatalum owned gas-fired power<br />
plant in Qatar in 2011 and 0.9 million mt in 2010. Figures includes historical emissions<br />
from current operations.
52<br />
vIABIlItY perForMAnCe<br />
Energy and climate change<br />
Cooperating to save energy<br />
Enova is a Norwegian governmental organization founded to<br />
promote environmentally friendly restructuring of energy generation<br />
and consumption. Enova is co-funding <strong>Hydro</strong> projects to develop<br />
more energy-efficient production processes. These projects are<br />
an important part of <strong>Hydro</strong>’s efforts to reduce specific energy<br />
consumption from new and existing plants. If successful, the<br />
technology could be used outside Norway and, in some cases,<br />
outside <strong>Hydro</strong>. One example is a project to increase heat recovery<br />
in the metallurgical industry. Enova’s support makes it possible to<br />
carry out projects that have a higher business risk than we usually<br />
allow for. In 2011, Enova contributed NOK 3.4 million to <strong>Hydro</strong>, see<br />
also page 69.<br />
achieved an energy consumption of 12.5 kWh per kg aluminium.<br />
We have initiated a program to widely pilot innovative<br />
technology solutions, which when implemented, will<br />
have the potential to reduce the energy consumption for all<br />
our primary metal plants by 200-400 GWh on an annual<br />
basis. These pilots are in the planning process and will be<br />
started in 2012.<br />
We work closely with customers to develop products that save<br />
energy and reduce emissions. Aluminium façades can lead to<br />
lower operating costs and enable buildings to produce as much<br />
energy as they consume during operation. <strong>Hydro</strong> has built<br />
three buildings that aim to be energy neutral during operation.<br />
<strong>Hydro</strong>’s test center in Bellenberg, Germany, produced 9,686<br />
KWh more energy than it used in 2011. This equals a self sufficiency<br />
of 126 percent. See also page 68.<br />
Lighter cars result in fuel savings and lower emissions on the<br />
road, and lighter aluminium products and packaging reduce<br />
transport costs and emissions. Excellent barrier properties<br />
reduce the cooling needs of food products while improving<br />
durability, thus reducing food spoilage. In 2011, <strong>Hydro</strong><br />
became one of 12 sponsors of SAvE fOOD, an initiative from<br />
the United Nations’ food and Agriculture Organization. Our<br />
specific contribution is packaging, in which aluminium helps<br />
to conserve food more effectively so it stays fresh longer with<br />
less cooling and is better protected for transport and storage.<br />
This helps reducing emissions in the food supply chain and in<br />
the consumption of beverages.<br />
We are currently upgrading several of our hydropower plants<br />
in Norway to secure future stable production. The Rjukan<br />
watershed, with a total annual normal production of 3 TWh<br />
from five plants in the Måna river, is the largest upgrade with<br />
an estimated cost above NOK 800 million. The project is<br />
expected to be completed in 2015. We are also working on<br />
increasing the production further within current assets. When<br />
finalized in 2012, the refurbishment of the Holsbru and Herva<br />
plants and construction of the vasstøl plant, will increase the<br />
potential electricity output by 150 GWh per year.<br />
Industry major user of energy<br />
“Climate and energy challenges must be solved largely through<br />
technology development. Innovative solutions must be able<br />
to be implemented on a large scale, by any company, through<br />
both the introduction of new processes and modifications to<br />
existing facilities. <strong>Hydro</strong> currently has a strong commitment to the<br />
development of the core process: what happens in the electrolytic<br />
cells. We see this as commendable, since it is here the bulk of the<br />
energy is consumed and most greenhouse gases are produced.”<br />
Nils Kristian Nakstad,<br />
Chief Executive Officer, Enova<br />
Read full interview at www.hydro.com/reporting2011<br />
We support the development of international frameworks on<br />
climate change and greenhouse gas emissions and participate<br />
actively in organizations such as the World Business Council<br />
for Sustainable Development and the International Emissions<br />
Trading Association, to provide business solutions to climate<br />
change. In addition, we work through aluminium associations<br />
to establish a level playing field globally for aluminium<br />
production.<br />
Remelting and recycling<br />
Aluminium can be recycled over and over again without degradation<br />
in quality. Aluminium recycling requires 95 percent<br />
less energy than primary aluminium production. This makes<br />
aluminium a material for the future. <strong>Hydro</strong> is a large remelter<br />
and recycler of aluminium, with nearly 30 facilities worldwide.<br />
We remelt process scrap from our own production and from<br />
other companies. Our expertise in remelting is a good basis for<br />
further expansion.<br />
Our ambition is to grow faster than the market in recycling and<br />
to take a strong position in this part of the value chain. By 2020,<br />
we aim to recover 1 million metric tons (mt) of contaminated<br />
and post-consumer scrap annually. We have improved utilization<br />
of our existing capacity to almost 100 percent during the<br />
last two years, and are now recycling more than 270,000 mt<br />
annually. Due to curtailments in remelting and recycling capacity,<br />
growth was only about 3 percent compared to 2010. In<br />
total, <strong>Hydro</strong> is remelting and recycling above 2 million mt of<br />
aluminium. Our goal for 2012 is to stabilize at above 90 percent<br />
capacity utilization and to develop specific post-consumed scrap<br />
projects for investment in additional capacity. This will also<br />
improve the carbon footprint of <strong>Hydro</strong>.<br />
In the next phase, we intend to invest in additional recycling<br />
assets to capture scrap volumes generated in our plants and<br />
from plants operated by our partners. One of our goals is to<br />
develop recycling plants that serve internal and external customers<br />
with metal products produced from contaminated<br />
industrial and end-of-life scrap. The previously announced<br />
investment in a recycling plant at Karmøy, Norway was
postponed in 2011 due to the market situation, see also page<br />
59. The development of a recycling center in Neuss, Germany<br />
is continuing as planned.<br />
In Europe, approximately 95 percent of the aluminium in<br />
automotive applications and 96 percent of the aluminium in<br />
commercial buildings is recycled at end-of-life. The recycling<br />
rate for used aluminium cans has continued to grow and is<br />
now above 64 percent for the whole of Europe. The recycling<br />
of other aluminium packaging has increased as well. It is estimated<br />
that at least 55 percent of all used aluminium packaging<br />
in Europe is being recycled today, and further growth, due to<br />
additional collection activities is expected. <strong>Hydro</strong> and our<br />
partners in the market are supporting aluminium packaging<br />
promotions and recycling initiatives throughout Europe. We<br />
team up with producers of beverage cans, drinks and food, and<br />
other interest groups and industries, to develop specific activities<br />
aimed at raising public awareness about the importance of<br />
recycling. See also page 68.<br />
Development in solar energy<br />
<strong>Hydro</strong> produces large volumes of frames and support structures<br />
for solar installations and is involved in all main solar<br />
technology areas:<br />
• Photovoltaics, converting sunlight directly into electricity<br />
• Solar-thermal installations, which use sunlight to heat water<br />
• Concentrated solar power, focusing sunlight using mirrors<br />
and producing high-temperature heat and steam for power<br />
production<br />
The aluminium volumes we have supplied to these segments<br />
have followed the general development in the market.<br />
Through collaboration with partners and our own research<br />
and development work, <strong>Hydro</strong> is providing the solar industry<br />
with aluminium solutions, substituting copper in solar thermal<br />
and replacing glass as reflective material in concentrated<br />
solar power applications. <strong>Hydro</strong> is also providing building<br />
integrated solar solutions. At Intersolar 2011, <strong>Hydro</strong> and the<br />
finnish company Savo Solar won the Innovation Award in the<br />
category solar thermal technology for their “All-aluminium<br />
MPE absorber” entry.<br />
<strong>Hydro</strong> has minority ownership interests in NorSun, which is a<br />
Norwegian supplier of mono-crystalline silicon wafers to manufacturers<br />
of high-efficiency solar cells. In December 2011,<br />
<strong>Hydro</strong> sold its minority share in U.S.-based Ascent Solar.<br />
resource management<br />
In addition to climate change and energy consumption, our<br />
main environmental challenges are related to waste, emissions<br />
and biodiversity. In 2011, <strong>Hydro</strong> acquired bauxite mining and<br />
alumina refining activities in Pará in Brazil. These operations<br />
2011 target<br />
• Establish a new environmental strategy<br />
vIABIlItY perForMAnCe<br />
Resource management<br />
2011 result<br />
• New environmental strategy established<br />
2012 target<br />
• Internal review of reforestation and wildlife program in the<br />
Paragominas mine<br />
• Start implementation of the environmental strategy, including<br />
target setting<br />
Ambition<br />
• Minimize our environmental footprint through the life cycle of our<br />
products. No net loss of biodiversity in our activities.<br />
53<br />
include the handling of significant amounts of tailings and<br />
bauxite residue, also known as red mud. Biodiversity, water<br />
and waste management have thus become a more important<br />
part of our agenda.<br />
<strong>Hydro</strong>’s environmental strategy, which was revised last year,<br />
aims at<br />
• Reducing our environmental footprint<br />
• Helping customers reduce their footprint<br />
• Improving aluminium as a material<br />
In addition to the existing climate strategy and our recycling<br />
strategy, we have decided to prioritize four areas:<br />
• Ecosystems and biodiversity<br />
• Waste and efficient resource use<br />
• Emissions<br />
• Product stewardship<br />
We have established corporate environmental ambitions, and<br />
performance indicators for our production plants. The indicators<br />
vary between plants due to the inherent differences<br />
between, for example, large primary aluminium production<br />
plants and small extrusion plants. They help us measure status<br />
and improvements, and enable us to concentrate on the most<br />
important issues.<br />
Ecosystems and biodiversity<br />
In addition to our mining and alumina refining operations in<br />
Brazil, we have aluminium production plants on four continents.<br />
When developing new projects, we examine environmental<br />
issues ahead of time. The early detection of possible<br />
biodiversity challenges is vital.<br />
<strong>Hydro</strong> estalished its biodiversity policy in 2004. We were a<br />
pioneer in establishing the overall environmental impacts on<br />
the local ecosystems from the operations of our primary aluminium<br />
plants in Norway through the “Effect Study” initiated<br />
in 1990. We have also worked over many years to minimize<br />
the impacts of our hydropower plants in Norway on freshwater<br />
ecosystems.
54<br />
vIABIlItY perForMAnCe<br />
Resource management<br />
See the big picture<br />
“If we assume that it is good to use aluminium – partly because it<br />
is a light metal that impacts the environment less when it is used<br />
than other materials – then it should be acceptable to extract<br />
aluminium’s raw material, bauxite. However, the extraction of<br />
bauxite will often be controversial since it is found mainly in<br />
tropical areas where there are rain forests with rich biodiversity<br />
and extensive carbon storage. The extraction must take place with<br />
great awareness of the responsibilities that it entails, so that the<br />
biological footprint that is left can be as small as possible.”<br />
Peter Johan Schei,<br />
Director, Fridtjof Nansen Institute<br />
Read full interview at www.hydro.com/reporting2011<br />
The ongoing loss of biodiversity and degradation of ecosystems<br />
represent long-term risks for the industry and society at<br />
large. We see a need for more sustainable frameworks and are<br />
participating in several initiatives, including the WBCSD Ecosystem<br />
program. In 2011, <strong>Hydro</strong> became a member of the<br />
International Council of Mining and Metals, which gives us<br />
access to their principles and guidelines on the environment as<br />
well as an arena for sharing best practices.<br />
Through our revised environmental strategy in 2011, we have<br />
established an aspiration toward no net loss of biodiversity.<br />
Land management and reforestation<br />
<strong>Hydro</strong>’s bauxite mining involves removing topsoil and overburden<br />
by machinery to extract the bauxite deposits below.<br />
The overburden at Paragominas is normally 8-to-10 meters<br />
Monitoring and improving<br />
reforestation efforts<br />
<strong>Hydro</strong> has a 5 percent stake in MRN, in Pará in Brazil, and is an<br />
offtaker of 45 percent of its production. The mine is within the<br />
borders of the Saracá-Taquera national forest, which is a part of<br />
the Amazon rain forest. Before starting extraction of bauxite, the<br />
existing vegetation is cleared. Any clearance is subject to approval<br />
from the federal environment authorities ICMbio. Reforestation<br />
starts as soon as a mining area is closed. The company owns the<br />
mining rights to 25,000 hectares, of which 7,000 are so far affected.<br />
Of these, 4,000 hectares have been reforested. The oldest areas<br />
have reached a profile that reminds of the original state. Still, many<br />
more years are needed to reach a level where the flora and fauna<br />
are recovered. Beehives were installed in February 2011 in the<br />
reforested areas older than 10 years, as a means to accelerate this<br />
process. In addition to increased pollination, the beehives provide<br />
extra income to the surrounding communities of traditional Amazon<br />
peoples. The collection of seeds from local species and planting of<br />
the seedlings also are sources of income for the local communities.<br />
The areas are thoroughly surveyed. Since 1997, about 50 Master’s<br />
theses and 25 PhD theses have studied the flora and fauna in the<br />
reforested areas. MRN has used 450 different plant species in total<br />
in the rehabilitation. Today, 120 different species are normally used,<br />
including epiphytes like bromeliads and orchids.<br />
thick. As soon as the bauxite has been extracted from one area,<br />
the overburden and topsoil are refilled and the process for<br />
rehabilitation can begin. Bauxite extraction started in Paragominas<br />
in 2006. The reforestation program started in 2009 and<br />
will continue untill beyond 2040 in the present area. A reclamation<br />
program is established where the landscape is systematically<br />
shaped back to how it looked before mining. The<br />
topsoil is then added and seedlings are planted in a grid in the<br />
areas prepared. The seedlings will establish a forest system of<br />
the same structure as that which is typical in the pristine forest<br />
in the areas. It will still take a few years to acheive a balance<br />
between land impacted by mining operations and land rehabilitated.<br />
The present tailings dams will be full between 2015<br />
and 2020, and work will soon be initiated to optimize the closure<br />
and reforestation of these tailings.<br />
The Paragominas mine is located in what is normally recognized<br />
as the deforestation belt around the central Amazon<br />
River. The mining area has been exposed to selective logging<br />
and clear cutting of forest for development of subsequent pasture<br />
land. In terms of land use, the municipality of Paragominas<br />
has seen, over a period of almost 20 years, more than 30<br />
percent reduction in its forest cover, an increase of 6 percent in<br />
secondary forests and about 20 percent of the area is still pasture.<br />
However, in recent years the municipality has been in the<br />
forefront in Brazil in halting the illegal and uncontrolled<br />
logging.<br />
When bauxite extraction is finalized, rehabilitation is started.<br />
<strong>Hydro</strong>’s Paragominas mine started production in 2006, and<br />
the reforestation program started in 2009. We have identified<br />
improvement potential with regard to reforestation and wildlife<br />
management at Paragominas, and are evaluating possible<br />
adjustments. In total 853 hectares of land was disturbed during<br />
2011 and approximately 4,700 hectares since the start of<br />
the mining operations. In 2011 we rehabilitated 142 hectares,<br />
while about 400 hectars have been rehabilitated in total since<br />
the operations started in 2006.<br />
A reforestation assessment performed by <strong>Hydro</strong> in 2011<br />
reviewed areas close to the mine which have been exposed to<br />
selective logging. The study found that the main structure of<br />
the forest ecosystems was still in place, even though most of<br />
the commercially interesting trees had been logged. We have<br />
identified improvement potential related to reforestation and<br />
wildlife management at Paragominas, and are evaluating possible<br />
adjustments.<br />
<strong>Hydro</strong> has exploration activities in several areas in Brazil. In<br />
connection with such activities, <strong>Hydro</strong> has been alleged to<br />
have been involved in illegal logging in a preservation area in<br />
Minas Gerais, and is under public investigation.<br />
<strong>Hydro</strong>’s minority share in the bauxite mine and alumina refinery<br />
Alpart in Jamaica was sold in September 2011.
Water management<br />
Enough clean water is a challenge in some of the areas where<br />
<strong>Hydro</strong> operates. Local initiatives show that with simple measures,<br />
substantial water savings are achievable. The systematic<br />
mapping of our water situation in 2011 showed that about 3<br />
percent of our overall water input came from water-stressed<br />
areas, with regard to annual renewable water supply (according<br />
to the definition used by WBCSD).<br />
Although the Amazon is recognized for its abundance of water,<br />
we have observed over the last decades that parts of the area<br />
have had repeated droughts. We will therefore carefully address<br />
water as an issue also for our sites in Brazil. Qatalum gets water<br />
from public water works, produced by desalination. Sea water<br />
is used for wet cooling towers at the power plant.<br />
We regularly follow up the impact on aquatic life in rivers near<br />
our hydropower plants. In addition, we are following up a<br />
rehabilitation project of the Måna River in Rjukan, Norway.<br />
In 2011, this included improvement of fish habitats. We will<br />
in 2012 start similar projects in the Årdal river and fortun<br />
river. All projects also include increased accessibility to the riversides<br />
for the local communities.<br />
According to requirements in our hydropower concessions, we<br />
finance operation of two fish nurseries in Sogn in Norway.<br />
Trout are bred every year, and approximately 100,000 fish fries<br />
are stocked in the small lakes in the concession area. This mitigates<br />
the impacts from the regulation of the water going to the<br />
power plants. In the fortun River we also stock salmon fries<br />
every year in order to maintain the population.<br />
Minimizing waste<br />
Our goal is to minimize the amount of waste produced and<br />
then reuse or recycle it. This is beneficial, both environmentally<br />
and economically.<br />
Tailings and bauxite residue<br />
Tailings from bauxite extraction consist of mineral rejects from<br />
the extraction process mixed with water. No chemicals are<br />
added. The tailings at Paragominas are stored in dedicated tailing<br />
ponds, where the particles settle. Separated water is transferred<br />
to a clarification dam before it is reused in the process.<br />
There is a minor run-off to the river downstream of the tailings,<br />
which is required to maintain an ecological flow. The<br />
run-off is monitored, and the water quality meets the requirements<br />
set by the authorities.<br />
The current tailing ponds are reckoned to be full by 2015-<br />
2020. The area will then be reforested. The total production of<br />
tailings in 2011 was 5.9 million metric tons (mt). The Paragominas’<br />
mine produced 8.2 million mt bauxite in 2011.<br />
Bauxite residue, also known as red mud, is a by-product of the<br />
alumina refining process. Alunorte uses the Bayer process,<br />
vIABIlItY perForMAnCe<br />
Resource management<br />
55<br />
which includes the use of caustic soda. The residue is washed<br />
with water to lower the alkalinity and recover caustic soda to<br />
be reused in the process. The residue is dry-stacked, which<br />
means it is transformed into a clay-like solid with a low moisture<br />
content. Alunorte is in the process of reducing the moisture<br />
further through conversion to pressure filtration.<br />
The bauxite residue deposit at Alunorte was extended in 2011.<br />
In total, 6.4 million mt were disposed in 2011. When the<br />
deposits are full, we have a plan for replanting of the area.<br />
Bauxite residue from Alunorte is being tested as a raw material<br />
for bricks and paving stones, but even with an optimistic market<br />
estimate, this production will only use a small fraction of<br />
the total residue. The remaining residue is disposed and<br />
replanted.<br />
After a spillage in 2009 of storm water from the bauxite residue<br />
deposits at Alunorte, corrective actions have been taken,<br />
including strengthening the drainage system and improving<br />
the surveillance of the water treatment facility. A need for better<br />
emergency handling, including information to the local<br />
community, was also identified. There are still legal issues<br />
pending following the incident, such as individual lawsuits<br />
filed by local residents who claim compensation for damages<br />
caused by the spillage. So far all of the claims have been dismissed.<br />
There is also a negotiation in place with the public<br />
prosecutor, who claims compensation for the environmental<br />
damages caused by the spillage. If an agreement is not reached<br />
with the public prosecutor, a class action lawsuit can be filed<br />
against Alunorte in this regard.<br />
Other waste<br />
Spent potlining (SPL) from the reduction cells used in primary<br />
aluminium production is defined as hazardous waste. In<br />
2011, we generated 24,804 metric tons of SPL, which was 29<br />
percent below the amount from 2010. The production of SPL<br />
varies with the relining of smelter cells which is normally done<br />
every 4-7 years for established smelters. New plants will get a<br />
relining peak at the same interval after start-up. We expect an<br />
increase in the SPL production from consolidated smelters in<br />
a couple of years and from part-owned Qatalum some years<br />
later.<br />
Qatalum is aiming at “no-SPL-to-landfill”, together with other<br />
aluminium plants in the Arabian Gulf, with a view to using<br />
SPL in the cement industry.<br />
In 2009, we formalized a cooperation with an external partner<br />
to help identify applications for production waste from our<br />
aluminium plants in Norway. The planned recycling plant at<br />
Karmøy, Norway will also be able to handle dross. The building<br />
of this plant was postponed in 2011, however, due to the<br />
market situation. See also page 59.
56<br />
vIABIlItY perForMAnCe<br />
Integrity and human rights<br />
Spent potlining<br />
Metric tons<br />
60,000<br />
50,000<br />
40,000<br />
30,000<br />
20,000<br />
10,000<br />
0<br />
2007<br />
2008<br />
2009<br />
Figures include historic SPL production from current operations.<br />
2010<br />
2011<br />
The amount of SPL was equal to 15 percent of our amount of<br />
hazardous waste and there are continuous efforts to extend the<br />
life of potlining. In 2011, we established a project to identify a<br />
viable solution for the carbon part of SPL. Our ambition is to<br />
map different industrial processes that can benefit from SPL,<br />
then market it and make it commercially available to e.g. the<br />
cement and mineral wool industries.<br />
Emissions<br />
We have achieved significant emission reductions over the years.<br />
The major achievements are related to greenhouse gases as well<br />
as dust and particle emissions. The closure of our former Søderberg<br />
lines has reduced plant emissions of PAH, greenhouse<br />
gases, dust, particles and fluoride. In the last five years, our emissions<br />
of fluoride and PAH to air, per metric ton of primary aluminium<br />
produced, have decreased by 20 and 66 percent,<br />
respectively. With our new assets in Brazil, <strong>Hydro</strong>’s SO 2 and<br />
NO X emissions have increased significantly. SO 2 emissions were<br />
29,356 mt in 2011, while NO X emissions were 9,037 mt.<br />
The enlargement of the wastewater treatment plant in Grevenbroich,<br />
Germany, initiated in 2010, led in 2011 to reductions<br />
in the chemicals needed in the process and to a clear reduction<br />
in the contaminants charged. As a response to neighborhood<br />
claims regarding odor, we initiated a dialogue with local stakeholders<br />
on a regular basis in the Grevenbroich plant. Measures<br />
were agreed upon and an internal project, “Odor emissions in<br />
Barrenstein”, was set up.<br />
Product stewardship<br />
<strong>Hydro</strong> is in dialogue with customers and other stakeholders<br />
when it comes to the environmental impact of our processes<br />
and products. We perform life-cycle assessments (LCAs) of all<br />
major product groups to identify improvement potential, perform<br />
benchmarking and assist our product developers and<br />
customers regarding environmental footprint considerations.<br />
We also continuously assess other aspects such as energy and<br />
material consumption, toxicity and recyclability.<br />
The big tea light hunt<br />
The big tea light hunt in Norway, arranged by IKEA and WWF with<br />
<strong>Hydro</strong> as one of the partners, is more than about collecting the<br />
aluminium cups from used tea lights for recycling. It is also about<br />
creating good attitudes among the 23,000 six-to-10-year-old pupils<br />
who are participating. And it is about the attitudes the children<br />
demand from their networks – close family, grandparents and<br />
neighbors. By the beginning of 2012, the children had collected<br />
more than 4 million used tea lights.<br />
<strong>Hydro</strong> has entered into cooperation with the Norwegian University<br />
of Science and Technology (NTNU), focusing on the<br />
development of a mass-flow analysis model (MfA), with particular<br />
attention paid to long-term changes in aluminium use<br />
and its implications for the environment.<br />
Over the past two decades, <strong>Hydro</strong> and other aluminium companies<br />
have developed a pan-European network of national<br />
initiatives to promote and recycle aluminium packaging.<br />
Many of these national activities are focusing on education<br />
and have developed projects with primary and secondary<br />
schools, and with universities to stimulate the next generation<br />
to make their contribution to a better environment. The most<br />
recent show case is Romania. Here, <strong>Hydro</strong> and other aluminium<br />
companies launched “Aluminium Can Recycling Romania<br />
– Alucro” together with a can manufacturer. In 2011,<br />
children’s information and education regarding environmental<br />
protection, and saving resources and energy through the recycling<br />
of used aluminium beverage cans, took place in over 100<br />
schools, reaching more than 90,000 pupils.<br />
Human rights, working conditions, integrity and community<br />
impact throughout our value chain is also a part of our product<br />
stewardship approach.<br />
Integrity and human rights<br />
We have zero tolerance of corruption and human rights violations.<br />
If non-conformities are registered, our policy is to demonstrate<br />
openness and learn from negative experiences.<br />
<strong>Hydro</strong>’s overall CSR strategy was reviewed in 2011. The strategy<br />
is built upon four pillars:<br />
• Integrity and anti-corruption<br />
• Community and stakeholder engagement<br />
• Human rights<br />
• Supply chain and product stewardship
The annual business planning process and inclusion of key<br />
performance indicator actions are used to implement the<br />
integrity program as well as other corporate responsibility topics.<br />
Requirements have been drawn up regarding how corporate<br />
responsibility should be taken into account in business<br />
development, investments and during the execution of projects.<br />
In 2011, a mapping tool for non-financial compliance<br />
risk was developed and risks identified for all business areas.<br />
These risks were used as basis for mitigating actions and<br />
included in the business plans for 2012. Risk assessments are<br />
now a part of the quarterly follow-up meetings that are mandatory<br />
for all business areas in <strong>Hydro</strong>.<br />
Employees may report breaches or perceived breaches of<br />
<strong>Hydro</strong>’s requirements through the whistleblower channel. A<br />
small number of cases were reported in 2011, and all cases<br />
were investigated. In two of the incidents investigated by<br />
<strong>Hydro</strong>’s internal audit unit, the investigated persons chose to<br />
leave <strong>Hydro</strong>. During the first quarter of 2012, <strong>Hydro</strong> will<br />
launch a new “alertline” served by an external company where<br />
all permanent and temporary employees can report their concerns<br />
at any time and in their own language through toll-free<br />
phone numbers or the Internet. The alertline replaces the former<br />
whistleblower channel. The aim is to make it easier for<br />
employees to report their concerns related to behavior that<br />
may conflict with <strong>Hydro</strong>’s values or threaten our reputation.<br />
As required, it is possible to report anonymously. At least once<br />
a year, <strong>Hydro</strong>’s internal auditor informs corporate management<br />
about utilization of the channel.<br />
Information about the alertline will be given through bulletin<br />
boards and <strong>Hydro</strong>’s intranet. Together with anti-corruption<br />
and basic employee rights, information is also given through<br />
“you and <strong>Hydro</strong>” – a brochure and an e-learning program<br />
available to all employees in 12 languages.<br />
It has been decided to strengthen <strong>Hydro</strong>’s internal audit by a<br />
hub in Brazil, reporting to the main function at the head office<br />
in Oslo. The new units in Brazil have gone through internal<br />
and external audits related to financial and non-financial topics<br />
in 2011. These efforts will continue in 2012.<br />
<strong>Hydro</strong>’s internal audit unit reports to the company’s board of<br />
directors through the board audit committee.<br />
In <strong>Hydro</strong>, compliance is defined as adherence with external<br />
laws and regulations as well as internal steering documents.<br />
The compliance system comprises measures to reduce the risk<br />
of non-compliance. These measures are grouped into four categories:<br />
prevention, detection, reporting and responding.<br />
Compliance is a line responsibility in <strong>Hydro</strong>. The corporate<br />
staffs Legal and HSE & CSR have a support and advisory role<br />
for non-financial compliance. In 2011, a compliance officer<br />
function for <strong>Hydro</strong> was established to coordinate processes<br />
and activities within the non-financial compliance system.<br />
vIABIlItY perForMAnCe<br />
Integrity and human rights<br />
57<br />
Risk mapping was performed in 2011 to identify major HSE<br />
and other non-financial compliance risks. Based on this, several<br />
activities were started and integrated in the 2011 business<br />
plans.<br />
Combating corruption and respecting human rights are both<br />
included in our supplier requirements, see page 58.<br />
Combating corruption<br />
<strong>Hydro</strong>’s Code of Conduct is approved by the board of directors.<br />
The <strong>Hydro</strong> Integrity Program is an important tool to prevent<br />
corruption and human rights violations connected to our<br />
activities. The program was last updated in 2009 and includes<br />
risk mapping, tools and training. In 2011, about 1,800<br />
employees were trained in the program. Of these, almost 1,000<br />
are in <strong>Hydro</strong> Building Systems (HBS), which means that half<br />
of the employees there have been through the training. HBS<br />
pinpointed the most relevant information and developed<br />
Q&As to illustrate the cases, with support in several languages.<br />
In our new activities in Brazil, 120 leaders and specialists participated<br />
in 2011. This includes all top leaders in Bauxite &<br />
Alumina, and a large number of other relevant employees in<br />
Paragominas. More employees at Alunorte will be included<br />
early in 2012. Training includes dilemma discussions on combating<br />
corruption and promoting human rights. About 5,000<br />
employees have participated in the training program since<br />
2006, in addition to 120 employees from joint-venture companies.<br />
In addition, our Rolled Products business distributed<br />
in 2011 information about the program in local language to<br />
4,000 employees.<br />
A fraud awareness and detection questionnaire forms part of<br />
internal audit activities where relevant. Our accounting centers<br />
are trained to ask relevant questions to reveal possible fraud or<br />
other questionable accounts.<br />
2011 target<br />
• No instances of corruption<br />
• No instances of human rights violations<br />
• Implement CSR strategy for the new organization in Brazil<br />
2011 result<br />
• No known instances of corruption<br />
• No known instances of human rights violations in <strong>Hydro</strong><br />
• Stakeholder dialogue related to the CSR strategy initiated.<br />
Implementation continues in 2012<br />
2012 target<br />
• No instances of corruption<br />
• No instances of human rights violations<br />
• Develop risk analyses and action plan for human rights<br />
Ambition<br />
All important suppliers should comply with our supplier standards.<br />
All our units should comply with our anti-corruption, human and<br />
labor rights standards, and report their performance. Our ambition<br />
is to be a preferred partner worldwide because of our responsible<br />
business operations.
58<br />
vIABIlItY perForMAnCe<br />
Integrity and human rights<br />
Promoting human rights<br />
We support the principle of freedom of association and collective<br />
bargaining, and have a long tradition in maintaining a good<br />
dialog with employee organizations. As an employer, owner and<br />
purchaser, our most important role related to human rights is to<br />
secure decent working conditions in our organization, in minority-owned<br />
companies and with our suppliers.<br />
It is essential for us to avoid the use of child labor and forced<br />
labor, both in <strong>Hydro</strong>’s activities and in those of our suppliers and<br />
partners. We are concerned about fundamental labor rights,<br />
such as freedom of association, minimum wage requirements<br />
and the regulation of working hours. We do not tolerate discrimination<br />
on the basis of gender, race, national or ethnic origin,<br />
cultural background, social group, disability, sexual<br />
orientation, marital status, age or political opinion. See page 64.<br />
Almost all our production sites in Europe, Australia, Brazil and<br />
Argentina – representing 89 percent of our employees – are<br />
unionized. About 80 percent of our employees in Norway<br />
belong to unions, and a large proportion of employees in Germany<br />
and Brazil are also union members, the majority in Germany<br />
belonging to IG Metall and IG Bergbau, Chemie, Energie.<br />
Contact between union representatives across borders is an<br />
important part of the integration process for our new activities<br />
in Brazil. We build on a strong relationship between union representatives<br />
and management that has been developed in <strong>Hydro</strong><br />
over the decades.<br />
Conflicts between <strong>Hydro</strong> and the employees resulted in only<br />
minor strikes during 2011. None of these exceeded a duration<br />
of one week.<br />
In countries where the right to form trade unions is restricted,<br />
we try to find alternative forums to uphold the rights of employees<br />
to influence their work situation, like in Qatar and China. In<br />
March 2011, <strong>Hydro</strong> signed an international frame agreement<br />
with four unions, aiming to secure the development of good<br />
working relations in <strong>Hydro</strong>’s worldwide operations. In January<br />
2012, we signed a new corporate agreement with the main<br />
unions regarding the European Works Council.<br />
In 2011, we engaged the Danish Institute of Human Rights to<br />
assist us in assessing areas of human rights risks to come up with<br />
an action plan. The risk analysis and action plan, which is<br />
expected to be completed early in 2012, are part of <strong>Hydro</strong>’s<br />
revised CSR strategy. Human rights information has been communicated<br />
to the board of directors, the corporate management<br />
board, all business area management teams, and other relevant<br />
parties including union representatives.<br />
It is necessary to employ security staff in some areas, including<br />
armed guards for the protection of personnel, property and<br />
business activities. No negative incidents in connection with our<br />
use of security staff were registered in 2011.<br />
In 2011, we became operator of the Paragominas bauxite pipeline<br />
that crosses areas inhabited by a traditional Quilombola<br />
group in Jambuaçu Territory in Brazil. <strong>Hydro</strong> has established<br />
contact with Quilombola representatives and enhanced dedicated<br />
resources to improve and follow up the dialog. We have<br />
entered into an agreement to invest BRL 650,000 (about NOK<br />
2.2 million) in a project – Casa familiar Rural – aiming at stimulating<br />
income generation by enhancing education, acquiring<br />
land, etc.<br />
Maintaining the rights of indigenous peoples is important to the<br />
part-owned operation Alouette in Canada. Local management<br />
is handling the dialog with the indigenous representatives, and<br />
we are working through the board of directors to follow this up.<br />
The relocation of people is sometimes necessary in connection<br />
with our operations. No relocations took place in relation to<br />
<strong>Hydro</strong>’s activities in 2011. Through the vale transaction,<br />
<strong>Hydro</strong>’s ownership share increased from 20 to 81 percent in a<br />
planned alumina refinery, Companhia de Alumino do Pará<br />
(CAP) in Brazil. Before entering into the project, we initiated an<br />
independent review of the resettlement process. The review concluded<br />
that the resettlement had been conducted in compliance<br />
with the Equator Principles and the International finance Corporation<br />
Performance Standards. further relocations will<br />
become necessary as the project moves forward.<br />
There is currently one legal dispute between 5 of the 120 relocated<br />
families and CAP. Such families claim to have the right to<br />
remain on the land that is occupied by CAP. However, after a<br />
preliminary analysis, the Trial Court denied such request, which<br />
was confirmed by the Court of Appeals.<br />
Corporate responsibility in the supply chain<br />
<strong>Hydro</strong> has more than 18,000 suppliers globally. The majority<br />
are situated close to our production facilities. Our supplier<br />
requirements regarding corporate responsibility form an integral<br />
part of all stages of the procurement process. They cover<br />
environment, human rights, anti-corruption and working<br />
conditions, including work environment. Implementation is<br />
risk-based and takes into consideration contractual value and<br />
country risk, et al. The principles include auditing rights and<br />
the contractors’ responsibility toward subcontractors and to<br />
their suppliers as well.<br />
Our policy is that contracts with a value above USD 3 million<br />
shall include CSR requirements in the contract itself or in a<br />
separate declaration that is signed by the supplier. In relevant<br />
new contracts, the requirements are usually included in the<br />
contract itself. The requirements are valid to all contracts, irrespective<br />
of value, which are conducted in high-risk countries<br />
or which have high strategic importance. In our Projects<br />
organization, which is responsible for all major construction<br />
projects in <strong>Hydro</strong>, all supplier contracts in new projects are<br />
following the above requirements.
Total payments (taxes, fees, etc.) to host governments 1)<br />
In 2011, we entered into dialog with certain suppliers and customers<br />
about alleged breaches of <strong>Hydro</strong> policies.<br />
In addition to <strong>Hydro</strong>’s 5 percent ownership stake in MRN in<br />
Brazil, we have a long-term offtake agreement to vale’s share of<br />
MRN’s production. This makes MRN a large supplier of<br />
bauxite to <strong>Hydro</strong>. See pages 54, 65 and 66 for more information<br />
about MRN.<br />
voluntary commitments<br />
Our most important voluntary commitments are our support of<br />
the principles in the Universal Declaration of Human Rights<br />
and the UN Global Compact. We also support the OECD’s<br />
Guidelines for Multinational Enterprises, Transparency International’s<br />
Business Principles for Countering Bribery, the World<br />
Economic forum’s Partnering Against Corruption Initiative,<br />
and the Extractive Industries Transparency Initiative (EITI). We<br />
voluntarily report payments to host governments related to<br />
exploration and extraction activities for bauxite, as well as operations<br />
for the production of aluminium oxide, based on EITI’s<br />
principles. In addition, we cooperate with organizations including<br />
Transparent Agent and Contracting Entities, Transparency<br />
International and Amnesty International. In 2011, we became a<br />
member of the International Council on Mining and Metals<br />
(ICMM). Through this membership we are committed to following<br />
ICMM’s 10 Principles.<br />
According to our internal directives, <strong>Hydro</strong> is not permitted to<br />
make financial contributions to political parties.<br />
Community impact<br />
Ensuring responsible conduct in relation to society at large is<br />
an important element throughout the life phase of our activities.<br />
The construction of new plants, acquisitions and divestments<br />
as well as closing down capacity, are particularly<br />
vulnerable in this respect. Our long experience in responsible<br />
restructuring has been severely tested in recent years.<br />
On february 28, 2011, we took over the majority of vale’s aluminium<br />
business in Brazil. We have become the majority owner<br />
of one of the largest bauxite mines in the world, the largest<br />
vIABIlItY perForMAnCe<br />
Community impact<br />
NOK million 2011 2010 2009 2008 2007<br />
Australia - - (0.7) 0.4 6<br />
Brazil 48 98 160 139 89<br />
1) Total payments to host governments in connection with the exploration and production of bauxite and alumina. Payments include benefit streams, profit tax,<br />
royalty, license fees, rental fees, entry fees, etc. The reporting is based on the principles in Extractive Industries Transparency Initiative (EITI). In 2012, <strong>Hydro</strong><br />
divested its ownership share in Alpart, Jamaica.<br />
59<br />
alumina refinery in the world and have substantial expansion<br />
opportunities in this critical part of the value chain. It also gave<br />
us 3,850 new colleagues in Brazil – or about 6,500 including<br />
apprentices and employees on long-term contracts. Germany<br />
and Brazil are now the countries where we have the most employees,<br />
followed by Norway. The transaction has also given us substantial<br />
presence in a geographical area with exposed societies and<br />
vulnerable ecosystems. We are working on the integration of the<br />
new organization while learning from their experience, and have<br />
just entered into dialog with our new neighbors.<br />
Construction of the new aluminium plant Qatalum in Qatar<br />
was completed in 2011 with full production from September.<br />
Qatalum is a 50/50 joint venture between <strong>Hydro</strong> and Qatar<br />
Petroleum with 1,170 employees, of which the large majority<br />
are foreign citizens. See page 64.<br />
Continued restructuring<br />
The extrusion plant at Karmøy will be closed in March 2012 as<br />
part of our work to restructure the production of aluminium<br />
profiles in Norway. This directly affects 94 employees at Karmøy.<br />
The entire production and about 40 of the positions will be<br />
transferred to Magnor and Raufoss, strengthening operations at<br />
the two sites. Overall, our Norwegian extrusion business has<br />
380 employees. The planned recycling center at Karmøy, with<br />
an initial annual capacity of 35,000 mt, has been postponed<br />
until further notice.<br />
2011 target<br />
• Integrate our new colleagues from Vale Aluminium<br />
• Secure good and efficient dialog with the local societies in Pará, Brazil<br />
• Establish CSR action plan for community investments in Pará, Brazil<br />
2011 result<br />
• Integration process well underway in Brazil<br />
• Successful dialog so far with local societies in Brazil<br />
• CSR action plan for community investments not yet developed<br />
2012 target<br />
• Establish CSR action plan for community investments in Pará,<br />
Brazil<br />
• Restructuring processes carried out with respect to employees<br />
and their communities<br />
Ambition<br />
We want to be a preferred partner worldwide due to our<br />
responsible business operations.
60<br />
vIABIlItY perForMAnCe<br />
Community impact<br />
Maintain and enhance cooperation<br />
“Work will continue on several levels. We must maintain the<br />
contact that has been established. We want to arrange for the<br />
Brazilian employee representatives to visit Norway and familiarize<br />
themselves with how we work and cooperate here, both centrally<br />
and locally at the plants. I believe that maintaining good contact<br />
will be beneficial for everyone. In addition, we have discussions<br />
ongoing between Norwegian trade unions in the industrial and<br />
energy sectors about getting involved in one or more of the social<br />
projects that will be initiated in Brazil. This is completely in line with<br />
our fundamental approach to solidarity.”<br />
Sten Roar Martinsen,<br />
Employee-elected member of <strong>Hydro</strong>’s board of directors,<br />
representing the Norwegian Confederation of Trade Unions (LO)<br />
Read full interview at www.hydro.com/reporting2011<br />
following difficult market situations, <strong>Hydro</strong> Building Systems<br />
has had demanning processes in Portugal, Spain, Italy and<br />
Austria during 2011. In total, 237 employees were directly<br />
affected. In January 2012, <strong>Hydro</strong> announced that it is reducing<br />
its extrusion capacity in Portugal.<br />
following a consultation process with the local employees,<br />
<strong>Hydro</strong> announced in January 2012 that one of its three production<br />
lines in the Kurri Kurri aluminium plant in Australia will be<br />
closed down. The closure will make redundant 150 employees,<br />
of which 140 have volunteered to accept a severance package.<br />
At our primary metal plant in Neuss, Germany, production<br />
capacity was temporarily reduced in 2009 from 235,000 metric<br />
tons to 50,000 mt, affecting 700 employees who have different<br />
levels of reduced working hours. Mothballing the plant’s primary<br />
production is still undecided, while casthouse production<br />
continues. The plant was transferred to our Rolled Products<br />
business early in 2012 to link it closer to <strong>Hydro</strong>’s other activities<br />
in the vicinity (Grevenbroich and part-owned Alunorf).<br />
Half of the production at part-owned Søral in Husnes, Norway,<br />
has been temporarily stopped since 2009. To minimize<br />
the number of temporarily laid-off employees, some employees<br />
have been utilized as holiday relief and in investment projects.<br />
By the end of 2011, Søral had 10 employees on reduced<br />
working hours.<br />
The oldest production line in Sunndal, Norway, was temporarily<br />
closed in May 2009. Upon request from the main local<br />
union and in agreement with the local Labor and Welfare<br />
Organization (NAv), it was decided to introduce a system of<br />
rolling temporary layoffs to minimize the strain on each individual.<br />
Instead of temporarily laying off 160 employees for a<br />
longer period, all employees in the affected organization are<br />
A challenging decision<br />
The decision to close the extrusion plant at Karmøy was based on<br />
an actual situation of overcapacity in <strong>Hydro</strong>’s production in Norway,<br />
implying the need to close one of the three extrusion plants – at<br />
Karmøy, Raufoss and Magnor. There was also general consent<br />
within the involved unions about the need to reduce fixed costs by<br />
closing down a press. Due to Magnor’s proximity to the Swedish<br />
market and a generally lower fixed-cost level, the main alternatives<br />
were closing down the extrusion plant at Karmøy or the large press<br />
at Raufoss. There was also a general agreement that the cost level at<br />
Karmøy was higher than at Raufoss, but the main union at Karmøy<br />
(Industri Energi) argued that Karmøy had a higher competence level<br />
and the possibility of matching the cost level at Raufoss. After the<br />
formal decision had been taken to close Karmøy, <strong>Hydro</strong> agreed to<br />
pay for an independent report ordered by the two unions to verify<br />
the decision. The report did not bring any new essential findings to<br />
the issues that were highlighted, and the process continued based<br />
on the original conclusions. Following the report, the decision was<br />
accepted by the parties. The close to 100 involved employees at<br />
Karmøy have been offered different means, including severance<br />
packages and priority for new positions at Raufoss.<br />
included in a scheme of five-week layoffs. An annual capacity<br />
of 15,000 mt was restarted in June 2011. A planned further<br />
ramp-up has been postponed until further notice.<br />
All manning reductions have been communicated in advance<br />
to union or employee representatives and have followed the<br />
layoff requirements specified in relevant collective bargaining<br />
agreements and legislation. All layoffs have been handled fairly,<br />
objectively and in a manner that reduces the risk of discrimination<br />
as it pertains to age, gender, race and veteran status,<br />
while preserving the competence needed. Different means<br />
have been used to reduce the impact on employees and the<br />
local communities concerned.<br />
Several of our primary aluminium plants have expiring power<br />
contracts, which may result in operational adjustments in the<br />
coming years.<br />
<strong>Hydro</strong>’s share in the minority-owned alumina refinery Alpart,<br />
in Jamaica, was divested to Rusal in September 2011. The<br />
operations have been temporarily closed since June 2009.<br />
New projects<br />
When planning new projects, we map the environmental and<br />
social impact. Our analyses follow the Equator Principles, and<br />
thus reflect the requirements of the World Bank and the International<br />
finance Corporation regarding information, consultation<br />
and investigation of the project’s environmental and social<br />
impact, including human rights, as well as an action plan and<br />
proposed initiatives. Dialog with affected groups gives input to<br />
plans, detailing our environmental and social responsibilities.<br />
We strive to act in an open and credible manner, and gather<br />
views from interested parties, aiming for a common understanding<br />
of the decisions that are made.
Qatalum, where <strong>Hydro</strong> holds a 50 percent share, started production<br />
in the end of 2009 and reached full production in September<br />
2011. The products are well received in the market, and<br />
Qatalum has now entered a new phase of enhancing its operational<br />
efficiency. The company aims to be a catalyst for growth<br />
in the manufacturing sector in Qatar. This includes the purchase<br />
of goods and services.<br />
Construction of the expansion from one to three extrusion press<br />
lines in Suzhou, China has started. Two of the lines will be for<br />
precision tubes and the third for general extruded products, targeting<br />
customers mainly in the Chinese market. <strong>Hydro</strong> is following<br />
up a stakeholder engagement plan that emphasizes<br />
company principles in the area of corporate social responsibility.<br />
The plan includes contractors and suppliers. The main suppliers<br />
have already signed declarations stating compliance with these<br />
principles, and they will be audited.<br />
<strong>Hydro</strong>’s extrusion plant, Acro, outside São Paulo in Brazil also<br />
will be expanded with one press line, in addition to the three<br />
existing ones.<br />
The CAP Project covers the CAP alumina refinery project of 1.86<br />
million metric tons per year as well as the expansion of the Paragominas<br />
mine to 14.85 million mt per year. Through the vale<br />
transaction, <strong>Hydro</strong>’s ownership in the project increased from 20<br />
percent to 81 percent. The refinery was originally approved and<br />
project execution commenced in 2008. Construction has been<br />
postponed several times, most recently in March 2012.<br />
Dialog with affected parties<br />
We have a long tradition of conducting a dialog with the relevant<br />
parties affected by our activities, such as unions, works<br />
councils, customers, suppliers, business partners, local authorities<br />
and non-governmental organizations. Stakeholder dialog is<br />
based on our experience and principles developed by an international<br />
working group headed by the Institute of Social and Ethical<br />
Accountability. We identify and initiate dialog to ensure that<br />
all views are aired and our decisions communicated. In major<br />
projects, stakeholder dialog is a requirement of <strong>Hydro</strong> directives,<br />
local law, World Bank guidelines, the Equator Principles,<br />
Qualifying local youth<br />
In 2011, <strong>Hydro</strong> opened a new technical college in Paragominas in<br />
Pará, Brazil. The school is run by the federal organization SINAI and<br />
is an important contribution to educating skilled workers for the<br />
industry and giving local youth the possibility of an education. The<br />
first 100 students started in August 2011, and 65 of the students<br />
are apprentices with <strong>Hydro</strong>. At full capacity, the college may have<br />
600 students from Paragominas and the neighboring communities.<br />
Since the start-up in 2006, the Paragominas Mine has had 800<br />
apprentices, of which 80 percent are still with <strong>Hydro</strong>. Apprenticeship<br />
programs are common at most major <strong>Hydro</strong> sites. Our extrusion<br />
plant Acro, also in Brazil, started in 2011 an apprentice program for<br />
19 adolescents. For many of these, the apprenticeship represents an<br />
opportunity for a better life.<br />
vIABIlItY perForMAnCe<br />
Community impact<br />
61<br />
et al. This includes the principle of free, prior and informed consent<br />
when indigenous peoples are involved.<br />
<strong>Hydro</strong> has a long tradition in maintaining good dialog with<br />
the employees’ representatives. This includes involvement at<br />
an early stage in restructuring processes. In our new Bauxite &<br />
Alumina operations in Brazil, we seek to bring with us our<br />
tradition for open and successful collaboration between management<br />
and unions. Around the time of the closing of the<br />
acquisition, top union representatives from Norway met with<br />
local union representatives in Pará to carve out a way forward,<br />
formalizing and coordinating union dialog across new and old<br />
parts of <strong>Hydro</strong>. The dialog started off on a positive note and<br />
continued throughout 2011.<br />
We have also established contact with local authorities and<br />
representatives for our neighbors. This includes dialog with<br />
traditional Quilombola groups, see page 58.<br />
An important part of communication with employees was<br />
<strong>Hydro</strong>’s Brazil Summit in which 150 employees participated<br />
together with the CEO and other <strong>Hydro</strong> executives. Most of the<br />
participants had leadership positions, but blue-collar workers<br />
were also represented. Our program <strong>Hydro</strong> fundamentals, in<br />
which 120 Brazilian leaders participated during 2011, is important<br />
for knowledge sharing and for understanding the <strong>Hydro</strong><br />
values. Our ambition is to have the other employees go through<br />
an adapted version of <strong>Hydro</strong> fundamentals in 2012.<br />
When needed, employees are given the opportunity to put<br />
questions over the intranet to top management. It is possible<br />
to ask questions in person or anonymously, and answers are<br />
posted simultanously through net meetings on the intranet.<br />
President & CEO Svein Richard Brandtzæg has his own blog<br />
on our intranet where employees can add their comments, also<br />
in person or anonymously.<br />
Sponsorships and community investments<br />
In 2011, <strong>Hydro</strong> spent more than NOK 61 million on community<br />
investments, charitable donations and sponsorships of<br />
which more than half was related to community investments.<br />
Giving something back<br />
Most <strong>Hydro</strong> plants are involved in social activities, which mean<br />
giving something back to the local communities. <strong>Hydro</strong>’s extrusion<br />
plant in North Liberty, Indiana, in the U.S., has a long tradition<br />
of providing monetary contributions to non-profit agencies.<br />
Employees raise money through sales of homemade breakfast<br />
and lunch food items, hand-crafted items, raffles, cash, and food<br />
donations. In 2011, <strong>Hydro</strong>’s St. Augustine plant in Florida was<br />
given special recognition by the St. John’s County School District<br />
and was honored as the Outstanding Business Partner. The plant<br />
has a continuing partnership with local Hartley Elementary School,<br />
and has been donating both time and funds to the Advanced<br />
Reader program for the past five years
62<br />
vIABIlItY perForMAnCe<br />
Organization and work environment<br />
“Education for all”<br />
Alunorte and Albras are situated in the community of Barcarena,<br />
which has 100,000 inhabitants and is one of the fastestgrowing<br />
communities in Brazil. Many of the inhabitants have<br />
a low education level. Since 2011, Alunorte has cooperated<br />
with the municipality of Barcarena in an extensive program to<br />
improve educational performance in Barcarena, including higher<br />
enrollments and lower school truancy. The program aims at<br />
improving the children’s and youngsters’ environmental and<br />
citizenship knowledge. Sport is also an important part of the<br />
program for the youngsters, with participation in the annual Norway<br />
Cup soccer tournament in Oslo, Norway as the ultimate incentive.<br />
For the first time, a girls’ team participated in Oslo together with a<br />
boys’ team. Participants in Norway Cup are chosen according to<br />
good academic records and school attendance, in addition to their<br />
athletic skills. In 2011, about 2,500 students from six to 20 years<br />
participated in one or several parts of the program.<br />
Main outcome of the investments is a strengthening of local<br />
communities in addition to increased goodwill for <strong>Hydro</strong> and<br />
pride in the organization.<br />
As a mine operator in Paragominas in Parà, Brazil, we perform<br />
some of our most important community investments there.<br />
These include building schools, social centers for vulnerable<br />
children and adolescents, community infrastructure, cultural<br />
and sports facilities as well as health care. In 2011, we finalized<br />
construction of a technical college and a center for HIv/AIDS<br />
prevention and treatment. Local activities at <strong>Hydro</strong> sites around<br />
the world typically include children’s education and sports activities,<br />
culture and assistance to needy children. Our sponsorship<br />
activities also include support of the Nobel Peace Center in Oslo<br />
and an agreement with Save the Children Norway.<br />
Other important contributions are the transfer of competence<br />
that takes place through our cooperation with universities and<br />
research institutions. This includes scholarships to selected<br />
PhD aspirants working in our business areas. <strong>Hydro</strong> is sponsoring<br />
professorships in Norway and Qatar and has several<br />
adjunct professors among its own employees. Alunorte, in<br />
Brazil, started in June 2011 – in cooperation with the University<br />
of Pará – a program to further develop 26 of its engineers.<br />
Through a two-year program combining work and studies,<br />
they get the opportunity to achieve a Master’s degree within<br />
process, maintenance or automation.<br />
<strong>Hydro</strong> reviewed its sponsorship and partnership strategy in<br />
2011. The new strategy builds on:<br />
• People (education, humanitarian aid, culture)<br />
• Planet (energy and climate change, recycling, resource<br />
management<br />
• Possibilities (science, technology and innovation, design)<br />
2011 target<br />
• No fatal accidents<br />
• Total recordable injuries per million hours down by 28 percent to 2.7<br />
• Review HR strategy including setting diversity ambitions<br />
2011 result<br />
• Three fatal accidents in consolidated activities<br />
• Total recordable injuries per million hours increased by 2 percent<br />
• People strategy reviewed, with diversity ambitions set<br />
2012 target<br />
• No fatal accidents<br />
• Total recordable injuries per million hours down by 25 percent to 2.85<br />
• Diversity awareness program launched<br />
• 90 percent response rate on <strong>Hydro</strong> Monitor. All units have<br />
developed follow-up plans by the end of September.<br />
Ambition<br />
Our ambition is to have no fatal accidents or other serious injuries<br />
and no new occupational illness cases. We will utilize HSE<br />
opportunities as a competitive edge.<br />
<strong>Hydro</strong>’s social investments and sponsorships should be<br />
included in at least one of these categories. To support the<br />
strategy and improve our overview, we initiated a reporting<br />
pilot on sponsorships, charitable donations and community<br />
investments. Outcomes for <strong>Hydro</strong> and the society are also<br />
included in the reporting requirements.<br />
Community investments in <strong>Hydro</strong>’s new activities in Pará, Brazil<br />
have mostly been continued after the acquisition. further investments<br />
will be based on current and future stakeholder dialog.<br />
organization and work environment<br />
Our ambition is to be highly competitive when it comes to<br />
recruiting and keeping the best-qualified personnel. We focus<br />
on developing a healthy and safe work environment, providing<br />
each employee with the proper conditions for the continuous<br />
development of her or his expertise. Our TRI rate (total recordable<br />
injuries per million hours worked) was 3.8 in 2011. This<br />
represented an increase of 2 percent, compared with our target<br />
of a 28 percent decrease. We had three fatal accidents in our<br />
consolidated operations. Even though our safety results are<br />
among the best in industry, we are far from satisfied.<br />
<strong>Hydro</strong>’s organization in 40 countries represents a great diversity<br />
in education, experience, gender, age and cultural background.<br />
We see this diversity as a significant resource, not least to encourage<br />
innovation. Good leadership, proper organizational structure<br />
and the right tools are essential to achieving this. This<br />
includes attracting and retaining the right employees.<br />
It is important that our employees enjoy good health, and feel<br />
safe and appreciated. Healthy and motivated employees perform<br />
better and are more creative, and in that way contribute to<br />
increased profitability and better results.
Effective organization<br />
<strong>Hydro</strong> had 22,655 permanent employees at the end of 2011, an<br />
increase from 18,894 in 2010. In addition, we had 1,368 temporary<br />
employees, and contractor employees represented about<br />
8,900 full-time equivalents during 2011. The increase in 2011<br />
followed the acquisition of vale’s former aluminium business.<br />
We now have our highest number of employees in Brazil, followed<br />
by Germany, Norway and the U.S.<br />
<strong>Hydro</strong>’s people strategy was reviewed in 2011 through an extensive<br />
process involving people at all levels in the organization,<br />
including the board of directors. It is built on five pillars: performance<br />
culture, competence management, leadership pipeline,<br />
diversity and mobility.<br />
The integration of our new colleagues in Brazil was our most<br />
important task within organizational development in 2011.<br />
Restructuring and continuous improvement are essential elements<br />
of our business operations. Our aim is to involve employees<br />
in such processes at an early stage in order to achieve the best<br />
results for the individual and for the company.<br />
Welcoming and retaining new colleagues<br />
On March 1, we welcomed almost 4,000 employees from vale’s<br />
former aluminium business. Everyone received an introduction<br />
package with information about <strong>Hydro</strong> and the company’s<br />
ambitions and values. All will go through a program in 2012 to<br />
learn more about <strong>Hydro</strong>’s values, social responsibility, value<br />
chain and HSE. See page 61.<br />
We offer new employees training related to the organization and<br />
their individual work tasks. This includes required competence<br />
within health, security, safety and environment. A special training<br />
course welcomes the employees, giving them insight into<br />
<strong>Hydro</strong>’s history, values, competitive landscape and businesses.<br />
An interactive e-learning program – “you and <strong>Hydro</strong>” – deals<br />
with <strong>Hydro</strong>’s policies and the rights and obligations of its<br />
employees, and is mandatory for all employees. The program<br />
Honored for high standard employee<br />
development<br />
<strong>Hydro</strong>’s primary aluminium plant in Høyanger, Norway was honored<br />
with a “Competence Award 2011” from HR Norge, Norway’s<br />
member organization for HR and management personnel. The<br />
prize was awarded for the integrated and systematic competence<br />
development system in the plant, including mapping and measuring<br />
the effects from the system. The award is an important recognition<br />
of <strong>Hydro</strong>’s Aluminium Metal Production System (AMPS) program,<br />
which aims to optimize and standardize work processes. See page<br />
69. The overall plan is to give the operators more responsibility for<br />
helping describe and standardize the work processes. The plant<br />
has reduced production costs by USD 260 per metric ton since<br />
2008, with AMPS as an important factor. Høyanger served as a pilot<br />
location for the program, which is also now being rolled out to whitecollar<br />
workers and to other Primary Metal locations.<br />
vIABIlItY perForMAnCe<br />
Organization and work environment<br />
63<br />
discusses some of the dilemmas employees may meet in their<br />
daily work, and presents a spectrum of work situations relevant<br />
to employees everywhere. It also raises issues like safety, security,<br />
work environment, human rights, combating corruption and<br />
reporting. See also www.hydro.com/youandhydro<br />
The most important development takes place locally, primarily<br />
with on-the-job training, but also through locally organized<br />
training.<br />
Our aim is that every employee should have an annual appraisal<br />
dialog and participate in an organizational survey at least once<br />
every two years. Several processes are initiated to form the basis<br />
of organizational development in <strong>Hydro</strong>. <strong>Hydro</strong> Monitor is an<br />
employee survey that gauges the climate in the organization at<br />
regular intervals. The <strong>Hydro</strong> Leadership Development Process<br />
(HLDP) is our common tool for employee appraisal dialog,<br />
individual development and follow-up. HLDP is mandatory<br />
for leaders. Leaders in the new organization in Brazil were<br />
introduced to HLDP in 2011. full roll-out will take place in<br />
2012, including training of facilitators. We are also planning<br />
to offer all other employees in the new organization an<br />
appraisal dialog during 2012. Existing competence development<br />
systems from vale will be used to develop our systems<br />
further, focusing on retaining core competence.<br />
Our employee survey, <strong>Hydro</strong> Monitor, is run every second<br />
year. In 2010, the response rate was 92 percent. In 2011, we<br />
have redesigned the survey to ensure that it represents best<br />
practice. The technical solution also has been improved. The<br />
changes have been anchored in the organization and with<br />
important employee representatives. Our ambition is to use<br />
the survey as an organizational tool to drive employee engagement<br />
and to improve effectiveness and performance. Employees<br />
throughout the company are involved in organized<br />
discussions and workshops to identify improvement actions,<br />
with the implementation of these actions followed up. The<br />
next survey for all employees will be in 2012. We will target a<br />
response rate of 90 percent, and require all units to have follow-up<br />
plans by the end of September, based on their survey<br />
results.<br />
Developing managers able to deliver on <strong>Hydro</strong>’s strategy and<br />
ambitions is key to our leadership-planning process and leadership-training<br />
programs. Our leadership expectations are based<br />
on <strong>Hydro</strong>’s values and are embedded in our 360-degree feedback<br />
tool. The leadership expectations define the behavior<br />
expected of leaders at all levels, and guide leadership assessment,<br />
reward and development activities. The 360-degree tool is used<br />
to support individual leaders in their development. feedback<br />
from use of the tool is also included as an input to HLDP.<br />
In order to have a healthy pipeline of senior leaders with the<br />
required breadth of experience, we emphasize rotating employees<br />
early in their careers so that they gain skills from different
64<br />
Diverse management<br />
Top management in our Extruded Products business, which<br />
has 9,500 employees, consists of 50 leaders. This includes all<br />
members of area and sector management teams, as well as the<br />
managing directors of strategic units. These 50 leaders represent 17<br />
nationalities. Seven of them – or 14 percent – are women. Women<br />
make up 40 percent of the management team of the Extrusion<br />
Eurasia sector and 33 percent of the Extrusion North America sector.<br />
It is our ambition to increase gender diversity in leadership positions<br />
further. Eighteen percent of the employees in Extruded Products are<br />
women.<br />
parts of the organization. Performance indicators are developed<br />
in the business areas and sectors to measure rotation.<br />
The employee turnover rate in 2011 was 8.2 percent including<br />
resignations, retirements and manning reductions. The figures<br />
do not include Brazil where we lack data for 2011. The employee<br />
turnover rate varies much from country to country – from 2.3<br />
percent in Slovakia and 2.9 percent in Germany to 14.2 percent<br />
in the US. The overall turnover rate for women was 12.7 percent<br />
and higher than for men in most countries. The most important<br />
exceptions are Australia, China and Spain, where the turnover<br />
rate for women is significantly lower than for men.<br />
Diversity<br />
We emphasize diversity with regard to nationality, culture, gender<br />
and educational background when recruiting, and when<br />
forming management teams and other working groups. While<br />
84 percent of top management are Norwegian or German, only<br />
36 percent of <strong>Hydro</strong>’s employees are the same. Women are represented<br />
in all business area management teams, and most<br />
female executives hired in recent years have been recruited internally.<br />
We are aiming at further diversity at all levels.<br />
Share of non-Norwegian leaders<br />
Percent<br />
50<br />
40<br />
30<br />
20<br />
10<br />
0<br />
vIABIlItY perForMAnCe<br />
Organization and work environment<br />
2007<br />
Top 50 leaders<br />
2008<br />
Top 200 leaders<br />
2009<br />
2010<br />
2011<br />
A reverse challenge<br />
<strong>Hydro</strong> employs locals when necessary competence and capacity<br />
is available, and normally uses expatriates only to secure employee<br />
development and the transfer of values and competence. Qatar<br />
and our part-owned smelter Qatalum, however, are to a large<br />
extent based on migrant workforce at all levels in the organization.<br />
Twenty-eight of 1,170 permanent employees were Qatari citizens in<br />
2011, with the others representing 34 nationalities. Local authorities<br />
work together with the industry to increase the ratio of Qataris. The<br />
measures include emphasis on education among young Qataris,<br />
summer internships and increased salary incentives. Qatalum offers<br />
all its employees compensation that is competitive, also in a global<br />
job market.<br />
We are continually adjusting working conditions so that all<br />
employees, regardless of their operability, have the same opportunities<br />
in their places of work. The principle of equal terms is<br />
prioritized in recruitment, job promotions and individual<br />
development.<br />
In 2011, 14 percent of <strong>Hydro</strong>’s employees globally were women,<br />
compared to 15 percent in 2010. Eleven percent of the employees<br />
in Brazil and Germany are women, compared with 18 percent<br />
in Norway and 19 percent in the U.S. Around 80 new<br />
employees were recruited to the Norwegian part of the organization<br />
in 2011, compared to 100 in 2010. Of these, 19 percent<br />
were women in 2011, compared to 20 percent in 2010.<br />
Compensation<br />
All employees shall receive a total salary that is fair, competitive<br />
and in accordance with the local industry standard. Only<br />
relevant qualifications such as performance, education, experience<br />
and other professional criteria shall be taken into account<br />
when making appointments, or when providing training, settling<br />
remuneration and awarding promotion. There are no significant<br />
gender-pay differentials for employees earning<br />
Share of women leaders<br />
Percent<br />
50<br />
40<br />
30<br />
20<br />
10<br />
0<br />
2007<br />
Top 50 leaders<br />
2008<br />
Top 200 leaders<br />
2009<br />
2010<br />
The total share of women at all levels in <strong>Hydro</strong> was 14 percent in 2011.<br />
2011
Cooperating for safety at Slovalco<br />
The Slovalco aluminium plant in Slovakia is 55-percent owned<br />
by <strong>Hydro</strong>. The company has an extensive management system<br />
to register and follow up all kinds of incidents and emissions. All<br />
managers, supervisors and union representatives are committed to<br />
perform safety dialogues. The system is Slovalco’s variety of <strong>Hydro</strong>’s<br />
Walk, Observe, Communicate tool and has been used since 2004.<br />
In 2011, the 480 employees in Slovalco performed in total 3,756<br />
such dialogs, which are recorded in the management system. The<br />
company registered one restricted work case among its employees<br />
in 2011 and two lost-time injuries among contractor employees.<br />
Off-the-job injuries are also measured and recorded, analyzed and<br />
discussed with management and union representatives.<br />
collectively negotiated wages in Norway. Salary conditions in<br />
the Norwegian business are reviewed on a regular basis. No<br />
significant gender-related differences were found in 2011. If<br />
significant differences are found at any level, we have a tradition<br />
for closing the gaps within short time.<br />
Executive variable compensation takes into consideration performance<br />
on individual as well as corporate KPIs and includes nonfinancial<br />
indicators. HSE, organization development and social<br />
responsibility are part of the bonus evaluation for the President and<br />
CEO and other members of the corporate management board. See<br />
Note 10 for further information on executive compensation.<br />
Health and work environment<br />
<strong>Hydro</strong> shall be a leading company in the area of health and<br />
work environment. Our business-planning process is used to<br />
ensure continuous improvement throughout the organization,<br />
and follow-up is reported on a quarterly basis.<br />
We work continuously to avoid new occupational illnesses. In<br />
2011, we developed common definitions for reporting both<br />
potential and verified cases. The implementation started early<br />
in 2012. We track development through a corporate reporting<br />
tool. The occupational-illness rate in 2011 was 0.6 cases per<br />
million hours worked, down from 1.2 in 2010. Most of the<br />
reported cases were related to noise. We expect an increase in<br />
2012 following the new definition and improved reporting.<br />
Come safely home!<br />
Putting safety gear on employees’ kids, photographing them and<br />
interviewing them about why safety is important, has become<br />
a success story in <strong>Hydro</strong>. The campaign started with posters at<br />
<strong>Hydro</strong>’s extrusion plant in Argentina, moved on to Acro in Brazil and<br />
has since been adopted by <strong>Hydro</strong> plants on different continents.<br />
The children are unanimous: Their mothers and fathers should come<br />
safely home!<br />
vIABIlItY perForMAnCe<br />
Organization and work environment<br />
Important award for a small site<br />
<strong>Hydro</strong>’s building systems brand Wicona received the German<br />
Occupational Safety and Health Award 2011 for its storage and<br />
logistics site in Gerstungen. A jury of experts from industry,<br />
politics, associations, science and society judged the products and<br />
process solutions of more than 200 applicants. The contributions<br />
were evaluated by the jury using criteria like efficiency and costeffectiveness,<br />
innovation, implementation and transferability in the<br />
working life. The award was received for the category “Process<br />
Solutions.” Clearly defined responsibilities, considerate and<br />
friendly feedback toward colleagues, and defined processes for<br />
emergencies are the ground rules at the site.<br />
65<br />
Guidelines for assessing work-environment risks are used by the<br />
business areas to help map and evaluate <strong>Hydro</strong>’s work environment.<br />
Almost all units have performed such assessments. An<br />
exception is our new Bauxite & Alumina business area, which will<br />
start implementation in 2012. To ensure focus on the physical<br />
and chemical work environment and encourage further improvements,<br />
we have established a performance indicator linked to risk<br />
assessment in the work environment. It is a proactive indicator,<br />
describing the potential for possible future damage to health. The<br />
indicator has been implemented at most of our sites. Local targets<br />
for 2012 have been based on identified risk-reducing measures,<br />
and is followed up through a corporate reporting tool. We are<br />
working on further implementation, including evaluation of<br />
introduction of the indicator in Bauxite & Alumina.<br />
<strong>Hydro</strong> Monitor (see page 63) is another tool we use to track<br />
the organizational work environment, and the results are<br />
implemented in local action plans.<br />
Through our new activities in Brazil, we now have significant<br />
activities in areas where some tropical diseases are present.<br />
Existing programs will be evaluated, and necessary precautions<br />
and relevant training identified. Malaria is only present to a<br />
limited degree in our consolidated operations. Minorityowned<br />
MRN has a program to limit malaria both within its<br />
premises and in the neighboring communities. This includes<br />
information given to employees, their families and riverside<br />
What’s wrong with this image?<br />
It is important to involve employees in making them aware of the<br />
risks that surround them every day at work. <strong>Hydro</strong>’s extrusion site<br />
St. Oliva in Spain sends out a picture with each payroll showing<br />
unsafe behavior, and the participant is asked to identify all unsafe<br />
conditions. Each month that passes, the task becomes more<br />
challenging. The plant wanted to see how much people had learned<br />
and absorbed about safe behavior in the workplace. With the<br />
monthly image, they know where they are and what they can expect<br />
from each employee. The task is very popular with 95 percent<br />
participation.
66<br />
vIABIlItY perForMAnCe<br />
Organization and work environment<br />
Fatal accidents<br />
Per 100 million hours worked, five-year rolling average<br />
7<br />
6<br />
5<br />
4<br />
3<br />
2<br />
1<br />
0<br />
03/07<br />
04/08<br />
<strong>Hydro</strong> employees Contractor employees Total<br />
dwellers. The number of malaria cases are recorded. No epidemics<br />
took place in 2011. Dengue fever occurs from time to<br />
time at several of our operations in Brazil. Employees are<br />
informed about the risk, and treatment is given through the<br />
operations’ health service. HIv/AIDS is of increasing concern<br />
in Brazil. In 2011, a HIv/AIDS center giving information<br />
about how to prevent the disease as well as treatment to the<br />
infected, was opened in Paragominas. <strong>Hydro</strong> paid for the construction<br />
of the center, which will be operated by the authorities.<br />
Several of our Brazilian sites participate annually in<br />
camaigns to prevent sexually transmitted diseases.<br />
Registered sick leave in <strong>Hydro</strong> was 3.1 percent in 2011, down<br />
from 3.3 percent in 2010. The rules for sick-leave registration<br />
differ from country to country. <strong>Hydro</strong>’s sick leave in Norway is<br />
significantly higher than in the rest of the company, on average,<br />
but relatively low compared to the average rate in Norwegian<br />
industry. Sick leave in Norway was 4.4 percent in 2011,<br />
the same as in the previous year. Men’s sick leave was 4.1 percent,<br />
slightly below the 2010 level of 4.2 percent, while women’s<br />
sick leave increased from 5.5 percent in 2010 to 5.7<br />
Total recordable injuries<br />
Per million hours worked<br />
5<br />
4<br />
3<br />
2<br />
1<br />
0<br />
2007<br />
<strong>Hydro</strong> employees<br />
2008<br />
05/09<br />
2009<br />
06/10<br />
2010<br />
07/11<br />
2011<br />
percent in 2011. Starting in 2012, we will be introducing a<br />
new sick-leave indicator that will be comparable across country<br />
borders.<br />
Safety<br />
Our ambition is to avoid all serious accidents. We work continuously<br />
to avoid damage to property and loss of production.<br />
This applies to all our activities.<br />
Our TRI rate (total recordable injuries per million hours<br />
worked) increased by 2 percent in 2011 following a 27 percent<br />
increase in 2010. Our target was a 28 percent decrease. We had<br />
three fatal accidents. In January 2011, a contractor employee<br />
died from electrical shock during installation work at a new<br />
plant in france. In October, a local contractor at <strong>Hydro</strong>’s majority-owned<br />
Albras primary aluminium plant in Brazil died from<br />
injuries sustained when hit by a forklift. An operator at Alunorte<br />
died in february 2012 after being severly injured by a spill of<br />
caustic soda in December 2011. Internal investigations were initiated<br />
after all accidents to identify the causes and reduce risk for<br />
recurrences.<br />
Construction of the part-owned Qatalum smelter in Qatar was<br />
performed under the supervision of <strong>Hydro</strong>’s Projects organization.<br />
Safety was an important part of the project and a low losttime<br />
injury rate (LTI) was a consequence. The number of<br />
contractor hours in projects has in recent years constituted a<br />
large proportion of <strong>Hydro</strong>’s total contractor hours. As a result,<br />
the LTI rate for contractors has been very low.<br />
In minority-owned operations, we are working through the<br />
board of directors to follow up safety in general and serious incidents<br />
in particular. MRN in Brazil, where <strong>Hydro</strong> owns 5 percent,<br />
suffered in 2011 a truck accident with two fatalities – one<br />
employee and one contractor.<br />
Our target for 2012 is no fatal accidents and a TRI rate of 2.85,<br />
or a 25 percent decrease from the actual level in 2011.<br />
Lost-time injuries<br />
Per million hours worked<br />
2,5<br />
2,0<br />
1,5<br />
1,0<br />
0,5<br />
0<br />
2007<br />
<strong>Hydro</strong> employees<br />
2008<br />
Contractor employees<br />
2009<br />
2010<br />
2011
from a 10-year perspective, we reduced the number of injuries<br />
per million hours worked from 9.5 in 2001 to 3.8 in 2011.<br />
Risk awareness and management commitment are important to<br />
improved safety performance. Internal investigations are routinely<br />
initiated after fatal accidents and other serious incidents.<br />
We have initiated several measures to improve our performance.<br />
We have established a company-wide, harmonized high-risk<br />
incident investigation and communication tool, which will be<br />
implemented in 2012. We have defined the focus areas man/<br />
machine interface, traffic and contractors for 2011 and 2012,<br />
and we are updating our safety risk assessment handbook.<br />
REACH<br />
The EU regulation on chemicals, REACH, entered into force<br />
on June 1, 2007. Aluminium is covered by the regulation.<br />
<strong>Hydro</strong> is on track with our implementation of REACH, having<br />
successfully completed the second stage in the legal process,<br />
i.e. the registration of substances produced and/or<br />
imported into the EU in volumes above 1,000 metric tons per<br />
year. The next step in the implementation of REACH is the<br />
registration of substances produced and/or imported in volumes<br />
above 100 mt. The deadline for this registration is June<br />
1, 2013. A further deadline for substances above 1 mt is June<br />
1, 2018.<br />
Classification, Labelling and<br />
Packaging (CLP)<br />
The Regulation on Classification, Labelling and Packaging<br />
(CLP) transposes in European law the Globally Harmonised<br />
System (GHS) for classification and labeling adopted by the<br />
United Nations. It covers substances and mixtures, and replaces<br />
the previous EU Dangerous Substances Directive and Dangerous<br />
Preparations Directive.<br />
CLP is about the hazards of chemical substances and mixtures<br />
and how to inform others about them. It is the task of industry<br />
to identify the hazards of substances and mixtures before these<br />
are placed on the market, and to classify them in accordance<br />
with the identified hazards.<br />
Importers and manufacturers must provide notification about<br />
substances subject to registration under the REACH Regulation<br />
and hazardous substances, irrespective of volumes, prior to placing<br />
them on the market. The first notification deadline was<br />
January 3, 2011, and was successfully met by <strong>Hydro</strong>.<br />
Security<br />
An increased presence in areas of risk, and the global volatile risk<br />
picture in general, has led us to intensify our preventive efforts.<br />
We are committed to the protection of people, environment and<br />
physical assets, anticipating and preparing for potentially adverse<br />
events in order to maintain business and operational continuity.<br />
vIABIlItY perForMAnCe<br />
Organization and work environment<br />
67<br />
To prepare for and respond to intentional, unintentional and/<br />
or naturally caused disasters, as well as the protection of critical<br />
assets, security measures are adapted and put in place based on<br />
the evolving risk picture.<br />
We are responsible for infrastructure and functions on local<br />
and regional level that might be critical to society’s operability,<br />
and we operate large-scale production sites where a catastrophe<br />
could influence the safety of the community. We are<br />
thereby subject to control and follow-up by national authorities.<br />
These high-risk issues are core to our emergency planning,<br />
and we maintain a high state of readiness, which is trained and<br />
monitored through regular exercises. A central emergency<br />
team is in place to support line management and ensure crisis<br />
handling in accordance with <strong>Hydro</strong>’s requirements and<br />
expectations.<br />
A threat and vulnerability assessment forms the basis for preventive<br />
measures in all business areas, including our new activities<br />
in Brazil.<br />
Secure information handling for ourselves and our customers<br />
is vital in supporting <strong>Hydro</strong>’s business continuity. Employees<br />
are trained in information security. Crucial computer systems<br />
are subject to surveillance and regulations. Every person with<br />
access to sensitive information is bound to secrecy, and<br />
required to handle the information with due care.<br />
<strong>Hydro</strong> has learning tools for risk management, travel safety<br />
and security. Employees are safeguarded through our systems<br />
for travel planning, risk assessment and emergency preparedness.<br />
Our ability to respond quickly to incidents worldwide<br />
has increased through risk monitoring, incident-monitoring<br />
tools and competence development.<br />
Innovation<br />
In our industry, we must start developing today the technology<br />
we will be using 10 or 20 years down the road. That’s why<br />
we are working to maintain progress, unaffected by the fluctuations<br />
of the business cycle. Smelter technology, alloys with<br />
special properties and buildings that are energy-neutral during<br />
operation are among the areas we are developing.<br />
Our research and development costs recognized as an expense<br />
amounted to NOK 508 million in 2011, compared to NOK<br />
543 million in 2010.<br />
The greater part of our R&D expenses goes to our in-house<br />
research organization, while the remainder supports work carried<br />
out at external institutions, see Note 14. Our main R&D<br />
centers are in Årdal (smelter technology) and Sunndal (alloys<br />
and casting) in Norway, Bonn in Germany (rolled products)<br />
and Toulouse in france (building systems).
68<br />
vIABIlItY perForMAnCe<br />
Innovation<br />
<strong>Hydro</strong> Recognition Program<br />
The objective of the <strong>Hydro</strong> Recognition Program is to energize all<br />
employees by recognizing excellent work and best-practice sharing.<br />
The winner is an organization or a team that has demonstrated<br />
outstanding effort within the areas of HSE, innovation or<br />
performance. Winners should clearly demonstrate the spirit of The<br />
<strong>Hydro</strong> Way, emphasizing the values of <strong>Hydro</strong> in the way they work.<br />
The first winners of the <strong>Hydro</strong> Recognition Program will be selected<br />
in 2012. The program replaces the President’s HSE Award and<br />
<strong>Hydro</strong> Innovation Award.<br />
We reviewed our R&D organization in 2011. Starting in<br />
2012, all business areas will be responsible for their own technology<br />
development and execution of their respective technology<br />
strategies. As part of the new organizational model, a<br />
corporate technology office has been established to ensure a<br />
holistic and long-term approach to <strong>Hydro</strong>’s technology strategy<br />
and agenda. The technology office will lead an internal<br />
R&D network with representatives from the business areas,<br />
and support the corporate management board in developing<br />
overall research and technology priorities and strategies.<br />
Metal production moving forward<br />
We intend to make production more efficient and to secure the<br />
necessary access to alumina and electrical power. Improvement<br />
efforts revolve around smelter technology and the positioning of<br />
new capacity in locations where there is a surplus of power.<br />
<strong>Hydro</strong>’s proprietary electrolytic process is one of the most efficient<br />
in the world. The primary aluminium plants in Sunndal,<br />
Norway and Qatalum, Qatar are using the newest technology.<br />
Our next-generation technology, HAL4e, is ready for use the<br />
next time we build an aluminium plant, having proven that it<br />
can produce primary aluminium with a specific<br />
Powerhouse alliance<br />
The Powerhouse alliance was founded in 2011. The alliance is<br />
aiming to build the world’s northernmost energy-positive building<br />
– a building that produces more energy than it consumes during<br />
operation – in Norway. In addition to <strong>Hydro</strong>, the alliance includes<br />
the real estate firm Entra Eiendom, the developer Skanska, the<br />
architecture firm Snøhetta and the environmental NGO Zero. The<br />
ambition is to demonstrate that it is possible to develop energypositive<br />
buildings not only in warm climates, but in colder climates<br />
like Norway. Since the alliance was formed, Powerhouse has<br />
started working on two projects in Norway, one rehabilitation project<br />
and one new building. The rehabilitation project is located in the<br />
municipality of Bærum, just outside Oslo, while the new building is<br />
being developed further north, in Trondheim. Eventually, Powerhouse<br />
will build more energy-positive buildings in Norway and abroad.<br />
Powerhouse is therefore interested in establishing contact with<br />
anyone who owns projects or possesses the expertise needed to<br />
expand the development of energy-positive buildings.<br />
The Co-creation Program<br />
In 2011, we established the Co-creation Program, which aims at<br />
securing value creation and the voice of technology throughout<br />
<strong>Hydro</strong>’s value chain. Eleven employees from different parts of <strong>Hydro</strong><br />
are educated to contribute to innovation management competence.<br />
The program includes different tools, with participants trained<br />
to support colleagues working in functions such as technology<br />
development, product development and business development.<br />
The participants represent a diverse professional background and<br />
six nationalities. Two of the participants are female. The Co-creation<br />
Program aims to develop healthy and down-to-earth innovative work<br />
practices that can be utilized across <strong>Hydro</strong>.<br />
energy consumption of 12.5 kWh/kg aluminium. We are now<br />
developing this technology further. HALsee – or HAL super<br />
energy efficient – is targeting a maximum of 12 kWh/kg aluminium.<br />
We are emphasizing cell productivity as well as reduced<br />
energy consumption and climate-gas emissions from the production<br />
process.<br />
R&D in our Primary Metal business is important to strengthening<br />
competitiveness by improving the cost position at our metal<br />
plants. Prioritized tasks are operational support, implementation<br />
of new technology in existing activities and the development<br />
of next-generation electrolysis technology. Because energy<br />
constitutes from one-third to half of total production costs,<br />
energy efficiency is one of the most important ways to reduce<br />
costs, while at the same time reducing the climate footprint.<br />
Our casthouses focus on process efficiency in terms of<br />
improved capacity utilization and process capability. The continuous<br />
improvement of product quality is an important part<br />
of our business concept, and is strongly linked to technical<br />
customer service. We develop our products together with customers,<br />
listening to their needs while improving our own casthouse<br />
processes.<br />
Creating something unique<br />
“The Powerhouse Project is a source of inspiration for us, partly<br />
because the project is unusual and partly because the composition<br />
of partners is unusual. Together we have defined a common goal<br />
and everyone has strived to provide good input at an early stage<br />
of the project. Contact with <strong>Hydro</strong>, even before the project was<br />
established, has also provided inspiration. In Norway we lack<br />
experience from these types of projects, but <strong>Hydro</strong> has been able<br />
to deliver this and in doing so has made everyone more certain that<br />
we will actually succeed.”<br />
Ole Gustavsen,<br />
Partner, Snøhetta<br />
Read full interview at www.hydro.com/reporting2011
In 2011, we established an electronic tool named Scrap Portal<br />
to raise competence and efficiency within the organization.<br />
Most remelters are using the portal for all scrap procurement.<br />
The portal is also used to coordinate scrap collection with customer<br />
deliveries. We have planned to finalize the development<br />
of generating management reports that look at various aspects<br />
of our scrap buying in March 2012.<br />
In the area of recycling, we have lifted our budgets even further<br />
as a joint effort between our Metal Markets, Rolled Products<br />
and Extruded Products business areas. This includes funding<br />
for projects related to closed-loop recycling of downstream<br />
products, recycling-friendly alloys and products, upgraded<br />
scrap processing, and furnace technologies that help improve<br />
recycling rates and quality of scrap and metal produced. The<br />
scope of all our recycling-related projects also includes reduction<br />
of total waste and waste sent to landfill. <strong>Hydro</strong> participates<br />
in national and EU-funded projects to support our<br />
ambition as a company and industry.<br />
<strong>Hydro</strong> has embarked on an extensive R&D program to develop<br />
post-consumer scrap-recycling technology following market<br />
demand for products with a low carbon footprint. The R&D<br />
program includes joint projects with external research institutes<br />
such as SINTEf and NTNU in Norway, and RWTH Aachen<br />
in Germany. In 2012, we expect to finalize some projects to<br />
prepare for investments in specific recycling plants.<br />
We also engage in other joint projects. One project is funded<br />
by Norsk forskningsråd: the AlEnergy project on Mass flow<br />
Analysis (MfA), blending tools and melting/refining technology<br />
together with NTNU and SINTEf. There are four BMBf<br />
(German federal Ministry of Research and Education) funded<br />
projects, one with CUTEC in Clausthal-Zellerfeld on SPL<br />
inertization for alternative fuel usage, and three with RWTH<br />
Aachen, covering bio-fuels, alloy recycling and aluminium<br />
recovery from incinerator ashes. Another project with RWTH<br />
Aachen on salt optimization recieves funds from the German<br />
Industrial Research Comittee AIf (Arbeitsgemeinschaft industrieller<br />
forschung).<br />
In Norway we receive support from several public institutions<br />
to further develop our smelter and casthouse technology as<br />
well as downstream activities. These include Enova, The<br />
Research Council of Norway and Innovation Norway. In<br />
2011, we received approximately NOK 42 million from these<br />
institutions, while we were granted NOK 190 million to be<br />
paid out in the years to come if certain projects are implemented,<br />
see also page 52.<br />
Product development<br />
Implementing and commercializing innovative product ideas<br />
and concepts are core activities. Innovation often takes place in<br />
joint projects with the customer once needs have been identified.<br />
Numerous new products are launched every year.<br />
vIABIlItY perForMAnCe<br />
Innovation<br />
69<br />
The carbon footprint of our solutions is gaining increasing<br />
attention and relevance, especially when looking at new applications<br />
of aluminium and when improving the ecological performance<br />
of existing ones. Our approach to involve customers<br />
and key stakeholders in developing better solutions helps us to<br />
differentiate and become the partner of choice. for example,<br />
our Rolled Products business area works with packaging manufacturers<br />
to improve certain packaging material, to provide<br />
high functionality while improving recycling rates.<br />
We also work closely with customers to develop products that<br />
save energy and reduce emissions. Aluminium façades can<br />
lower operating costs and help enable buildings to produce as<br />
much energy as they consume during operation. We have constructed<br />
three such buildings in <strong>Hydro</strong>, in Germany, france<br />
and India. Heat pumps, integrated photovoltaic systems and<br />
intelligent building design all contribute to energy neutrality.<br />
By bringing our building systems operation’s R&D team closer<br />
to product development, we plan to increase sharing and<br />
thereby strengthen the Domal, Wicona, Technal and Alumafel<br />
brand centers, and to increase the speed-to-market of new<br />
products. This includes utilizing competence from our India<br />
unit, where craftsmen come closer to our brands’ range of specialty<br />
products and systems, working mode and overall product<br />
offer. In fact, the operation’s six locations in Europe and<br />
one in India work as if they were in the same location. In addition<br />
to the technical specifications of the products, delivery<br />
time is an important competitive factor. A separate KPI has<br />
been introduced to reduce the elapsed time from project to<br />
product to customer delivery.<br />
Through our Rolled Products business area, we have a strategic<br />
research partnership with the University of Aachen in Germany,<br />
aiming at modeling the entire rolling process chain. An<br />
example of Rolled Products’ innovations in 2011 is the development<br />
of a high-strength alloy that can contain 80-90 percent<br />
of heat exchanger-clad production scrap. The new alloy<br />
has been cast and rolled for seam welding, and the first trial<br />
orders for the automotive industry have been produced.<br />
HyGROSAL is a special aluminium coating that makes rotary<br />
heat exchangers more efficient by allowing a combined transfer<br />
of heat and mass. As a result, less energy is required for e.g. air<br />
conditioning and cooling of industrial buildings and sports<br />
arenas.<br />
Best practice sharing<br />
We strive toward business excellence through continuous<br />
improvement, utilizing people, technology and systems to be<br />
able to generate maximum value for our customers. Through<br />
decentralized power and responsibility, decisions are made by<br />
those best able to take them. Our business systems define the<br />
underlying principles needed to create a performance culture in<br />
a unit. One example is our Aluminium Metal Production System<br />
(AMPS), which is our best practice system and standard for
70<br />
vIABIlItY perForMAnCe<br />
About the reporting<br />
Complete makeover without moving out<br />
When <strong>Hydro</strong> refurbished its 40-year-old Building Systems<br />
headquarters in Milan, Italy, none of the 50 employees had to move<br />
out of the building, and the company avoided the major costs<br />
of renting temporary premises during the renovation period. The<br />
refurbishment was a complete “makeover” where all windows were<br />
replaced and outside insulation and new cladding added, in addition<br />
to an interior upgrade and other modifications. The standard<br />
after refurbishment is almost equal to the level of a new building.<br />
Moreover, the restored building is designed to use at least 20<br />
percent less energy than before. The most important reason for the<br />
savings is the new aluminium windows with external sun-shading<br />
devices, which together with the 14-cm thick extra layer of insulation<br />
in the walls, has resulted in about 60 percent reductions in both<br />
winter heat loss and summer solar gains. The refurbished building<br />
has become a showcase for our building customers.<br />
world-class production and improvement in our primary metal<br />
business. AMPS builds on the principle of empowerment of<br />
each employee.<br />
The production system has been implemented at all our metal<br />
plants, including the joint-venture plants Qatalum and Slovalco.<br />
Our new joint venture, Albras in Brazil, has also started implementing<br />
AMPS as a part of its improvement program based on<br />
<strong>Hydro</strong> technology. Encouraging results have already been<br />
achieved.<br />
All employees in the organization are included in the process,<br />
which involves e-learning, classroom training, on-the-job training<br />
and job observation. AMPS includes an ongoing training<br />
academy, which also includes a leadership development program<br />
for all employees in management or supervisory positions.<br />
So far, 750 managers and supervisors have taken part in the<br />
leadership program, while all employees in the relevant business<br />
areas have participated in different academy training sessions.<br />
Implementation is an important part of our USD 300 per mt<br />
cost-reduction program for primary production.<br />
Our metal markets, extrusion and rolling activities have similar<br />
systems adapted to their business needs.<br />
About the reporting<br />
<strong>Hydro</strong>’s main reporting for 2011 on viability Performance is<br />
included in the <strong>Annual</strong> <strong>Report</strong>. In the web version of the <strong>Annual</strong><br />
<strong>Report</strong>, we have included supplementary information on<br />
reporting principles (scope, definitions, explanation) and our<br />
adherence to the voluntary AA1000 Accountability Principles<br />
Standard (AA1000APS), drawn up by the Institute of Social and<br />
Ethical Accountability. An index referring to the Global <strong>Report</strong>ing<br />
Initiative’s Sustainability <strong>Report</strong>ing Guidelines and a Communication<br />
on Progress report in accordance with the United<br />
Nations Global Compact is also on the Internet, with links to<br />
SuperLightCar<br />
<strong>Hydro</strong> research scientists were involved in the SuperLightCar<br />
Project, which won the InnoMateria Award for its pioneering use of<br />
innovative materials in lightweight vehicle construction. The project<br />
team consisted of 37 leading representatives from research as well<br />
as the automotive and components supply industries from nine<br />
European countries. The SuperLightCar Project investigated how to<br />
best improve the material mix, particularly in the car body. Through<br />
lightweight construction, aluminium offers clear advantages, not only<br />
for sustainable use in large-scale production but also for long-term<br />
environmental impact. In the end, the share of aluminium in the car<br />
body increased to 64 percent of volume, and the vehicle was 35<br />
percent lighter: a weight saving of 100 kilograms. The weight saving<br />
is normally equivalent to a reduction of CO 2 emissions of 10 grams<br />
per km.<br />
the relevant information. The Communication on Progress is<br />
included on page 80.<br />
Principles for reporting on<br />
viability performance<br />
The purpose of <strong>Hydro</strong>’s reporting is to provide stakeholders with<br />
a fair and balanced picture of relevant aspects, engagements,<br />
practices and results for 2011 at a corporate level. We believe<br />
that the reporting in total satisfies this purpose. Our reporting<br />
on viability performance is in accordance with the main reporting<br />
principles of the Sustainability <strong>Report</strong>ing Guidelines from<br />
the Global <strong>Report</strong>ing Initiative and the requirements of the<br />
International Council on Mining and Metals. The selection of<br />
elements reported is based on extensive dialog with stakeholders<br />
and proposals from them. In addition, the reporting builds on<br />
processes that are part of our daily operations. Important stakeholders<br />
include authorities, investors and financial analysts,<br />
employees and their representatives, potential employees, customers,<br />
non-governmental organizations and local communities<br />
affected by major development projects or restructuring processes.<br />
<strong>Report</strong>ing is not necessarily a target of the dialog process,<br />
but when relevant, we use the outcome to improve our reporting,<br />
see page 50.<br />
We believe this approach is consistent with the principles of<br />
inclusiveness, materiality and responsiveness required of reporting<br />
organizations by AA1000APS.<br />
We have endeavored to provide information that is in accordance<br />
with the principles of sound reporting practice. The<br />
absence of generally accepted reporting standards and practices<br />
in certain areas may nevertheless make it difficult to compare<br />
results with reports compiled by other companies, without the<br />
availability of further data, analyses and interpretations.<br />
<strong>Report</strong>ing scope and limitations<br />
The scope of the report is <strong>Hydro</strong>’s global organization for the<br />
period January 1 to December 31, 2011. In general, operations
sold or demerged during the year have not been included. All<br />
consolidated operations that have been part of <strong>Hydro</strong> during<br />
parts of 2011 are still included in our health and safety data for<br />
the period the unit was owned by <strong>Hydro</strong>.<br />
Data relating to health, environment and safety has been prepared<br />
by individual reporting units in accordance with corporate<br />
procedures. This applies to all <strong>Hydro</strong>’s operations, including<br />
consolidated subsidiaries and units for which we have operator<br />
responsibility. This applies if not otherwise stated.<br />
Non-operated, minority-owned operations are not included in<br />
the reported data except for greenhouse gas emissions from<br />
<strong>Hydro</strong>’s ownership equity, as reported on page 51 and 57. In<br />
addition, we include some examples and other qualitative information<br />
that demonstrate how we promote our policies toward<br />
these operations.<br />
It is not the intention to include detailed information that is<br />
primarily of significance for individual sites, processes, activities<br />
and products.<br />
Information in the reporting is based on input from many units<br />
and sources of data. Our emphasis has been to ensure that the<br />
information is neither incomplete nor misleading. However, the<br />
scope of the report, and the varying certainty of data in connection<br />
with diversity and HSE matters, for example, may mean that<br />
there are uncertainties regarding some of the figures reported.<br />
<strong>Hydro</strong>’s acquisition of vale’s aluminium activities was closed on<br />
february 28, 2011. Environmental and financial data relating to<br />
vIABIlItY perForMAnCe<br />
About the reporting<br />
71<br />
this part of the transaction has been included for the entire year<br />
of 2011. Historical environmental data have been recalculated<br />
to reflect current operations. Headcount, safety and work environment<br />
data are included from the closing date.<br />
Assurance principles and scope<br />
We have requested our company auditor to review the information<br />
relating to viability performance in accordance with the<br />
AA1000 Assurance Standard (2008) (AA1000 AS). This is an<br />
assurance standard for this type of reporting, and the review<br />
considers both the accountability principles and performance<br />
information. The review was conducted in accordance with the<br />
international audit standard ISAE 3000 – Assurance Engagements<br />
other than Audits or Reviews of Historical financial<br />
Information. This year, we have adopted a limited level of assurance,<br />
which is deemed as being equal to a moderate level of<br />
assurance as defined by AA1000AS. for the underlying systems,<br />
the reader is referred to <strong>Hydro</strong>’s steering documents as<br />
described under Corporate Governance, see page 123. The<br />
auditor’s review report is presented on page 72. Based on the<br />
AA1000 AS, the auditor comments on our adherence to the<br />
AA1000 APS. We describe our adherence to the AccountAbility<br />
principles in our <strong>Annual</strong> <strong>Report</strong> 2011 on the web, see www.<br />
hydro.com/reporting2011<br />
Learn more:<br />
www.hydro.com/gri<br />
www.hydro.com/globalcompact<br />
www.hydro.com/principles<br />
www.hydro.com/reporting2011
72<br />
vIABIlItY perForMAnCe<br />
Auditor’s Review <strong>Report</strong> on <strong>Hydro</strong> Viability Performance 2011<br />
Auditor’s review report on <strong>Hydro</strong> viability performance 2011<br />
To the readers of <strong>Hydro</strong> Viability Performance 2011:<br />
Introduction<br />
We have been engaged by <strong>Hydro</strong>´s Board of Directors to review the viability Performance presented on page 10-20 and 49-80<br />
in <strong>Hydro</strong>´s <strong>Annual</strong> <strong>Report</strong> 2011 and on <strong>Hydro</strong>´s website www.hydro.com/reporting2011 under the heading viability Performance.<br />
The Board of Directors and Corporate Management Board are responsible for ongoing CSR activities, and for the preparation<br />
and presentation of the viability Performance in accordance with the applicable criteria. Our responsibility is to express a<br />
conclusion on the viability Performance based on our review.<br />
Scope of review<br />
We have performed our review in accordance with ISAE 3000 “Assurance Engagements other than Audits or Reviews of Historical<br />
financial Information” issued by the International Auditing and Assurance Standards Board as well as AA1000 Assurance<br />
Standard (2008), type 2, as issued by AccountAbility. A review consists of making inquiries, primarily of persons responsible for<br />
different sustainability matters and for preparing the viability Performance, and applying analytical and other review procedures.<br />
A review is substantially less in scope than an audit conducted in accordance with International Standards on Auditing and generally<br />
accepted auditing standards in Norway. The procedures performed in a review consequently do not enable us to obtain an<br />
assurance that would make us aware of all significant matters that might be identified in an audit. Accordingly, we do not express<br />
an audit opinion.<br />
Our assurance does not comprise the assumptions used by <strong>Hydro</strong> or whether or not it is possible for <strong>Hydro</strong> to reach certain<br />
future targets described in the report (e.g. goals, expectations and ambitions).<br />
The criteria on which our review is based are the sections of the “Sustainability <strong>Report</strong>ing Guidelines, G3” published by the<br />
Global <strong>Report</strong>ing Initiative (GRI), which are applicable to the viability Performance. We consider these criteria suitable for the<br />
preparation of the viability Performance.<br />
IfAC require us to act in accordance with IfAC Code of Ethics for Professional Accountants. In accordance with AA1000AS (2008),<br />
we confirm that we are independent of <strong>Hydro</strong>. Our review has been performed by a multidisciplinary team specialized in reviewing<br />
economic, environmental and social issues in sustainability reports, and with experience from the industry <strong>Hydro</strong> operates within.<br />
Our review has, based on an assessment of materiality and risk, among other things included the following main procedures:<br />
• An update of our knowledge and understanding of <strong>Hydro</strong>´s organization and activities.<br />
• An assessment of the suitability and application of certain criteria in respect to the information provided to stakeholders.<br />
• Interviews with responsible management, at different levels within the Group, with the aim of assessing whether the<br />
qualitative and quantitative information stated in the viability Performance is complete, correct and sufficient.<br />
• Reading of internal documents to assess whether the information stated in the Viability Performance is complete, correct<br />
and sufficient.<br />
• An evaluation of routines implemented for the collection and reporting of information and data.<br />
• An analytical review of reported information.<br />
• A review of underlying documentation, on a test basis, to assess whether the information and data in the Viability<br />
Performance is accurate.<br />
• Pre-announced visits to <strong>Hydro</strong> facilities located in France, Norway, and Slovakia.<br />
• A review of qualitative information and statements in the Viability Performance.<br />
1) A review provides a limited level of assurance which is deemed as being equal to a moderate level of assurance as defined by AA1000AS.
vIABIlItY perForMAnCe<br />
Auditor’s Review <strong>Report</strong> on <strong>Hydro</strong> Viability Performance 2011<br />
• An assessment of <strong>Hydro</strong>’s self-declared commitment to the ICMM 10 Principles.<br />
• An assessment of <strong>Hydro</strong>’s self-declared application level according to GRI’s guidelines.<br />
• We have gained an overall impression of the Viability Performance, and its format, considering the information’s mutual<br />
conformity with the applicable criteria.<br />
• Reconciliation of the reviewed information with the viability information in the <strong>Hydro</strong> <strong>Annual</strong> <strong>Report</strong> 2011.<br />
Conclusion<br />
Based on our review procedures, nothing has come to our attention that causes us to believe that <strong>Hydro</strong>´s 2011 viability Performance<br />
has not, in all material respects, been prepared in accordance with the above stated criteria and that <strong>Hydro</strong> has not adhered<br />
to the AA1000APS principles inclusivity, materiality and responsiveness to the extent reported on <strong>Hydro</strong>´s website www.hydro.<br />
com/reporting2011 under the heading viability Performance.<br />
Other information<br />
The following is other information that has not affected our conclusion above. The principles inclusivity, materiality and responsiveness<br />
apply to the extent reported in the description on www.hydro.com/reporting2011 under the heading viability Performance<br />
which includes the following points that requires further attention:<br />
• In relation to inclusiveness, <strong>Hydro</strong> will discuss the allocation of resources in certain areas to support the planning of<br />
dialogues and specifically ensure fulfillment in the new operations in Brazil.<br />
• In relation to materiality, the widened scope that comes with new operations means that issues such as biodiversity, waste<br />
treatment as well as traditional peoples and other stakeholder groups have become more important to <strong>Hydro</strong>’s activities.<br />
• In relation to responsiveness, <strong>Hydro</strong> will work to ensure timeliness in responses and work further on implementation in large<br />
projects, new countries and new operations. <strong>Hydro</strong> will stay committed to and have understanding for cultural differences<br />
and that change takes time.<br />
Oslo, March 20, 2012<br />
KPMG AS<br />
Arne frogner Åse Bäckström<br />
State Authorized Accountant Head of Climate Change<br />
& Sustainability Services<br />
73
74<br />
vIABIlItY perForMAnCe<br />
Facts and figures<br />
Facts and figures<br />
Society<br />
for geographical distribution of total assets, investments and revenues, see note 7 in the consolidated financial statements.<br />
Geographical distribution of employees of employees and payroll and payroll<br />
2011 2010 2009 2008 2007 2011 2010 2009 2008 2007<br />
Norway 4 045 4 146 4 421 6 019 7 139 2 692 2 915 3 023 3 757 3 348<br />
Germany 4 352 4 373 4 417 4 553 4 618 1 908 1 950 1 937 1 986 1 983<br />
France 1 437 1 432 1 468 1 785 1 658 516 508 582 581 559<br />
Italy 1 129 1 159 1 211 1 287 1 334 393 365 381 392 388<br />
Great Britain 430 442 453 506 887 134 144 136 168 207<br />
Spain 707 806 1 005 1 051 640 253 260 317 269 231<br />
Poland 159 151 65 188 184 23 24 18 24 16<br />
Austria 430 448 408 415 408 206 209 193 197 213<br />
Slovakia 480 78<br />
Other 1 708 2 228 2 279 2 850 3 436 580 631 773 878 916<br />
Total EU 10 832 11 039 11 306 12 635 13 165 4 091 4 092 4 337 4 495 4 513<br />
Other Europe 80 66 63 81 129 118 89 77 78 89<br />
Total Europe 14 957 15 251 15 790 18 735 20 433 6 901 7 096 7 436 8 330 7 950<br />
USA 1 602 1 497 1 504 1 967 2 519 485 501 585 616 752<br />
Brazil 4 564 459 411 432 419 999<br />
Other Americas 364 769 703 837 803 31 125 87 78 104<br />
Asia 643 833 691 532 487 84 70 58 51 51<br />
Australia 525 544 561 563 490 407 350 302 259 243<br />
Total outside Europe 7 698 4 102 3 870 4 331 4 718 2 006 1 046 1 032 1 003 1 151<br />
Total 22 655 19 353 19 660 23 066 25 151 8 907 8 142 8 468 9 333 9 101<br />
1) Per December 31.<br />
1) Per 31 December<br />
Number of employees 1)<br />
Payroll (NOK million)<br />
The increase in number of employees from 2010 to 2011 is mainly due to the acquisition of vale’s former aluminium business<br />
in Brazil, while restructuring measures elsewhere in the company, especially within <strong>Hydro</strong> Building Systems, had an opposit<br />
effect on the overall level. The reduction in number of employees from 2009 to 2010 are mainly the divestment of our smallest<br />
rolling mill Inasa in Spain, closure of our extrusion plant in Adrian, Michigan, and the cost improvement program in our primary<br />
metal business. During the same period new employees have joined <strong>Hydro</strong>, among other things, through acquisitions in<br />
Spain and Taiwan. Earlier reductions are mainly due to restructuring processes following the financial crises in 2008 and 2009,<br />
and divestment of <strong>Hydro</strong> Polymers to the British company Ineos and <strong>Hydro</strong> Production Partner to the German company Bilfinger<br />
Berger in 2008.
Current income tax tax<br />
vIABIlItY perForMAnCe<br />
Facts and figures<br />
NOK million 2011 2010 2009 2008 2007<br />
Norway 1 256 1 198<br />
Germany 134 98<br />
France 32 47<br />
Italy 15 17<br />
Great Britain 0 - (4)<br />
Spain 0 (1)<br />
Poland 1 3<br />
The Netherlands 3<br />
Austria 26 25<br />
Slovakia 129<br />
Other 34 140<br />
Total EU 374 329<br />
Switzerland 24<br />
Other Europe 1 3<br />
Total Europe 1 655 1 529<br />
USA 4 (1)<br />
Canada 89<br />
Brazil 102<br />
Other Americas 7 93<br />
Africa 0<br />
Asia 7 5<br />
Australia and New Zealand 28 27<br />
Total outside Europe 237 123<br />
Total 1 892 1 652<br />
People<br />
Diversity in management 1)<br />
Diversity in management<br />
Board of directors (10 members) 1)<br />
Women<br />
568<br />
35<br />
34<br />
32<br />
7<br />
20<br />
17<br />
141<br />
1 002<br />
230<br />
68<br />
63<br />
(13)<br />
- 3<br />
4<br />
713<br />
11<br />
19<br />
4<br />
(44)<br />
(10)<br />
703<br />
45<br />
80<br />
476<br />
75<br />
1 602<br />
485<br />
113<br />
70<br />
- (10)<br />
5<br />
1 483<br />
(42)<br />
196<br />
3<br />
178<br />
335<br />
1 818<br />
Non-Norwegians<br />
39<br />
1<br />
38<br />
252<br />
988<br />
18<br />
2 608<br />
16<br />
230<br />
-<br />
389<br />
559<br />
3 167<br />
2011 2010 2009 2008 2007 2011 2010 2009 2008 2007<br />
30% 33% 33% 33% 33% 20% 11% - - -<br />
Corporate assembly 33% 33% 33% 33% 28% - - - - -<br />
Corporate management board 20% 20% 18% 22% 13% 20% 20% 9% - -<br />
Top 50 managers 19% 21% 19% 19% 17% 27% 25% 22% 13% 13%<br />
Top 200 managers 18% 16% 18% 17% 16% 50% 43% 45% 35% 32%<br />
1) Three of the board members are employee representatives. All are men. Tito Martins Jr. joined the board of directors in February 2010 as a 10th board member.
76<br />
vIABIlItY perForMAnCe<br />
Facts and figures<br />
Diversity in Norway<br />
Women and men at different levels<br />
Women and men at different levels 1)<br />
Women<br />
Men<br />
2011 2010 2009 2008 2007 2011 2010 2009 2008 2007<br />
Managers 20% 20% 20% 21% 19% 80% 80% 80% 79% 81%<br />
Salaried employees 31% 32% 41% 44% 43% 69% 68% 59% 56% 57%<br />
Hourly paid 13% 12% 12% 13% 11% 87% 88% 88% 87% 89%<br />
Total 18% 19% 19% 19% 18% 82% 81% 81% 81% 82%<br />
An adjustment in the wage system in 2010 moved a large number of technical positions, including first line supervisors, from<br />
hourly paid to salaried employees. The greater proportion of them are men, causing a significant increase in the proportion of<br />
men in the category salaried employees. The change had only limited consequences to the salary level.<br />
Recruitment<br />
Recruitment<br />
Women<br />
Men<br />
2011 2010 2009 2008 2007 2011 2010 2009 2008 2007<br />
Managers 30 % - 29% 33% 19% 70% 100% 71% 67% 81%<br />
Salaried employees 13 % 35% 29% 51% 46% 87% 65% 71% 49% 54%<br />
Hourly paid 14 % 16% 5% 21% 17% 86% 84% 95% 79% 83%<br />
Total 19 % 20% 21% 30% 22% 81% 80% 79% 70% 78%<br />
About 80 persons were employed in 2011 compared to 100 persons in 2010.<br />
Part-time employees in Norway<br />
Part-time employees in Norway<br />
2011 2010 2009 2008 2007<br />
Women 11% 4.8% 10% 12% 14%<br />
Men 1.9% 0.4% 1.5% 2.0% 1.4%<br />
<strong>Hydro</strong> employees normally work full-time. The opportunity to work part-time is considered a benefit for which a special<br />
application must be made.<br />
Health and safety<br />
Health and safety<br />
2011 2010 2009 2008 2007<br />
Total recordable injuries (TRI) employees 1)<br />
Employees 3.8 3.7 2.9 3.9 4.1<br />
Contractors<br />
Lost-time injuries (LTI)<br />
2.6<br />
1)<br />
Employees 2.0 1.9 1.7 2.0 2.0<br />
Contractors 1.0 0.4 0.4 0.9 1.9<br />
Total fatal accident rate 2)<br />
3.2 2.4 2.8 2.8 2.5<br />
Fatality rate, employees 2)<br />
1.4 2.1 1.5 1.7 1.2<br />
Fatality rate, contractors 2)<br />
5.9 3.1 5.2 6.1 6.3<br />
Total number of fatal accidents 3 0 3 3 2<br />
Number of fatal accidents, employees 1 0 0 2 0<br />
Number of fatal accidents, contractors 2 0 3 1 2<br />
Sick leave, percent 3.1 3.3 3.7 3.4 2.8<br />
1) Per million working hours. The numbers include discontinued operations.<br />
2) Per 100 million working hours, five-year rolling average
Environment<br />
Greenhouse gases gases<br />
VIABILITY PERFORMANCE<br />
Facts and figures<br />
Million metric tons CO2e 2011 2010 2009 2008 2007<br />
CO 2 7.0056 7.2887 7.1183 7.0554 6.0915<br />
CH 4 0.0001 0.0001 0.0002 0.0001 0.0001<br />
N 2O 0.0003 0.0003 0.0002 0.0000 0.0000<br />
PFC 0.3049 0.3975 0.5400 0.9575 0.9724<br />
Total 7.3109 7.6866 7.6586 8.0129 7.0639<br />
The reductions of climate gas emissions from 2008 was a result of process improvements and reduced production in our consolidated<br />
activities. The reduction in PFC emissions mainly resulted from the closure of Søderberg production at Karmøy, Norway<br />
in 2009, as well as improved operations. Greenhouse gas emissions include plants owned more than 50 percent by <strong>Hydro</strong>. The<br />
increase from 2007 to 2008 followed the last expansion of Alunorte.<br />
Greenhouse gas gas emissions emissions from from <strong>Hydro</strong>`s <strong>Hydro</strong>`s ownership ownership equity equity<br />
Million metric tons CO2e 2011 2010 2009 2008 2007<br />
Bauxite & Alumina 3.4 3.5 3.5 2.8 2.0<br />
Metal production 3.7 3.7 3.4 4.5 4.5<br />
Downstream production 0.3 0.3 0.3 0.3 0.4<br />
Remelters 0.1 0.1 0.1 0.1 0.1<br />
Electricity generation 7.3 6.2 5.3 6.4 7.6<br />
Total 14.9 13.8 12.5 14.2 14.5<br />
Greenhouse gas emissions based on <strong>Hydro</strong>’s ownership equity as per December 31, 2011. Emissions from electricity generation<br />
are based on electricity consumption and IEA “CO2 Emissions from Fuel Combustion” 2008 factors. These emissions include<br />
1.9 million metric tons from <strong>Hydro</strong>’s ownership equity in the Qatalum owned gas-fired power plant in Qatar. The power plant<br />
reached full capacity during 2011.<br />
Energy consumption (PJ, Ownership >50%)<br />
PJ 2011 2010 2009 2008 2007<br />
Coal 19.0 18.9 15.1 10.8 0.9<br />
Coke 19.7 19.6 13.1 20.7 21.4<br />
Electricity 96.5 94.3 93.3 116.0 117.4<br />
Natural gas 10.5 11.1 9.9 10.9 10.5<br />
Natural gas liquids 1.4 1.4 1.3 1.6 2.2<br />
Oil 26.4 27.3 30.2 26.0 27.4<br />
Other 4.7 4.8 3.3 5.9 5.6<br />
Total 178.2 177.5 166.3 191.8 185.3<br />
Energy consumption per sector per sector (PJ, Ownership >50%)<br />
PJ 2011 2010 2009 2008 2007<br />
Bauxite and Alumina 47.6 47.4 45 38.4 31.5<br />
Electrolysis/Carbon/Casting 114.5 114.3 107.1 136.5 136.2<br />
Extrusion, Building System, Automotive 4.3 4.3 3.8 4.3 4.8<br />
Remelt 2.4 2.5 2.0 2.2 2.2<br />
Rolled Products 5.6 5.7 5.2 5.7 6.0<br />
Other 3.7 3.3 3.0 4.7 4.6<br />
Total 178.2 177.5 166.1 191.8 185.3<br />
77
78<br />
VIABILITY PERFORMANCE<br />
Facts and figures<br />
Resource use<br />
Resource use<br />
1,000 metric tons 2011 2010 2009 2008 2007<br />
Alumina 3 114 3 032 3 108 3 733 3 427<br />
Aluminium fluoride 28 27 28 37 38<br />
Aluminium <strong>Hydro</strong>xide 1)<br />
100 87<br />
Lime 61 65 58 38 31<br />
Natrium hydroxide 665 630 569 498 435<br />
Sulphuric acid 17 14 12 12 9<br />
Other emissions<br />
Metric tons 2011 2010<br />
Dust and particles 2 931.8 3 362.6<br />
Fluorides to air 548.4 598.7<br />
NM VOC 390.0 406.9<br />
Nitrogen oxide (NOx) 9 037.3 9 130.0<br />
PAH to air 8.8 6.2<br />
PAH to water 0.4 0.7<br />
Sulphur dioxide to air 29 356.1 30 438.9<br />
PAH to air is according to NS 16 PAH and to water is according to Borneff 6 PAH. <strong>Hydro</strong> did not emit ozone depleting substances<br />
from its production processes in 2010.<br />
Water consumption<br />
Million m 3 2011 2010<br />
Argentina 0.0459 0.0331<br />
Australia 0.1881 0.2145<br />
Austria 0.0026 0.0117<br />
Belgium 0.0525 0.0511<br />
Brazil 36.4632 39.9125<br />
Canada 0.0569 0.0843<br />
China 0.0372 0.0313<br />
Denmark 0.0496 0.0491<br />
France 0.2781 0.3010<br />
Germany 1.5332 1.7933<br />
Italy 1.2737 1.3423<br />
Luxembourg 0.0730 0.0711<br />
Malaysia 0.0325 0.0341<br />
Mexico 0.0194 0.0143<br />
Norway 49.6953 48.8536<br />
Poland 0.0071 0.0095<br />
Portugal 0.0403 0.0476<br />
Slovakia 0.2024 0.1657<br />
Spain 0.2187 0.1886<br />
Taiwan 0.0301<br />
United Kingdom 0.0854 0.0849<br />
United States 0.3912 0.4174<br />
Total 90.7763 93.7108<br />
The systematic mapping of our water situation in 2011 showed that about 3 percent of our overall water input came from waterstressed<br />
areas, with regard to annual renewable water supply (according to the definition used by WBCSD).
Total waste<br />
vIABIlItY perForMAnCe<br />
Facts and figures<br />
1000 metric tons 2011 2010<br />
Spent potlining 25 35<br />
Other hazardous waste 141 145<br />
Bauxite redsidue (red mud) 6 389 6 222<br />
Tailings 5 864 4 933<br />
Other Waste 295 242<br />
Total 12 713 11 577<br />
Bauxite residue and tailings increased due to increase in production volumes.<br />
Waste treatment hazardous and other waste<br />
Waste treatment hazardous and other waste<br />
79<br />
2011 2010<br />
Energy recovery 3% 4%<br />
Landfill 40% 44%<br />
Other treatment 21% 17%<br />
Reuse/recycling 36% 36%<br />
Tailings Combustion and without bauxite energy residue recovery are is deposited included under in landfills Other treatment. and are not included in the table above. Combustion without energy recovery<br />
is included under Other treatment.<br />
financial provisions<br />
Provisions for future environmental clean-up measures amounted to NOK 284 million as of December 31, 2011, while asset<br />
retirement obligations constituted NOK 1,549 million. The latter includes costs related to disposal of spent potlining, closures<br />
of mines and bauxite residue (red mud) deposits, and Norwegian power plant concessions to be reverted to the Norwegian government.<br />
See also Note 31 in the consolidated financial statements.
80<br />
vIABIlItY perForMAnCe<br />
Global reporting initiative<br />
GrI index<br />
We use the Global <strong>Report</strong>ing Initiative’s (GRI) G3 guidelines for voluntary reporting of sustainable development. The guidelines<br />
comprise economic, environmental and social dimensions relating to an enterprise’s activities, products and services. GRI collaborates<br />
with the United Nations Environment Programme and UN Global Compact.<br />
We believe in all material respects that our reporting practice is consistent with GRI’s reporting principles. We report according<br />
to a B+ level as defined by the GRI G3 guidelines, and include the GRI Mining & Metals supplement in our reporting. This has<br />
been confirmed by our external auditor KPMG, see page 72. An electronic version of the GRI Index, including the full definition<br />
of each indicator and references to specific sections in this report as well as additional information, can be found on www.hydro.<br />
com/gri<br />
un Global Compact Communication on progress<br />
We support the principles of the UN Global Compact. Human rights, international labor standards, working against corruption,<br />
and environmental considerations are fundamental to our approach to corporate responsibility.<br />
The Global Compact was formed at the initiative of the former UN Secretary General, Kofi Annan, in 1999, because the UN<br />
wants business and industry to be more closely associated with the UN’s work. Companies that sign the Global Compact agree<br />
to support 10 principles regarding human rights, labor standards, the environment, and the countering of corruption, and to<br />
communicate annually on progress.<br />
<strong>Hydro</strong> has played an active role in the Global Compact since its formation. Our commitment is expressed by the President &<br />
CEO in his letter to shareholders on page 6 of this report. The table below provides a summary of our progress in relation to the<br />
Compact’s 10 principles. A more complete report can be found at www.hydro.com/globalcompact<br />
Page<br />
Human rights<br />
Principle 1 Support and respect the protection of internationally proclaimed human rights 7, 10-11, 16, 18, 56-62<br />
Principle 2 Make sure not to be complicit in human rights abuses 56-62<br />
Labor standards<br />
Principle 3 Uphold the freedom of association and the effective recognition of the right to collective bargaining 18, 56-62<br />
Principle 4 Elimination of all forms of forced and compulsory labor 18, 56-57<br />
Principle 5 Effective abolition of child labor 18, 56-57-<br />
Principle 6 Eliminate discrimination in respect of employment and occupation 10-11, 18, 56-62<br />
Environment<br />
Principle 7 Support a precautionary approach to environmental challenges 7, 10-11, 16-17, 50-56, 60, 67-69<br />
Principle 8 Undertake initiatives to promote greater environmental responsibility 7, 10-11, 16-17, 50-56, 60, 67-69<br />
Principle 9 Encourage the development and diffusion of environmentally friendly technologies 7, 10-11, 16-17, 50-56, 60, 67-69<br />
Anti-corruption<br />
Principle 10 Work against all forms of corruption, including extortion and bribery 7, 10-11, 18, 56-57, 59
81<br />
FInAnCIAl AnD operAtInG perForMAnCe FInAnCIAl AnD operAtInG perForMAnCe<br />
Edit...<br />
Index<br />
Underlying EBIT<br />
NOK million 2011 2010<br />
Bauxite & Alumina 887 633<br />
Primary Metal 2 486 617<br />
Metal Markets 441 321<br />
Rolled Products 673 864<br />
Extruded Products 151 444<br />
Energy 1 883 1 416<br />
Other and eliminations (389) (945)<br />
Underlying EBIT 6 133 3 351<br />
Liquidity and financial position<br />
Liquidity and financial position<br />
NOK million<br />
NOK million<br />
60,000<br />
50,000<br />
40,000<br />
30,000<br />
20,000<br />
10,000<br />
0<br />
-10,000<br />
Net cash<br />
provided by<br />
operating<br />
activities<br />
Liquid<br />
assets<br />
03:<br />
Financial and operating performance<br />
Bank loans<br />
and other<br />
interest-bearing<br />
short-term debt<br />
Long-term<br />
debt<br />
Net interest<br />
bearing (debt)<br />
assets<br />
2011<br />
Investments<br />
2010<br />
financial and operating review p.82<br />
Liquidity and capital resources p.101<br />
Additional information p.105<br />
QuICK overvIew<br />
<strong>Hydro</strong> had underlying EBIT of NOK 6,133 million in 2011 compared<br />
with NOK 3,351 million in the previous year. The improvement was<br />
driven by higher realized alumina and aluminium prices and higher<br />
production, mainly due to the Vale Aluminium acquisition. Underlying<br />
results for <strong>Hydro</strong>’s downstream operations were impacted by<br />
weaker markets.<br />
We delivered 3.3 million metric tons of casthouse products to<br />
internal and external customers from casthouses that are integrated<br />
with our primary aluminium plants, and from remelt facilities close to<br />
our customers in Europe and the United States.<br />
In 2011, we shipped approximately 930,000 mt of rolled products<br />
from six European plants and our plant in Malaysia. Our network of<br />
extrusion plants delivered about 535,000 mt of extruded products.<br />
Our energy business produced around 9.6 TWh of hydroelectric<br />
power during the year.<br />
In 2011, cash provided by operating activities increased to<br />
NOK 7.3 billion from NOK 6.4 billion in the previous year. In addition<br />
to operating and investing activities, the main use of cash related to<br />
the Vale Aluminium acquisition.<br />
81
82<br />
FINANCIAL AND OPERATING PERFORMANCE<br />
Financial and operating review<br />
Financial and operating review<br />
Summary of financial and operating results<br />
Key financial information<br />
NOK million, except per share data<br />
Revenue 91 444 75 754<br />
Earnings before financial items and tax (EBIT) 9 827 3 184<br />
Items excluded from underlying EBIT 1)<br />
(3 694) 167<br />
Underlying EBIT 6 133 3 351<br />
Underlying EBIT :<br />
Bauxite & Alumina 887 633<br />
Primary Metal 2 486 617<br />
Metal Markets 441 321<br />
Rolled Products 673 864<br />
Extruded Products 151 444<br />
Energy 1 883 1 416<br />
Other and eliminations (389) (945)<br />
Underlying EBIT 6 133 3 351<br />
Underlying EBITDA 11 152 6 420<br />
Net income (loss) 6 749 2 118<br />
Underlying net income (loss) 3 947 1 852<br />
Earnings per share 2)<br />
Underlying earnings per share 2)<br />
Financial data:<br />
Year<br />
2011<br />
Year<br />
2010<br />
3,41 1,33<br />
1,89 1,14<br />
Investments 48 025 6 231<br />
Adjusted net interest-bearing debt 3)<br />
1) See section, Items excluded from underlying EBIT and net income, for more information on these items.<br />
(19 895) (6 427)<br />
2) Earnings per share and Underlying earnings per share are computed using Net income and Underlying net income attributable to <strong>Hydro</strong> shareholders, and<br />
using the weighted average number of ordinary shares outstanding, adjusted for the discount element in the rights issue completed in July 2010. There were<br />
no significant diluting elements.<br />
3) Calculation is based on amounts as of the end of the periods presented. See note 35 Capital Management in <strong>Hydro</strong>'s consolidated financial statements for<br />
a discussion on net interest-bearing debt definitions.<br />
Underlying EBIT increased to NOK 6,133 million compared with NOK 3,351 million in 2010. Higher realized alumina and<br />
aluminium prices and higher production volumes, mainly due to the Vale Aluminium acquisition, had a positive effect on<br />
developments for the year. <strong>Hydro</strong>'s new business area, Bauxite & Alumina, achieved significant improvements in operational<br />
stability and capacity utilization during 2011. Paragominas, achieved record production in 2011. However, underlying results<br />
for our new business area were not satisfactory for the full year. Cost and other improvements in Primary Metal amounted to<br />
roughly NOK 1 billion compared to 2009 operating cost levels. This was more than offset, however, by higher prices for key<br />
raw materials, including power, carbon and alumina. Qatalum reached full capacity in the third quarter of 2011, following the<br />
significantly delayed ramp-up due to the power outage in 2010. Underlying results for <strong>Hydro</strong>'s downstream operations were<br />
impacted by weaker markets, in particular for our European extrusion and building systems operations. Underlying EBIT for<br />
our Energy business increased in 2011, mainly due to higher production. See discussion in following section on developments<br />
in underlying EBIT for each business area for further information.<br />
During 2011, there has been a significant increase in uncertainty regarding global economic developments, and in Europe in<br />
particular. Cost pressure has increased for the aluminium industry in general. The negative effects have been exacerbated by a<br />
decline in LME prices to relatively weak levels.
FINANCIAL AND OPERATING PERFORMANCE<br />
Summary of financial and operating results<br />
Due to deteriorating market conditions in the second half of 2011 and ongoing cost pressures, <strong>Hydro</strong> wrote down fixed assets<br />
by NOK 1.3 billion in the fourth quarter of 2011. These charges are excluded from underlying results. Approximately NOK 1<br />
billion of the write down relates to assets in the Kurri Kurri plant. Of the remainder, about NOK 230 million relates to<br />
<strong>Hydro</strong>'s building systems operation in Southern Europe. In addition, <strong>Hydro</strong> wrote down approximately NOK 300 million of<br />
deferred tax assets related to its operations in Australia and Southern Europe.<br />
Responding to market developments, <strong>Hydro</strong> has reduced remelt production and strengthened its focus on improvement<br />
programs and financial discipline. In January 2012, <strong>Hydro</strong> decided to curtail 60,000 mt of production at its Kurri Kurri<br />
aluminium smelter, which has been negatively impacted by low aluminium prices, increased raw material costs and the strong<br />
Australian dollar. Further production efficiency and cost reduction initiatives have been implemented across <strong>Hydro</strong>'s<br />
downstream operations. This includes measures to turn around our Building Systems business, targeting annual cost<br />
improvements of EUR 40 million by the end of 2012 compared with 2010.<br />
During the year, <strong>Hydro</strong> divested its non-strategic ownership interest in the Norwegian power production company SKS<br />
Produksjon AS, resulting in a tax free gain of NOK 658 million. <strong>Hydro</strong> also divested its interest in the Alpart alumina refinery<br />
in Jamaica, resulting in an after tax gain of NOK 465 million.<br />
Operating cash flow amounted to NOK 7.3 billion for the year. Net cash used for investment activities amounted to NOK 8.8<br />
billion, including NOK 5.8 billion for the acquisition of Vale Aluminium. At the end of 2011, <strong>Hydro</strong>'s net cash position was<br />
NOK 1.7 billion.<br />
<strong>Hydro</strong>'s Board of Directors proposes to pay a dividend of NOK 0.75 per share for 2011, reflecting the company's strong<br />
commitment to provide a cash return to its shareholders. The dividend reflects our operational performance for 2011 and a<br />
strong financial position, also taking into consideration the uncertain market outlook.<br />
<strong>Report</strong>ed EBIT and Net income<br />
Following is a summary discussion of <strong>Hydro</strong>'s reported EBIT and reported net income. See section on "Underlying EBIT -<br />
Business areas" for a discussion on the performance of our business operations and section on "Items excluded from underlying<br />
EBIT and net income" for more information regarding the effects described below.<br />
<strong>Report</strong>ed EBIT for <strong>Hydro</strong> amounted to NOK 9,827 million compared with NOK 3,184 million in 2010. <strong>Report</strong>ed EBIT<br />
included negative effects of NOK 211 million from unrealized gains and losses relating to LME, power, currency and raw<br />
material derivative contracts, and metal effects in our Rolled Products business area. In 2010, the corresponding effects<br />
amounted to a negative NOK 166 million. The magnitude of these recurring effects depends on changes in market values,<br />
which have been significant.<br />
Other significant items impacting reported EBIT include gains and losses and other cost and charges that are typically nonrecurring<br />
for individual plants or operations. These included rationalization and impairment charges, amounting to NOK<br />
1,607 million and NOK 317 million for 2011 and 2010, respectively, together with divestment gains of NOK 1,184 million<br />
in 2011 and divestment gains of NOK 74 million in 2010. These also included effects relating to the Vale Aluminium<br />
acquisition, amounting to NOK 4,328 million in 2011, and other items amounting to a net positive effect of NOK 242<br />
million in 2010.<br />
<strong>Report</strong>ed net income amounted to NOK 6,749 million in 2011, compared with NOK 2,118 million in 2010 including net<br />
foreign currency losses of NOK 971 million in 2011 and net foreign currency gains of NOK 513 million in 2010. The<br />
currency gains in 2010 mainly related to intercompany balances denominated in Euro. These items have no cash effect and are<br />
offset in equity by translation of the corresponding subsidiaries during consolidation. Corresponding net currency gains in<br />
2011 amounted to NOK 27 million.<br />
83
84<br />
FINANCIAL AND OPERATING PERFORMANCE<br />
Operational overview<br />
Operational overview<br />
Key Operational information 4)<br />
Year<br />
2011<br />
Year<br />
2010<br />
% change<br />
prior year<br />
Alumina production (kmt) 5 264 1 976 >100 %<br />
Primary aluminium production (kmt) 1 982 1 415 40 %<br />
Realized aluminium price LME (USD/mt) 5)<br />
2 480 2 113 17 %<br />
Realized aluminium price LME (NOK/mt) 5)<br />
13 884 12 674 10 %<br />
Realized NOK/USD exchange rate 5,60 6,00 (7) %<br />
Metal Markets sales volumes to external market (kmt) 6)<br />
2 091 1 717 22 %<br />
Rolled Products sales volumes to external market (kmt) 929 945 (2) %<br />
Extruded Products sales volumes to external market (kmt) 536 529 1 %<br />
Power production (GWh) 9 582 8 144 18 %<br />
4) Amounts include <strong>Hydro</strong>'s proportionate share of production and prices in equity accounted investments.<br />
5) Including the effect of strategic LME hedges (hedge accounting applied).<br />
6) Excluding ingot trading volumes.<br />
Bauxite & Alumina<br />
Bauxite & Alumina generated total revenues of about NOK 14.5 billion in 2011. Bauxite production in Paragominas reached<br />
record levels amounting to 7.1 million mt since the acquisition date (8.2 million mt for the year). Alumina production from<br />
Alunorte amounted to 5.3 million mt (5.8 million mt for the year). Bauxite & Alumina sourced roughly 2 million mt of<br />
alumina in 2011. The business area employs around 2,900 people.<br />
Primary Metal<br />
Primary Metal generated about NOK 35 billion in total revenues in 2011. Production of electrolysis metal amounted to 2<br />
million mt, from our plants in Australia, Brazil, Canada, Germany, Norway, Qatar and Slovakia. We delivered 2.5 million mt<br />
of casthouse products to internal and external customers, from casthouses which are integrated with our primary aluminium<br />
plants. Deliveries included about 0.9 million mt of extrusion ingot, 0.5 million mt of sheet ingot and 0.5 million mt of<br />
foundry alloys and wire rod. We also sold about 0.6 million mt of standard ingot. The business area employs around 5,100<br />
people.<br />
Metal Markets<br />
Metal Markets generated total revenues of around NOK 49 billion in 2011. The business area employs around 700 people at<br />
plants and offices in Asia, Europe and North America. Our six remelters in Europe, two in the U.S. and one in Asia, produced<br />
approximately 600,000 mt of metal products in 2011. We sold 3.3 million mt of metal products last year, including deliveries<br />
from the casthouses integrated with our primary smelters. Of this figure, we sold approximately 2 million mt to external<br />
customers.<br />
Rolled Products<br />
Rolled Products generated total revenues of approximately NOK 21 billion in 2011. The business area has locations in 12<br />
countries, and employs about 4,000 people. In 2011, we shipped approximately 930,000 mt of rolled products from six<br />
European plants and our plant in Malaysia.<br />
Extruded Products<br />
Extruded Products had total revenues of approximately NOK 20 billion from the sale of aluminium products in 2011. The<br />
business area employs around 9,500 people. Our network of extrusion plants, including those dedicated to building systems,<br />
delivered 536,000 mt of extruded products. About 75 percent of our total extrusion revenues came from our general extrusion<br />
and tubing businesses and 25 percent came from our building systems operations.<br />
Energy<br />
Energy generated about NOK 6.4 billion in total revenues in 2011. The business area employs around 200 people, mainly in<br />
Norway. We produced 9.6 TWh of renewable hydroelectric power, slightly above annual normal production. Production<br />
during 2011 was impacted by high precipitation during the second half of the year, resulting in a strongly improved<br />
hydrological balance at year-end.
Market developments and outlook<br />
Market statistics 1)<br />
Year<br />
2011<br />
Year<br />
2010<br />
% change<br />
prior year<br />
NOK/USD Average exchange rate 5.61 6.05 (7) %<br />
NOK/USD Balance sheet date exchange rate 5.99 5.86 2 %<br />
NOK/EUR Average exchange rate 7.79 8.01 (3) %<br />
NOK/EUR Balance sheet date exchange rate 7.75 7.81 (1) %<br />
Bauxite & Alumina:<br />
Alumina price Platts PAX FOB Australia (USD/t) 2)<br />
375 339 11 %<br />
Global production of alumina (kmt) 90 040 81 843 10 %<br />
Global production of alumina (ex. China) (kmt) 54 129 52 478 3 %<br />
Primary Metal and Metal Markets:<br />
LME three month average (USD/mt) 2 420 2 199 10 %<br />
LME three month average (NOK/mt) 13 539 13 257 2 %<br />
Global production of primary aluminium (kmt) 45 538 41 936 9 %<br />
Global consumption of primary aluminum (kmt) 44 876 40 962 10 %<br />
Global production of primary aluminium (ex. China) (kmt) 26 385 24 969 6 %<br />
Global consumption of primary aluminum (ex. China) (kmt) 25 607 24 129 6 %<br />
<strong>Report</strong>ed primary aluminium inventories (kmt) 6 942 6 338 10 %<br />
Rolled Products and Extruded Products:<br />
Consumption Rolled Products Europe (kmt) 4 477 4 268 5 %<br />
Consumption Rolled Products USA & Canada (kmt) 4 144 4 072 2 %<br />
Consumption Extruded Products Europe (kmt) 3 045 2 978 2 %<br />
Consumption Extruded Products USA & Canada (kmt) 1 289 1 362 (5) %<br />
Energy:<br />
FINANCIAL AND OPERATING PERFORMANCE<br />
Market developments and outlook<br />
Southern Norway spot price (NO2) (NOK/MWh) 360 407 (12) %<br />
Nordic system spot price (NOK/MWh) 367 426 (14) %<br />
1) Industry statistics have been derived from analyst reports, trade associations and other public sources unless otherwise indicated. Recent information is<br />
based partly on estimates and is subject to revision as new information becomes available. As a result, differences between general market developments<br />
and actual <strong>Hydro</strong> volumes are not necessarily indicative of significant changes in market share. Amounts presented in prior reports may have been restated<br />
based on updated information. Currency rates have been derived from Norges Bank.<br />
2) The daily Platts alumina index was established in August 2010. The average monthly CRU Australian spot price is used as a reference prior to the third<br />
quarter of 2010.<br />
Bauxite and alumina<br />
The alumina market was relatively strong in the beginning of 2011 with increased demand and production due to the ramp up<br />
of new primary aluminium capacity and start up of new alumina projects. The Platts alumina spot prices started the year at<br />
USD 372 per mt, reaching a peak in April/May, with prices over USD 400 per mt. Prices declined at the end of the year to<br />
USD 305 per mt. Spot prices ranged between 15 and 17 percent of the LME price during 2011. 3)<br />
During 2011, China continued to increase its domestic alumina production from around 29 million mt in 2010 to 34 million<br />
mt in 2011. Imports of alumina fell from 4.2 million mt in 2010 to 1.9 million mt in 2011.<br />
China imported more than 45 percent of its requirements for domestic alumina production. Bauxite imports into China<br />
increased from 30 million mt in 2010 to 45 million mt in 2011. <strong>Annual</strong>ized bauxite imports into China in November 2011<br />
reached a record level of 54 million mt.<br />
3) Due to existing sales contracts, <strong>Hydro</strong> has limited volumes available for sale for the next few years. As a result, short-term alumina market developments<br />
have limited influence on <strong>Hydro</strong>'s earnings for the period.<br />
85
86<br />
FINANCIAL AND OPERATING PERFORMANCE<br />
Primary aluminium<br />
Primary aluminium<br />
Three-month LME aluminium prices were relatively strong in the first half of the year, averaging about USD 2,570 per mt<br />
compared with an average of USD 2,270 per mt in the second half of 2011. Prices were volatile, reaching a peak above USD<br />
2,700 per mt in early May, and ending the year around USD 2,000 per mt.<br />
Global demand for primary aluminium (excluding China) increased compared to 2010. Corresponding production also<br />
increased, mainly due to new greenfield smelters in the Middle East and Asia. <strong>Annual</strong>ized production was relatively stable in<br />
the final quarter of 2011, amounting to 26.6 million mt. <strong>Annual</strong>ized consumption declined, however, amounting to 24.7<br />
million mt. Recent announcements of smelter closures and limited new capacity coming on stream are expected to improve the<br />
supply demand balance in 2012. Demand for primary aluminium is expected to grow by about 3-5 percent in 2012. However,<br />
market sentiment continues to be influenced by significant economic uncertainty.<br />
Demand in China increased around 15 percent in 2011, from 16.8 million mt in 2010 to 19.3 million mt in 2011. The<br />
market for primary metal was largely balanced in China throughout 2011, and we expect this to continue in 2012.<br />
LME stocks increased gradually from 4.3 million mt at the end of 2010 to around 5 million mt at the end of 2011. The<br />
majority of the metal in warehouses continues to be owned by financial investors. Global inventories, including unreported<br />
inventories, were estimated to be around 12 million mt at the end of 2011.<br />
Demand for most metal products (extrusion ingot, sheet ingot, foundry alloys and wire rod) in Europe weakened during the<br />
year. North American demand was stronger in general. Demand for foundry alloys continued to be strong in Northern Europe<br />
and in Germany in particular, and also improved in Asia.<br />
Rolled products<br />
European demand for flat rolled products was somewhat higher compared to 2010, as most markets improved in the first half<br />
of 2011. However, demand weakened in the second half of 2011, impacted by customer destocking and weak markets in<br />
general as a result of increasing economic uncertainty in Europe, and in Southern Europe in particular. Chinese exports into<br />
Europe fell during the second half of 2011 as a result of the weaker markets.<br />
Developments varied across the different market sectors. Demand within the automotive segment demonstrated a strong<br />
growth influenced by the robust demand for premium cars in China and the ongoing substitution of steel by aluminium in the<br />
manufacturing process. The building and construction segment remained weak during the year while demand for foil<br />
applications declined. Demand for the beverage can segment was strong throughout 2011. Demand for general engineering<br />
applications declined significantly, driven by destocking activities at distributors and end-users and somewhat weaker industrial<br />
demand, resulting in pressure on margins for this market segment towards the end of the year.<br />
Economic and market developments for 2012 are uncertain with low visibility. However, certain leading indicators are positive.<br />
Extruded products<br />
In Europe, demand for extruded aluminium products increased slightly compared to last year. Demand was higher for most<br />
market segments in Northern Europe, but somewhat lower in Southern Europe. In North America, demand fell compared to<br />
2010. However, shipments from domestic extruders increased due to the implementation of anti-dumping duties on Chinese<br />
exports. Growth in South American extrusion demand slowed compared to 2010, but continued to be positive, particularly in<br />
Argentina. Demand in the automotive market improved during the year for all geographical regions except Europe, supported<br />
by strong economic growth and robust demand from emerging markets.<br />
European demand for extruded aluminium products is expected to decline in 2012, with the building and construction market<br />
continuing as the weakest end use market segment. Outside of Europe, the market outlook is positive, within the automotive<br />
and transport segments in particular.
FINANCIAL AND OPERATING PERFORMANCE<br />
Energy<br />
Energy<br />
Nordic electricity spot prices started the year at very high levels, driven by a significant hydrological deficit of almost 40 TWh.<br />
However, high imports, high thermal power production and high precipitation resulted in a more normal hydrological balance<br />
by the autumn, putting downward pressure on spot prices. By the end of 2011, water reservoirs in Norway were 80 percent of<br />
full capacity, which is 11 percentage points above normal and the highest level experienced since 1990.<br />
In 2011, the total power consumption in the Nordic market decreased by 19 TWh to 379 TWh, mainly due to milder<br />
weather. Total power production decreased by 4 TWh to 375 TWh. Power production in Norway amounted to 128 TWh,<br />
which is 4 TWh higher than 2010.<br />
Additional factors impacting <strong>Hydro</strong><br />
<strong>Hydro</strong> has sold forward around 85 percent of its expected primary aluminium production for the first quarter of 2012 at a<br />
price level of around USD 2,150 per mt. This excludes expected volumes from Qatalum. <strong>Hydro</strong>'s hedge of aluminium price<br />
exposure related to the business acquired from Vale expired at the end of 2011.<br />
<strong>Hydro</strong>'s water reservoirs were well above normal at the end of 2011, and snow reservoirs increased significantly. As a result,<br />
production is expected to be high through the first quarter of 2012.<br />
There continues to be significant uncertainty regarding global economic developments impacting the aluminium industry in<br />
general. Market developments in Southern Europe in particular are expected to remain weak.<br />
<strong>Hydro</strong> has curtailed production capacity and reduced production at certain plants. If it becomes necessary to permanently close<br />
plants that have been curtailed additional substantial costs will be incurred.<br />
Underlying EBIT - Business areas<br />
To provide a better understanding of <strong>Hydro</strong>'s underlying performance, the following discussion of operating performance<br />
excludes certain items from EBIT (earnings before financial items and tax) and net income, such as unrealized gains and losses<br />
on derivatives, impairment and rationalization charges, effects of disposals of businesses and operating assets, as well as other<br />
items that are of a special nature or are not expected to be incurred on an ongoing basis. See section later in this report, Items<br />
excluded from underlying EBIT and net income, for more information on these items.<br />
Bauxite & Alumina<br />
Operational and financial information<br />
Year<br />
2011<br />
Year<br />
2010<br />
87<br />
% change<br />
prior year<br />
Underlying EBIT (NOK million) 887 633 40 %<br />
Underlying EBITDA (NOK million) 2 480 661 >100 %<br />
Alumina production (kmt) 5 264 1 976 >100 %<br />
Underlying EBIT improved for Bauxite & Alumina mainly due to the inclusion of the acquired bauxite and alumina activities<br />
from Vale from March 1, 2011. See also section, Pro forma information - Bauxite & Alumina later in this report.
88<br />
FINANCIAL AND OPERATING PERFORMANCE<br />
Primary Metal<br />
Primary Metal<br />
Operational and financial information 1)<br />
Year<br />
2011<br />
Year<br />
2010<br />
% change<br />
prior year<br />
Underlying EBIT (NOK million) 2 486 617 >100 %<br />
Underlying EBITDA (NOK million) 4 671 2 374 97 %<br />
Realized aluminium price LME (USD/mt) 2)<br />
2 480 2 113 17 %<br />
Realized aluminium price LME (NOK/mt) 2)<br />
13 884 12 674 10 %<br />
Realized premium above LME (USD/mt) 3)<br />
333 317 5 %<br />
Realized premium above LME (NOK/mt) 3)<br />
1 866 1 906 (2) %<br />
Realized NOK/USD exchange rate 5.60 6.00 (7) %<br />
Primary aluminium production (kmt) 1 982 1 415 40 %<br />
Casthouse production (kmt) 2 463 2 022 22 %<br />
Casthouse sales (kmt) 2 451 2 008 22 %<br />
1) Operating and financial information includes <strong>Hydro</strong>'s proportionate share of underlying profit (loss), production, prices, premiums and exchange rates in<br />
equity accounted investments.<br />
2) Including effect of strategic LME hedges (hedge accounting applied).<br />
3) Average realized premium above LME for total metal products sold from Primary Metal.<br />
Underlying results in equity accounted investments 4)<br />
NOK million<br />
Year<br />
2011<br />
Year<br />
2010<br />
% change<br />
prior year<br />
Søral (49.90%) 23 7 >100 %<br />
Qatalum (50.00%) 18 (648) >100 %<br />
4) Underlying results are defined as share of net income adjusted for items excluded.<br />
Primary aluminium and casthouse production (kmt) 5)<br />
Primary aluminium Casthouse production<br />
Location 2011 2010 2011 2010<br />
Albras Brazil 381 379 <br />
Karmøy Norway 184 182 218 239<br />
Årdal Norway 205 201 309 309<br />
Sunndal Norway 300 291 420 441<br />
Høyanger Norway 62 61 117 115<br />
Søral (<strong>Hydro</strong>'s 49.9% share) Norway 45 44 59 65<br />
Slovalco Slovakia 163 163 184 188<br />
Neuss Germany 53 52 174 217<br />
Kurri Kurri Australia 180 179 184 182<br />
Tomago (12.4% share) Australia 67 65 66 65<br />
Qatalum (50% share) Qatar 225 63 234 86<br />
Alouette (20% share) Canada 116 114 116 114<br />
Total production Primary Aluminium 1 982 1 415 2 463 2 022<br />
5) Production volumes for part owned companies represent our proportion of total production. For financial reporting purposes, Søral and Qatalum are<br />
accounted for as equity accounted investments, while Tomago and Alouette are consolidated on a proportional basis. Slovalco and Albras are fully<br />
consolidated in terms of financial results and volumes.<br />
Underlying EBIT for Primary Metal improved significantly in 2011, driven by higher realized aluminium prices, higher<br />
volumes and improved earnings for Qatalum following the completion of ramp-up of the plant. Positive developments were<br />
partly offset by substantially higher raw material costs. Inclusion of the Albras smelter from March 1, 2011 also had a positive<br />
effect on underlying EBIT. See section on Pro forma information - Primary Metal later in this report.<br />
Excluding Albras, higher realized aluminium prices 6) together with higher premiums, contributed about NOK 2.5 billion to<br />
underlying EBIT compared with 2010. LME linked alumina costs increased, together with higher costs for carbon and power.<br />
Fixed costs for our smelter portfolio, excluding Albras, declined somewhat. Our USD 300 per mt cost improvement program<br />
was on track, delivering cumulative savings of USD 200 per mt by the end of 2011 compared to 2009.
FINANCIAL AND OPERATING PERFORMANCE<br />
Primary Metal<br />
Underlying EBIT improved in 2011 for Qatalum, which reached full production on September 21. Insurance proceeds relating<br />
to the power outage in August 2010 which were included in underlying results for 2011 amounted to NOK 145 million.<br />
Proceeds amounted to NOK 300 million in 2010, of which NOK 210 million was included in underlying EBIT.<br />
6) Due to hedging and inventory effects, our realized aluminium prices lag LME price developments by about 4 months.<br />
Metal Markets<br />
Operational and financial information<br />
Year<br />
2011<br />
Year<br />
2010<br />
% change<br />
prior year<br />
Underlying EBIT (NOK million) 441 321 37 %<br />
Currency effects 1)<br />
(34) (145) 77 %<br />
Ingot inventory valuation effects 2)<br />
71 20 >100 %<br />
Underlying EBIT excl. currency and ingot inventory effects 404 447 (10) %<br />
Underlying EBITDA (NOK million) 542 428 27 %<br />
Remelt production (kmt) 3)<br />
565 586 (4) %<br />
Sale of metal products from own production (kmt) 4)<br />
3 086 2 666 16 %<br />
Sale of thirdparty metal products (kmt) 217 121 79 %<br />
Total metal products sales excluding ingot trading (kmt) 3 303 2 787 19 %<br />
Hereof external sales excluding ingot trading (kmt) 2 091 1 717 22 %<br />
External revenue (NOK million) 5)<br />
33 363 27 090 23 %<br />
Product sales (NOK million) 6)<br />
27 681 23 616 17 %<br />
1) Includes the effects of changes in currency rates on sales and purchase contracts denominated in foreign currencies (mainly U.S. dollar and Euro for our<br />
European operations) and the effects of changes in currency rates on the fair valuation of dollar denominated derivative contracts (including LME futures) and<br />
inventories, mainly translated into Norwegian kroner. <strong>Hydro</strong> manages its external currency exposure on a consolidated basis in order to take advantage of<br />
offsetting positions.<br />
2) Comprised of hedging gains and losses relating to standard ingot inventories in our metal sourcing and trading operations. Increasing LME prices result in<br />
unrealized hedging losses, while the offsetting gains on physical inventories are not recognized until realized. In periods of declining prices, unrealized<br />
hedging gains are offset by write-downs of physical inventories.<br />
3) Production in Metal Markets' soft alloy remelt casthouses. Hannover casthouse production excluded from Q1 2011 (2010 production volumes are<br />
restated).<br />
4) Includes external and internal sales from our primary casthouse operations, remelters, part owned and third party metal sources. Includes volumes from<br />
Albras casthouse (<strong>Hydro</strong>'s share 51 percent) from March 1, 2011.<br />
5) External sales revenue from our primary casthouse operations, remelters, part owned and third party metal sources as well as aluminium trading and<br />
hedging activities, including derivatives.<br />
6) Excludes revenues from our aluminium trading and hedging activities and derivatives.<br />
Remelt production (kmt) Location<br />
Europe<br />
Year<br />
2011<br />
Year<br />
2010<br />
% change<br />
prior year<br />
Clervaux Luxembourg 97 109 (11) %<br />
Deeside United Kingdom 50 57 (12) %<br />
Rackwitz Germany 87 91 (4) %<br />
Luce France 54 59 (8) %<br />
Azuqueca Spain 71 70 1 %<br />
Hannover Germany 15 16 (6) %<br />
US<br />
Henderson Kentucky 81 79 3 %<br />
Commerce Texas 96 98 (2) %<br />
Asia<br />
<strong>Hydro</strong> Aluminium Taiwan 7)<br />
Taiwan 29 24 21 %<br />
Total remelt production Metal Markets 580 603 (4) %<br />
89
90<br />
FINANCIAL AND OPERATING PERFORMANCE<br />
Metal Markets<br />
7) from April 2010<br />
Developments in underlying EBIT for Metal Markets in 2011 were heavily influenced by net positive currency and inventory<br />
valuation effects compared with significant net negative effects for 2010. Underlying EBIT excluding these items declined,<br />
impacted by a lower contribution from our sourcing and trading activities. Results for our remelt operations improved<br />
somewhat for the year.<br />
Total metal product sales improved compared with 2010, mainly due to the inclusion of Albras casthouse volumes from March<br />
1, 2011 and increased volumes from Qatalum. The positive effects were partly offset by lower extrusion ingot and sheet ingot<br />
sales volumes in Europe due to weaker markets.<br />
Our remelt operations delivered improved results in 2011 despite slightly lower production volumes. Volumes for our U.S.<br />
plants were fairly stable compared to the previous years while our European plants were impacted by declining demand in the<br />
second half of 2011 in particular. Improved margins, however, more than offset the negative effects of the volume decline.<br />
Operating results from our sourcing and trading activities declined in 2011. Margins improved for our physical standard ingot<br />
trading operations but were more than offset by weaker LME trading results compared to the strong performance in the prior<br />
year.<br />
Rolled Products<br />
Operational and financial information<br />
Year<br />
2011<br />
Year<br />
2010<br />
% change<br />
prior year<br />
Underlying EBIT (NOK million) 673 864 (22) %<br />
Underlying EBITDA (NOK million) 1 126 1 318 (15) %<br />
Sales volumes to external market (kmt) 929 945 (2) %<br />
Sales volumes to external markets (kmt) Customer business units<br />
Foil 121 129 (6) %<br />
Can beverage 188 177 6 %<br />
Other packaging and building 85 89 (4) %<br />
Automotive, heat exchanger 134 122 10 %<br />
General engineering 236 259 (9) %<br />
Lithography 165 169 (2) %<br />
Rolled Products 929 945 (2) %<br />
Rolled Products production sites<br />
Volumes to external market (kmt) Location<br />
Year<br />
2011<br />
Year<br />
2010<br />
% change<br />
prior year<br />
Grevenbroich / 50% share in Alunorf Germany 578 569 2 %<br />
Hamburg Germany 132 143 (8) %<br />
Slim Italy 57 60 (5) %<br />
Malaysia (99.7% share) Malaysia 14 17 (18) %<br />
Karmøy Norway 58 67 (13) %<br />
Holmestrand Norway 89 90 (1) %<br />
Total, excluding internal sales 929 945 (2) %<br />
Underlying EBIT for Rolled Products declined in 2011 compared to the record results achieved in the previous year, mainly<br />
due to lower sales volumes and somewhat higher operating costs.
FINANCIAL AND OPERATING PERFORMANCE<br />
Rolled Products<br />
Volumes declined somewhat in total, reflecting weaker markets in the second half of 2011. General engineering volumes<br />
declined significantly, impacted mainly by destocking as well as somewhat lower industrial demand. Shipments of thin gauge<br />
foil and lithography applications were also dampened by weaker markets. Sales of beverage can applications developed<br />
positively, supported by good market demand. Automotive products shipment demonstrated solid growth, influenced by<br />
strong demand for premium cars.<br />
Margins improved in the first half of 2011, but were under pressure during the second half, mainly related to general<br />
engineering applications. For the year in total margins, were higher than in 2010. However, the positive effects were more than<br />
offset by currency losses on export sales. 1)<br />
Operating costs were higher in absolute terms and also per mt driven by higher energy prices and other production related<br />
costs.<br />
1) Rolled Products incurs currency gains and losses on export sales from its Euro based operations mainly denominated in US dollars. These gains and<br />
losses impact the value of the margin contribution to underlying EBIT. Offsetting gains and losses on internal hedges are reported as financial items.<br />
Extruded Products<br />
Operational and financial information<br />
Year<br />
2011<br />
Year<br />
2010<br />
% change<br />
prior year<br />
Underlying EBIT (NOK million) 151 444 (66) %<br />
Underlying EBITDA (NOK million) 655 987 (34) %<br />
Sales volumes to external market (kmt) 536 529 1 %<br />
Sales volumes to external markets (kmt) sectors<br />
Extrusion Eurasia 303 293 3 %<br />
Building Systems 64 73 (12) %<br />
Extrusion Americas 101 95 5 %<br />
Precision Tubing 69 67 3 %<br />
Extruded Products 536 529 1 %<br />
Extrusion sales volume per market segment 2011 Extrusion Extrusion Building Precision<br />
Volumes to external market (kmt) Eurasia Americas Systems Tubing<br />
Domestic & office equipment 19 9 <br />
Building & construction 110 31 64 <br />
General Engineering 27 8 <br />
Electrical 17 14 <br />
Transport 55 23 59<br />
Other 74 15 10<br />
Total 303 101 64 69<br />
Underlying EBIT declined substantially in 2011, mainly as a result of lower volumes for our higher margin building systems<br />
operations and lower margins for our European general extrusion operations. Cost reduction initiatives resulted in lower<br />
operating costs, partly offsetting the negative market developments. Our Americas extrusion operations and global precision<br />
tubing business delivered improved underlying results for the year.<br />
Overall volumes increased compared to the previous year, as markets improved during the first half of 2011. However, demand<br />
weakened in the second half of the year due to growing economic uncertainty impacting our European extrusion business in<br />
particular. Declining market demand for building applications throughout the year resulted in significantly lower volumes for<br />
our building systems operations. Volumes for our North American extrusion operations increased in line with a general market<br />
improvement. Our South American operations delivered somewhat higher volumes, but lower than the market as a whole due<br />
to capacity constraints at our Brazilian plant. Volumes increased for our global precision tubing business.<br />
91
92<br />
FINANCIAL AND OPERATING PERFORMANCE<br />
Extruded Products<br />
Weak demand and increasing overcapacity in Southern Europe has resulted in significant pressure on margins in Europe.<br />
Measures implemented across our European general extrusion operations have reduced our operating cost per mt, partly<br />
offsetting margin declines. A substantial cost-improvement program has been implemented for our building systems business,<br />
targeting annual savings of Euro 40 million compared to 2010 by the end of 2012. This program has contributed to lower<br />
operating costs in 2011, and further measures are expected to improve our competitive position in this sector going forward.<br />
Underlying results for our precision tubing business were higher than in the previous year, driven by strong demand and the<br />
positive impact of our cost reduction measures. Underlying results for our extrusion operations in the Americas also improved,<br />
benefiting from higher volumes, continued strong cost control and efforts aimed at targeting higher value business.<br />
Energy<br />
Operational and financial information<br />
Year<br />
2011<br />
Year<br />
2010<br />
% change<br />
prior year<br />
Underlying EBIT (NOK million) 1 883 1 416 33 %<br />
Underlying EBITDA (NOK million) 2 018 1 540 31 %<br />
Direct production costs (NOK million) 1)<br />
468 515 (9) %<br />
Power production (GWh) 9 582 8 144 18 %<br />
External power sourcing (GWh) 2)<br />
8 675 8 539 2 %<br />
Internal contract sales (GWh) 3)<br />
12 446 12 336 1 %<br />
External contract sales (GWh) 4)<br />
1 187 1 968 (40) %<br />
Net spot sales (GWh) 5)<br />
4 624 2 380 94 %<br />
1) Includes maintenance and operational costs, transmission costs, property taxes and concession fees for <strong>Hydro</strong> as operator.<br />
2) Includes long-term sourcing contracts and industrial sourcing in Germany.<br />
3) Internal contract sales in Norway and Germany, including sales from own production and resale of externally sourced volumes.<br />
4) External contract sales, mainly concession power deliveries and volumes to former <strong>Hydro</strong> businesses.<br />
5) Spot sales volumes net of spot purchases.<br />
Underlying EBIT for Energy increased in 2011, mainly due to higher production and lower area price differences, partly offset<br />
by lower prices. In addition, strong results from commercial activities contributed positively to underlying EBIT for 2011.<br />
Direct production costs declined in 2011 due to lower transmission costs.<br />
The decline in external contracts sales volumes resulted from lower sales to former <strong>Hydro</strong> businesses.<br />
Other and eliminations<br />
Other and eliminations<br />
NOK million<br />
Year<br />
2011<br />
Year<br />
2010<br />
% change<br />
prior year<br />
Underlying EBIT (389) (945) 59 %<br />
of which eliminations 190 (221) >100 %<br />
Eliminations is mainly comprised of unrealized gains and losses on inventories purchased from group companies, which<br />
fluctuates with product flows, volumes and margin developments throughout <strong>Hydro</strong>'s value chain. Underlying EBIT for 2010<br />
included costs related to the acquisition of Vale's aluminium operations of about NOK 100 million.
Items excluded from underlying EBIT and net income<br />
FINANCIAL AND OPERATING PERFORMANCE<br />
Items excluded from underlying EBIT and net income<br />
Items excluded from underlying EBIT and net income<br />
To provide a better understanding of <strong>Hydro</strong>'s underlying performance, the items in the table below have been excluded from<br />
underlying EBIT (earnings before financial items and tax) and net income.<br />
Items excluded from underlying EBIT are mainly comprised of unrealized gains and losses on certain derivatives, impairment<br />
and rationalization charges, effects of disposals of businesses and operating assets, as well as other items that are of a special<br />
nature or are not expected to be incurred on an ongoing basis.<br />
Items excluded from underlying net income 1)<br />
NOK million<br />
Unrealized derivative effects on LME related contracts 2)<br />
Derivative effects on LME related contracts (Vale Aluminium) 3)<br />
Unrealized derivative effects on power contracts 4)<br />
Unrealized derivative effects on currency contracts 5)<br />
Unrealized derivative effects on raw material contracts 6)<br />
Metal effect, Rolled Products 7)<br />
Significant rationalization charges and closure costs 8)<br />
Impairment charges (PP&E and equity accounted investments) 9)<br />
Pension 10)<br />
Insurance compensation 11)<br />
(Gains)/losses on divestments 12)<br />
Transaction related effects (Vale Aluminium) 13)<br />
Year<br />
2011<br />
Year<br />
2010<br />
431 489<br />
(74) (166)<br />
(195) 609<br />
(1) (50)<br />
43 (156)<br />
7 (560)<br />
225 130<br />
1 382 187<br />
(151)<br />
(91)<br />
(1 184) (74)<br />
(4 328) <br />
Items excluded from underlying EBIT (3 694) 167<br />
Net foreign exchange (gain)/loss 14)<br />
Calculated income tax effect 15)<br />
971 (513)<br />
(78) 80<br />
Items excluded from underlying net income (2 802) (266)<br />
1) Negative figures indicate a gain and positive figures indicate a loss.<br />
2) Unrealized derivative effects on LME contracts include unrealized gains and losses on contracts measured at market value, which are used for operational<br />
hedging purposes related to fixed-price customer and supplier contracts, but where hedge accounting is not applied. The amounts include net unrealized<br />
gains and losses on derivative contracts relating to our Primary Metal and Metal Markets operations and our downstream Rolled Products and Extruded<br />
Products operations. Certain internal aluminium contracts between Metal Markets and other units are measured at market value by Metal Markets but<br />
considered for <strong>Hydro</strong>'s own use by consuming units. The valuation effects are eliminated as part of Other and eliminations, and excluded from underlying<br />
results. Unrealized gains and losses on derivative contracts relating to trading activities are not excluded from underlying EBIT, as these are considered to be<br />
a normal part of the trading business performance.<br />
3) Linked to the agreement to acquire the majority of Vale's Aluminium business in Brazil (Vale Aluminium), <strong>Hydro</strong> decided to hedge the majority of the net<br />
aluminium price exposure in Vale Aluminium until the end of 2011. The hedges were aimed at mitigating the risk of a weaker aluminium price, securing a<br />
robust cash flow from the acquired assets in the transition phase. The significant part of the positions expiring after closing of the transaction are subject to<br />
hedge accounting and included in other comprehensive income. The effects of realized positions until February 28, 2011 and unrealized positions until the<br />
end of 2011, not subject to hedge accounting, are classified as items excluded from underlying EBIT.<br />
4) Unrealized derivative effects on power contracts include unrealized gains and losses on embedded derivatives in power contracts for <strong>Hydro</strong>'s own use, as<br />
well as financial power contracts used by Primary Metal, including Søral, and Energy for hedging of power prices. <strong>Hydro</strong>'s Energy operations supply<br />
electricity for <strong>Hydro</strong>'s own consumption, and have entered into long-term purchase contracts with external power suppliers. Energy accounts for embedded<br />
derivatives in certain sourcing contracts and for the corresponding internal supply contracts with consuming units at fair value. These internal purchase<br />
contracts are considered for <strong>Hydro</strong>'s own use by the consuming units, while the embedded derivative is recognized at market value in Other and<br />
eliminations, and excluded from underlying results. Embedded derivatives include exposures to changes in forward prices on aluminium and coal, as well as<br />
currency and inflation adjustments. <strong>Report</strong>ed periodic effects are also influenced by changes in the contract portfolio. The majority of physical powerpurchase<br />
contracts have a long duration and can result in significant unrealized gains and losses on embedded derivatives, impacting the reported results.<br />
5) Unrealized derivative effects on currency contracts relate to currency effects in equity-accounted investments. The amounts include unrealized effects on<br />
long-term US dollar-denominated loans for Alunorte prior to February 28, 2011.<br />
6) Unrealized derivative effects on raw-material contracts include unrealized gains and losses on embedded derivatives in raw-material contracts for own<br />
use. Embedded derivatives include exposures to changes in forward prices on aluminium and petroleum coke.<br />
7) Metal effect: Rolled Products' sales prices are based on a margin over the metal price. The pricing, production and logistics process of Rolled Products<br />
normally lasts four to five months. As a result, margins are impacted by timing differences resulting from the FIFO (first in, first out) inventory valuation<br />
method, due to changing aluminium prices during the process. The effect of potential inventory write-downs is included. Decreasing aluminium prices in Euro<br />
results in a negative metal effect on margins, while increasing prices have a positive effect.<br />
8) Rationalization charges and closure costs include costs that are typically non-recurring for individual plants or operations. Such costs involve termination<br />
benefits, dismantling of installations and buildings, clean-up activities that exceed legal liabilities, etc.<br />
93
94<br />
FINANCIAL AND OPERATING PERFORMANCE<br />
Items excluded from underlying EBIT and net income<br />
9) Impairment charges occur in the period when an asset or a group of assets is identified to have lost its value, causing a write-down to the recoverable<br />
amount. In most of our impairment situations, there is no single event directly causing the write-down. The loss is therefore not necessarily closely linked to<br />
performance in a single period.<br />
10) Recognition of pension plan amendments, curtailments and settlements.<br />
11) Insurance compensation for damages on assets, recognized as income (includes equity accounted investments).<br />
12) Gains and losses on divestments include a net gain or loss on divested businesses and/or individual major assets.<br />
13) Effects related to the acquisition of Vale Aluminium on February 28, 2011 include the revaluation gain of <strong>Hydro</strong>'s pre-transaction stake in Alunorte and<br />
CAP, gains and losses related to the settlement of pre-existing contracts and agreements, as well as the fair value adjustment of inventory of finished goods<br />
sold.<br />
14) Realized and unrealized gains and losses on foreign currency-denominated accounts receivables and payables, funding and deposits, and forwardcurrency<br />
contracts purchasing and selling currencies that hedge net future cash flows from operations, sales contracts and working capital.<br />
15) In order to present underlying net income on a basis comparable with our underlying operating performance, we have calculated the income tax effect of<br />
items excluded from underlying income before tax. In addition, we have adjusted for write-down of deferred tax assets in 2011.
Items excluded from underlying EBIT - Business areas<br />
The following includes a summary table of items excluded from underlying EBIT for each of the operating segments and for<br />
Other and eliminations, with a brief discussion of the major factors affecting the development of these items in 2011.<br />
Items excluded from underlying EBIT 1)<br />
NOK million<br />
Unrealized derivative effects on currency contracts (Alunorte) (1) (50)<br />
Derivative effects on LME related contracts (Vale Aluminium) (72) (164)<br />
Transaction related effects (Vale Aluminium) (4 421) <br />
(Gains)/losses on divestments (465) <br />
Bauxite & Alumina (4 959) (214)<br />
Derivative effects on LME related contracts (Vale Aluminium) (1) (2)<br />
Unrealized derivative effects on LME related contracts (Søral) (3) <br />
Unrealized derivative effects on LME related contracts (143) 95<br />
Unrealized derivative effects on power contracts (Søral) 43 (56)<br />
Unrealized derivative effects on power contracts 139 49<br />
Unrealized derivative effects on raw material contracts 43 (156)<br />
Impairment charges 970 <br />
Impairment charge (Qatalum) 98<br />
Insurance compensation (Qatalum) (91)<br />
Rationalization charges and closure costs 80 66<br />
Transaction related effects (Vale Aluminium) 93 <br />
Primary Metal 1 221 2<br />
Unrealized derivative effects on LME related contracts (16) 164<br />
Pension curtailment and settlement (2)<br />
Metal Markets (16) 162<br />
Unrealized derivative effects on LME related contracts 584 222<br />
Metal effect 7 (560)<br />
Rationalization charges and closure costs 17 <br />
Pension curtailment and settlement (12)<br />
Rolled Products 608 (350)<br />
Unrealized derivative effects on LME related contracts 29 18<br />
Rationalization charges and closure costs 127 64<br />
Impairment charges 235 28<br />
Pension curtailment and settlement (25)<br />
(Gains)/losses on divestments (67)<br />
Extruded Products 391 18<br />
Unrealized derivative effects on power contracts (8) (21)<br />
(Gains)/losses on divestments (658) <br />
Energy (667) (21)<br />
Unrealized derivative effects on power contracts (370) 637<br />
Unrealized derivative effects on LME related contracts (20) (9)<br />
Impairment charges 177 61<br />
Pension curtailment and settlement (112)<br />
(Gains)/losses on divestments (60) (7)<br />
Other and eliminations (273) 569<br />
Items excluded from underlying EBIT (3 694) 167<br />
1) Negative figures indicate a gain and positive figures indicate a loss.<br />
FINANCIAL AND OPERATING PERFORMANCE<br />
Items excluded from underlying EBIT - Business areas<br />
Year<br />
2011<br />
Year<br />
2010<br />
95
96<br />
FINANCIAL AND OPERATING PERFORMANCE<br />
Bauxite & Alumina<br />
Bauxite & Alumina<br />
Gains on LME related contracts, not subject to hedge accounting, connected to the hedge program entered into in the second<br />
quarter of 2010 in order to hedge the majority of the net aluminium price exposure in Vale Aluminium until the end of 2011<br />
were the effect of realized positions. Transaction related effects (Vale Aluminium) include the revaluation gain of <strong>Hydro</strong>'s pretransaction<br />
stake in Alunorte and CAP, as well as gains and losses related to settlement of pre-existing contracts and<br />
agreements. Gains on divestments related to the sale of <strong>Hydro</strong>'s interest in the Alpart alumina refinery in November, 2011.<br />
Primary Metal<br />
Gains on LME related contracts, not subject to hedge accounting, connected to the hedge program, entered into in the second<br />
quarter of 2010 in order to hedge the majority of the net aluminium price exposure in Vale Aluminium until the end of 2011,<br />
were the effect of realized positions. Unrealized gains on LME derivative contracts related to our operational hedge program<br />
were mainly the net effect of realized positions and unrealized gains on forward positions due to the downward shift in LME<br />
forward prices. Unrealized losses on power contracts were comprised of net unrealized losses on embedded derivatives in power<br />
contracts and the effect of decreasing forward prices on power affecting the financial power contracts in Søral. Unrealized losses<br />
on embedded derivatives in raw material contracts were mainly the effect of realized volumes. Impairment and rationalization<br />
charges relate to the write down of fixed assets and the rationalization program in Kurri Kurri reflecting the challenging<br />
financial situation, as well as costs related to the demolition of the Karmøy Søderberg line and the rationalization program at<br />
the Sunndal plant. Transaction related effects include adjustments for fair value allocated to inventory of finished goods at<br />
Albras sold during March 2011.<br />
Metal Markets<br />
Unrealized gains on LME derivative contracts related to our operational hedging program were mainly an effect of the net<br />
effect of realized positions and unrealized gains on forward positions due to the downward shift in LME forward prices.<br />
Rolled Products<br />
Unrealized losses on LME derivative contracts related to our operational hedging program were mainly the net effect of realized<br />
positions and unrealized losses on forward positions due to the downward shift in LME forward prices. The negative metal<br />
effect reflects the decreased LME prices affecting inventories. Rationalization charges related to the downsizing activities in<br />
Malaysia.<br />
Extruded Products<br />
Unrealized losses on LME derivative contracts related to our operational hedging program were mainly the net effect of realized<br />
positions and unrealized losses on forward positions due to the downward shift in LME forward prices. Impairment and<br />
rationalization charges related to the write-down of certain fixed assets and measures taken in <strong>Hydro</strong> Building Systems'<br />
operations in southern Europe reflecting the challenging market situation.<br />
Energy<br />
Unrealized gains on financial power contracts related to hedging of our power portfolio positions. Gains on divestments related<br />
to the sale of shares in SKS Produksjon AS to Salten Kraftsamband AS in July, 2011.<br />
Other and eliminations<br />
Unrealized derivative effects on power contracts result from changes in the fair value of certain internal power contracts related<br />
to delivery of power from <strong>Hydro</strong>'s Energy segment to consuming units. These internal contracts, or embedded derivatives<br />
within the contracts, are accounted for at fair value by the Energy segment. Valuation effects are included in Other and<br />
eliminations, and excluded from underlying results. The net unrealized gain reflects mainly the downward shift in LME<br />
forward prices and reduced volumes. Unrealized gains on LME related derivative contracts result from changes in the fair value<br />
of certain internal aluminium contracts between Metal Markets and the consuming units. These internal contracts are<br />
accounted for at fair value by Metal Markets. Valuation effects are eliminated as part of Other and eliminations and excluded<br />
from underlying results. Impairment charges related mainly to write down of solar investments. Gains on divestments resulted<br />
from the disposal of Industrial Park at Rjukan, Norway and other fixed assets.
Financial income (expense), net<br />
Year Year % change<br />
NOK million 2011 2010 prior year<br />
Interest income 263 201 31 %<br />
Dividends received and net gain (loss) on securities (53) 145 >100%<br />
Financial income 209 346 (39)%<br />
Interest expense (367) (253) (45)%<br />
Capitalized interest 1 5 (70)%<br />
Net foreign exchange gain (loss) (971) 513 >(100)%<br />
Other (161) (89) (81)%<br />
Financial expense (1 498) 176 >(100)%<br />
Financial income (expense), net (1 288) 522 >(100)%<br />
Net financial expense for the year amounted to NOK 1,288 million, including a net foreign currency loss of NOK 971<br />
million. The net currency loss in 2011 related mainly to debt denominated in US dollars. In 2010, the net currency gains<br />
related mainly to intercompany financial balances. These gains have no cash effect and are offset in equity by translation of the<br />
corresponding subsidiaries during consolidation. 1) Net currency gains relating to intercompany financial balances amounted to<br />
NOK 27 million in 2011.<br />
Interest expense increased for the year, reflecting higher debt.<br />
FINANCIAL AND OPERATING PERFORMANCE<br />
Financial income (expense), net<br />
1) Currency effects on intercompany balances arise from group positions where the counter parties have different functional currencies.<br />
Income tax expense<br />
Income taxes amounted to a charge of NOK 1,790 million in 2011, compared with a charge of NOK 1,588 million in 2010.<br />
For 2011 income tax expense was 21 percent of pre-tax income. The low tax rate results from tax-free gains on the sales of the<br />
shareholding in SKS Produksjon and Alpart, and the tax-free gain from the revaluation of <strong>Hydro</strong>'s previous ownership interests<br />
in Alunorte and the CAP recognized in the first quarter. The effect was somewhat offset by impairment charges having no tax<br />
effect and the write down of deferred tax assets recognized in the fourth quarter.<br />
97
98<br />
FINANCIAL AND OPERATING PERFORMANCE<br />
Pro forma information<br />
Pro forma information<br />
Pro forma information related to the acquisition of Vale Aluminium<br />
The above discussion on reported and underlying operating results includes the assets acquired from Vale from March 1, 2011.<br />
Amounts relating to previous periods have not been restated to reflect the reported and underlying results of the acquired<br />
assets.<br />
To provide a presentation of <strong>Hydro</strong>'s performance on a comparable basis, certain pro forma financial and operating<br />
information is also presented in the following section based on including the results of the acquired Vale assets for the full<br />
calendar quarter when the acquisition was completed, and for all previous periods presented in this report. See note 5 to the<br />
consolidated financial statements later in this report for more information on the acquisition.<br />
Bauxite & Alumina<br />
Operational and financial information<br />
Year<br />
2011<br />
Year<br />
2010<br />
% change<br />
prior year<br />
Underlying EBIT (NOK million) 969 1 225 (21) %<br />
Underlying EBITDA (NOK million) 2 865 3 061 (6) %<br />
Alumina production (kmt) 1)<br />
5 827 5 805 <br />
Sourced alumina (kmt) 1 958 2 141 (9) %<br />
Total alumina sales (kmt) 2)<br />
7 897 7 941 (1) %<br />
Realized alumina price (USD/mt) 3)<br />
333 295 13 %<br />
Apparent alumina cash cost (USD/mt) 4)<br />
266 238 12 %<br />
Bauxite production (kmt) 5)<br />
8 151 7 524 8 %<br />
Sourced bauxite (kmt) 6)<br />
8 235 7 832 5 %<br />
1) Including Alunorte on a 100 percent basis.<br />
2) Including <strong>Hydro</strong>'s own production and third party contracts.<br />
3) Weighted average of own production and third party contracts, excluding hedge results.<br />
4) Apparent integrated alumina cash production cost based on cost of produced alumina and cost of alumina sourced on contracts. Paragominas bauxite is<br />
included at cost. MRN bauxite is included at contract price.<br />
5) Paragominas on wet basis (100 percent).<br />
6) 40 percent MRN off take from Vale and 5 percent <strong>Hydro</strong> share on wet basis.<br />
Underlying EBIT for Bauxite & Alumina declined compared with 2010, which included insurance proceeds from the<br />
settlement of a claim for business interruption. Significant improvements in operational stability and capacity utilization were<br />
achieved during 2011.<br />
Following the integration of our new bauxite and alumina operations, we have focused on improving operational performance<br />
and stability. Bauxite production improved throughout the year reaching record volumes for the year as a whole. Alumina<br />
production at Alunorte increased slightly for the year. Despite these improvements, developments in underlying results were<br />
not satisfactory and further initiatives are planned for 2012.<br />
Realized alumina prices improved 7) compared to 2010, driven by higher LME prices, but positive effects were mostly offset by<br />
increased raw material costs.<br />
7) The majority of our alumina is sold linked to LME with a one month delay
Primary Metal<br />
Operational and financial information 1)<br />
Year<br />
2011<br />
Year<br />
2010<br />
% change<br />
prior year<br />
Underlying EBIT (NOK million) 2 495 816 >100 %<br />
Underlying EBITDA (NOK million) 4 753 3 006 58 %<br />
Realized aluminium price LME (USD/mt) 2)<br />
2 478 2 128 16 %<br />
Realized aluminium price LME (NOK/mt) 2)<br />
13 885 12 758 9 %<br />
Realized premium above LME (USD/mt) 3)<br />
329 273 20 %<br />
Realized premium above LME (NOK/mt) 3)<br />
1 846 1 641 12 %<br />
Realized NOK/USD exchange rate 5.61 5.96 (6) %<br />
Primary aluminium production (kmt) 2 056 1 867 10 %<br />
Casthouse production (kmt) 2 537 2 470 3 %<br />
Casthouse sales (kmt) 2 510 2 453 2 %<br />
1) Operating and financial information includes <strong>Hydro</strong>'s proportionate share of underlying profit (loss), production, prices, premiums and exchange rates in<br />
equity accounted investments.<br />
2) Including effect of strategic LME hedges (hedge accounting applied).<br />
3) Average realized premium above LME for total metal products sold from Primary Metal.<br />
FINANCIAL AND OPERATING PERFORMANCE<br />
Primary Metal<br />
Pro forma underlying EBIT for Primary Metal improved significantly in 2011 compared to the previous year, influenced by<br />
the same factors discussed above.<br />
99
100<br />
FINANCIAL AND OPERATING PERFORMANCE<br />
Pro forma consolidated statement of income (unaudited) and other information<br />
Pro forma consolidated statement of income (unaudited) and other information<br />
NOK million, except per share data 2011 2010<br />
Revenue 93 121 87 272<br />
Share of the profit (loss) in equity accounted investments (286) (791)<br />
Other income, net 1 802 568<br />
Total revenue and income 94 636 87 049<br />
Depreciation, amortization and impairment 6 534 5 226<br />
Other expenses 82 526 78 128<br />
Total expenses 89 060 83 354<br />
Earnings before financial items and tax (EBIT) 5 576 3 696<br />
Financial income (expense), net (1 332) 580<br />
Income (loss) before tax 4 244 4 275<br />
Income taxes (1 725) (1 822)<br />
Net income (loss) 2 519 2 454<br />
Net income (loss) attributable to minority interests 76 233<br />
Net income (loss) attributable to <strong>Hydro</strong> shareholders 2 444 2 220<br />
Earnings per share attributable to <strong>Hydro</strong> shareholders 1)<br />
Year<br />
1.20 1.09<br />
Number of shares (million) 2 036 2 036<br />
1) Earnings per share is calculated using the number of shares outstanding after completion of the transaction on February 28, 2011.<br />
Underlying EBIT and EBITDA<br />
Year 2011<br />
Year 2010<br />
Underlying Underlying<br />
per business area EBIT EBITDA EBIT EBITDA<br />
Bauxite & Alumina 969 2 865 1 225 3 061<br />
Primary Metal 2 495 4 753 816 3 006<br />
Metal Markets 441 542 321 428<br />
Rolled Products 673 1 126 864 1 318<br />
Extruded Products 151 655 444 987<br />
Energy 1 883 2 018 1 416 1 540<br />
Other and eliminations (389) (341) (945) (889)<br />
Underlying EBIT / EBITDA 6 223 11 619 4 141 9 450
Liquidity and capital resources<br />
The table below includes information on <strong>Hydro</strong>'s liquidity, debt, investments and financial position and performance for the<br />
years indicated. See note 35 to the consolidated financial statements for more information on <strong>Hydro</strong>'s capital management<br />
practices, which include borrowing facilities, share buybacks and definitions and amounts relating to adjusted interest-bearing<br />
debt, adjusted equity and funds from operations. See the shareholder information section of this report for more information<br />
on <strong>Hydro</strong>'s dividend policy, share buybacks and funding and credit rating.<br />
Liquidity and financial position<br />
NOK million, except ratios and RoaCE<br />
FINANCIAL AND OPERATING PERFORMANCE<br />
Liquidity and capital resources 101<br />
Net cash provided by operating activities 7 277 6 363<br />
Cash and cash equivalents 8 365 10 929<br />
Shortterm investments 1)<br />
1 780 1 321<br />
Liquid assets 10 145 12 250<br />
Bank loans and other interestbearing shortterm debt (4 248) (940)<br />
Longterm debt (4 190) (328)<br />
Net interest bearing (debt) assets 1 707 10 982<br />
Adjusted net interestbearing (debt) assets 2)<br />
(19 895) (6 427)<br />
Adjusted net interestbearing debt to adjusted equity ratio 2)<br />
0.24 0.11<br />
Investments 3)<br />
48 025 6 231<br />
Capital employed 83 460 46 460<br />
Return on average capital employed (RoaCE) 11.8 % 3.8 %<br />
Adjusted funds from operations / Adjusted net interestbearing debt 0.42 1.18<br />
1) <strong>Hydro</strong>'s policy is that the maximum maturity for cash deposits is 12 months. Cash flows relating to bank time deposits with original maturities beyond<br />
three months are classified as investing activities and included in short-term investments on the balance sheet. See note 18 to the consolidated financial<br />
statements for more information on short-term investments.<br />
2) Mainly comprised of net unfunded pension obligations after tax, the present value of operating lease obligations and interest-bearing debt held by equity<br />
accounted investees. See note 35 to the consolidated financial statements for more information on adjusted net interest-bearing debt and adjusted equity.<br />
3) Additions to property, plant and equipment (capital expenditures) plus long-term securities, intangible assets, long-term advances and investments in<br />
equity accounted investments. For 2011, investments include NOK 43 376 million related to the acquisition of Vale Aluminium.<br />
Cash flow and liquidity<br />
<strong>Hydro</strong> manages its liquidity at the corporate level, ensuring sufficient funds to cover group operational requirements.<br />
In 2011, cash provided by operating activities of NOK 7.3 billion was more than sufficient to cover operating requirements<br />
and investments of NOK 4.3 billion 1), as well as dividend payments of NOK 1.8 billion. Sales of non-strategic assets amounted<br />
to NOK 1.4 billion representing an additional source of cash, in addition to net loan proceeds of NOK 0.9 billion. In addition<br />
to operating and investment activities, the main use of cash was a net payment of NOK 5.8 billion made in connection with<br />
the Vale Aluminium acquisition.<br />
Available credit facilities and the commercial paper market were used to cover fluctuations in cash flow during the year.<br />
Net interest bearing assets declined from NOK 11.0 billion at the end of 2010 to NOK 1.7 billion at the end of 2011, mainly<br />
due to the net payment of NOK 5.8 billion discussed above and debt assumed of NOK 5.7 billion, both related to the Vale<br />
transaction. The increase in adjusted net interest bearing debt reflected the decline in net interest bearing assets as well as an<br />
increase in net pension liabilities and liabilities assumed from the Vale Aluminium acquisition.<br />
<strong>Hydro</strong>'s adjusted net interest bearing debt to adjusted equity ratio was well below its targeted maximum ratio of 0.55. Our<br />
adjusted funds from operations/adjusted net interest bearing debt ratio was above our targeted minimum of 0.40.<br />
Volatility in market prices of aluminium, raw materials and exchange rates, as well as working capital developments, represent<br />
factors which add uncertainty to the development of <strong>Hydro</strong>'s cash position. Furthermore, due to uncertain economic<br />
conditions, future production and sales volumes are difficult to predict and thereby add additional uncertainty. See the section<br />
on risk review, including risk factors and market and commercial risk, in this report for additional information, including<br />
sensitivities to aluminium prices and currency-rate fluctuations.<br />
Year<br />
2011<br />
Year<br />
2010
102<br />
FINANCIAL AND OPERATING PERFORMANCE<br />
Cash flow and liquidity<br />
<strong>Hydro</strong> expects that cash from continuing operations, together with its liquidity holdings and available credit facilities, will be<br />
sufficient to cover planned capital expenditures, operational requirements, and financing activities in 2012.<br />
1) Excluding amounts relating to the Vale Aluminium acquisition.<br />
Long-term borrowing and funding requirements<br />
Norsk <strong>Hydro</strong> ASA has a USD 1.7 billion revolving multi-currency credit facility with a syndicate of international banks,<br />
maturing in July 2014. There was no borrowing under the facility as of December 31, 2011. See note 30 to the consolidated<br />
financial statements for additional information.<br />
Planned capital expenditures and other potential financing requirements in 2012 will be covered by internally generated funds<br />
in addition to external funding.<br />
<strong>Hydro</strong> has the ambition over time to access the national and international bond markets as its primary source for external<br />
funding of long-term capital requirements. The revolving facility will continue to serve primarily as a back-up for unforeseen<br />
funding requirements and will therefore be maintained as a reserve.<br />
Contractual and other obligations, commitments and off-balance sheet arrangements<br />
A summary of <strong>Hydro</strong>'s total contractual obligations and commercial commitments to make future payments is presented<br />
below. For further information, see notes 15 Operating leases, 30 Long-term debt, 39 Contractual commitments and other<br />
commitments for future investments and 31 Provisions to <strong>Hydro</strong>'s consolidated financial statements.<br />
<strong>Hydro</strong> is contingently liable for certain guarantees amounting to NOK 11 billion, mainly related to jointly controlled entities<br />
and in connection with the sale of companies. This amount is excluded from the table below, and none of these amounts are<br />
recorded in the consolidated balance sheet as of the end of 2011. See note 37 Guarantees to <strong>Hydro</strong>'s consolidated financial<br />
statements for a description of such guarantees.<br />
Amounts in NOK million Total<br />
Payments due by period<br />
Less than 1<br />
year 13 years 35 years Thereafter<br />
Longterm debt including interest 5 510 1 134 2 382 992 1 001<br />
Operating lease obligations 5 881 513 872 772 3 724<br />
Unconditional purchase obligations 1)<br />
110 345 12 075 20 520 16 616 61 136<br />
Contractual commitments for PP&E 1 654 1 328 273 53 <br />
Shortterm and longterm provisions 2)<br />
4 700 1 422 765 567 1 946<br />
Total contractual and noncontractual obligations 128 090 16 472 24 812 19 001 67 807<br />
1) Unconditional purchase obligations exclude long-term contracts with part owned entities.<br />
2) Short-term and long-term provisions includes certain accruals and provisions which are non-contractual, but related to liabilities or obligations that are<br />
measurable and expected to occur in future periods.
FINANCIAL AND OPERATING PERFORMANCE<br />
Employee retirement plans 103<br />
Employee retirement plans<br />
<strong>Hydro</strong>'s employee retirement plans consist primarily of defined benefit pension plans. As of December 31, 2011, the projected<br />
benefit obligation associated with <strong>Hydro</strong>'s defined benefit plans was NOK 20.5 billion. The fair value of pension plan assets<br />
was NOK 12.6 billion, resulting in a net unfunded obligation relating to the plans of NOK 7.9 billion. In addition,<br />
termination benefit obligations and other pension obligations amounted to NOK 0.5 billion, resulting in a total net unfunded<br />
pension obligation of NOK 8.4 billion. <strong>Hydro</strong>'s net pension cost for 2011 amounted to NOK 0.7 billion. Cash outflows from<br />
operating activities in 2011 regarding pensions amounted to approximately NOK 0.7 billion. <strong>Hydro</strong> closed its main defined<br />
benefit retirement plans in Norway for new employees as of March 1, 2010, while around 20 percent of the existing employees<br />
chose to move to a new defined contribution plan with effect from June 1, 2010. See note 32 Employee retirement plans in the<br />
consolidated financial statements for more information on <strong>Hydro</strong>'s employee retirement plans.<br />
Minority interest and shareholders' equity<br />
Minority interest was NOK 6,988 million as of December 31, 2011, compared with NOK 1,025 million as of December 31,<br />
2010. Shareholders' equity amounted to NOK 85,168 million at the end of 2011, compared with NOK 57,246 million at the<br />
end of 2010. The main items impacting shareholders' equity in 2011 and 2010 included net income, currency-translation<br />
adjustments and dividends declared and paid. In addition, shareholders' equity in 2011 included approximately NOK 20<br />
billion relating to new shares issued to Vale Austria Holdings in connection with the acquisition of Vale Aluminium.<br />
Shareholders' equity in 2010 included approximately NOK 10 billion related to new shares issued in a rights offering that was<br />
completed in July. The increase in minority interest compared to 2010 related to significant minority interests in subsidiaries<br />
acquired in connection with the Vale transaction.<br />
See the consolidated statements of changes in equity and note 34 Shareholders' equity to <strong>Hydro</strong>'s consolidated financial<br />
statements for a detailed reconciliation of shareholders' equity.<br />
Investments<br />
Investments in 2011 amounted to NOK 48,025 million, compared with NOK 6,231 million in 2010.<br />
Investments 1)<br />
Year Year % change<br />
NOK million 2011 2010 prior year<br />
Bauxite & Alumina 36 865 65 >100%<br />
Primary Metal 9 505 4 900 94 %<br />
Metal Markets 103 148 (30)%<br />
Rolled Products 435 296 47 %<br />
Extruded Products 515 434 19 %<br />
Energy 564 284 98 %<br />
Other and eliminations 39 105 (62)%<br />
Total 48 025 6 231 >100%<br />
1) Additions to property, plant and equipment (capital expenditures) plus long-term securities, intangible assets, long-term advances and investments in nonconsolidated<br />
investees.<br />
In 2011, <strong>Hydro</strong> continued to focus on securing its liquidity position. Except for the Vale Aluminium acquisition, investments<br />
were mainly limited to maintenance activities to safeguard our production assets. A summary of the significant investments that<br />
were made in addition to maintenance activities is included below.<br />
Investments for Bauxite & Alumina in 2011 related mainly to the assets acquired in the Vale Aluminium transaction<br />
amounting to NOK 35,321 million.<br />
In 2011, the main investment for Primary Metal was related to the Albras smelter acquired from Vale amounting to NOK<br />
8,055 million. In 2010, the major investment was related to development of the Qatalum primary aluminium plant in Qatar.
104<br />
FINANCIAL AND OPERATING PERFORMANCE<br />
Investments<br />
Investments for Rolled Products in 2011 included expenditures related to the upgrading of our Grevenbroich and Hamburg<br />
plants. Both upgrading projects are expected be completed in 2012.<br />
In 2011, investments for Extruded Products included initial investments for two new presses in Suzhou, China, and one new<br />
press in Acro, Brazil. The presses in Suzhou are expected to be completed in 2012, and in Acro in 2013.<br />
Investments for Metal Markets in 2010 included new capacity in Taiwan and an expansion of the Rackwitz plant in Germany.<br />
In 2011, investments in Energy included new power stations at Holsbru and Vasstøl. Investments also included a major<br />
upgrade project at Rjukan and an upgrade of the Herva Power station. Investments for Energy in 2010 included amounts<br />
relating to the new power station at Holsbru.<br />
Return on average Capital Employed (RoaCE)<br />
<strong>Hydro</strong> uses (underlying) RoaCE to measure the performance for the group as a whole and within its operating segments, both<br />
in absolute terms and comparatively from period to period. Management views this measure as providing additional<br />
understanding of the rate of return on investments over time in each of its capital intensive businesses, and in the operating<br />
results of its business segments.<br />
(Underlying) RoaCE is defined as (underlying) "Earnings after tax" divided by average "Capital Employed." (Underlying)<br />
"Earnings after tax" is defined as (underlying) "Earnings before financial items and tax" less "Adjusted income tax expense."<br />
Since RoaCE represents the return to the capital providers before dividend and interest payments, adjusted income tax expense<br />
excludes the tax effects of items reported as "Financial income (expense), net" and in addition, for underlying figures, the tax<br />
effect of items excluded. "Capital Employed" is defined as "Shareholders' Equity", including minority interest plus long-term<br />
and short-term interest-bearing debt less "Cash and cash equivalents" and "Short-term investments." Capital Employed can be<br />
derived by deducting "Cash and cash equivalents," "Short-term investments" and "Short-term and long-term interest free<br />
liabilities" (including deferred tax liabilities) from "Total assets." The two different approaches yield the same value.<br />
Underlying <strong>Report</strong>ed<br />
NOK million 2011 2010 2011 2010<br />
EBIT 6 133 3 351 9 827 3 184<br />
Adjusted Income tax expense (1 938) (1 505) (2 151) (1 442)<br />
EBIT after tax 4 195 1 845 7 676 1 742<br />
31 December<br />
NOK million 2011 2010 2009<br />
Current assets 1)<br />
28 040 24 567 23 710<br />
Property, plant and equipment 64 192 24 849 25 647<br />
Other assets 2)<br />
30 176 27 122 24 150<br />
Other current liabilities (16 968) (14 970) (13 032)<br />
Other longterm liabilities 3)<br />
(21 980) (15 108) (15 274)<br />
Capital Employed 83 460 46 460 45 200<br />
Underlying <strong>Report</strong>ed<br />
Return on average Capital Employed (RoaCE) 2011 2010 2011 2010<br />
<strong>Hydro</strong> 4)<br />
6.5 % 4.0 % 11.8 % 3.8 %<br />
Business areas 5)<br />
Bauxite & Alumina 2.8 % 7.3 % 18.4 % 9.5 %<br />
Primary Metal 5.7 % 1.0 % 2.9 % 1.0 %<br />
Metal Markets 13.4 % 9.7 % 13.8 % 4.8 %<br />
Rolled Products 5.8 % 7.7 % 0.3 % 10.9 %<br />
Extruded Products 1.9 % 5.5 % (2.9) % 5.2 %<br />
Energy 29.5 % 21.4 % 50.2 % 21.7 %<br />
1) Excluding cash and cash equivalents and short-term investments.<br />
2) Including deferred tax assets.
3) Including provisions for pension and deferred tax liabilities.<br />
FINANCIAL AND OPERATING PERFORMANCE<br />
Return on average Capital Employed (RoaCE) 105<br />
4) RoaCE is based on Adjusted Income tax expense calculated excluding tax on financial items. Underlying RoaCE is, in addition, adjusted with the tax effect<br />
of items excluded of NOK 213 million and NOK (63) million for 2011 and 2010, respectively.<br />
5) RoaCE at business area level is calculated using a 30 percent tax rate. For Energy, a 50 percent tax rate is used, adjusted for the sale of SKS.<br />
Additional information<br />
See note 8 to the consolidated financial statements for additional financial information relating to <strong>Hydro</strong>'s operating segments.<br />
Following is a table of underlying EBITDA for each of the operating segments:<br />
Underlying EBITDA<br />
NOK million<br />
Year<br />
2011<br />
Year<br />
2010<br />
% change<br />
prior year<br />
Bauxite & Alumina 2 480 661 >100 %<br />
Primary Metal 4 671 2 374 97 %<br />
Metal Markets 542 428 27 %<br />
Rolled Products 1 126 1 318 (15) %<br />
Extruded Products 655 987 (34) %<br />
Energy 2 018 1 540 31 %<br />
Other and eliminations (341) (887) 62 %<br />
Total 11 152 6 420 74 %
Indicative price and currency sensitivities +10% 1)<br />
NOK million EBIT<br />
Financial<br />
items<br />
Income<br />
before tax<br />
Net<br />
income<br />
Net income<br />
attributable<br />
to majority<br />
shareholders<br />
LME 2 800 - 2 800 2 150 1 900<br />
USD 2 300 (550) 1 750 1 200 1 100<br />
BRL (850) 750 (100) (75) (50)<br />
EUR (150) (1 150) (1 300) (900) (900)<br />
1) Assumptions: <strong>Annual</strong> sensitivities based on expected business volumes for 2012,<br />
LME USD 2,200, NOK/USD 5.70, NOK/BRL 3.35 and NOK/EUR 7.70. Aluminium price sensitivity is<br />
net of aluminium price indexed costs and excluding unrealized effects related to operational hedging.<br />
Currency sensitivities relating to financial items includes effects from intercompany positions.<br />
riSk review<br />
Index<br />
107<br />
04:<br />
Risk review<br />
Risk factors p.108<br />
Market and commercial risk p.112<br />
Legal proceedings p.113<br />
Quick overview<br />
<strong>Hydro</strong> faces many risks and uncertainties within its worldwide<br />
business operations and the global marketplace. We are exposed to<br />
changing economic and market conditions and price volatility can<br />
have a significant impact on <strong>Hydro</strong>’s reported and operating results.<br />
Repositioning and restructuring activities are important in determining<br />
the viability of our future aluminium operations.<br />
Our primary smelting operations are highly dependent on securing<br />
substantial amounts of energy at competitive prices. We are exposed<br />
to increasingly onerous legislation on CO 2 emissions that impact<br />
<strong>Hydro</strong> directly, relating to aluminium production, and indirectly, through<br />
higher power prices.<br />
Risk management in <strong>Hydro</strong> is based on the principle that risk<br />
evaluation is an integral part of all business activities. <strong>Hydro</strong>’s main<br />
strategy for mitigating risk related to volatility in cash flow is to<br />
maintain a solid financial position and strong credit worthiness. <strong>Hydro</strong><br />
is also taking proactive measures to reduce credit risk, improve its<br />
financial position and further adjust the cost of its smelter operations.
108<br />
RISK REVIEW<br />
Risk factors<br />
Risk factors<br />
Below is a description of certain risks that may affect our business, financial condition and the results of operations from time<br />
to time and, hence, our share price. All of the information in this report should be carefully considered, in particular, the risks<br />
described below.<br />
Continued uncertainty and volatility in global economic and market conditions could have an adverse effect on our<br />
operating results and liquidity<br />
Our financial condition and results of operations depend heavily on developments in market demand and global economic<br />
conditions. Market demand and prices declined dramatically in the final quarter of 2008 and first part of 2009 leading to<br />
considerable losses within <strong>Hydro</strong>'s upstream operations and substantially lower earnings for the company as a whole in 2009.<br />
Prices strengthened and demand recovered close to pre-crisis levels in 2010 and <strong>Hydro</strong>'s underlying operating performance<br />
improved significantly in 2011 following the strong recovery in the previous year. However, there has also been a substantial<br />
increase in uncertainty regarding economic developments within the various countries and geographic regions in which we<br />
operate. In Europe, the fiscal crisis has escalated resulting in deteriorating economic conditions in several countries and<br />
southern Europe in particular. It remains to be seen whether initiatives implemented by the EU will be sufficient to adequately<br />
address the underlying fiscal and economic problems. Although considered remote, there is a risk of failure within the currency<br />
union and the political union as a whole. Recovery has been weak in the US and growth has slowed in China and other major<br />
emerging markets.<br />
Based on operating revenues, around 50 percent of <strong>Hydro</strong>'s business is generated within the EU and about 70 percent in<br />
Europe in total. Of this amount, southern Europe represents about 15 percent. Nearly 80 percent of <strong>Hydro</strong>'s business is<br />
generated within Europe and the US combined.<br />
A failure of the Euro or European Union would have far reaching consequences for both Europe and the world economy. In<br />
addition to the indirect effects of a severe general macroeconomic downturn, <strong>Hydro</strong>'s counterparty risk towards key customers<br />
or groups of customers in weak and deteriorating economies could increase significantly. See also risk factor below "<strong>Hydro</strong><br />
faces the risk of counterparty default".<br />
Despite significant curtailments, the global production of primary metal excluding China continues to exceed market demand<br />
and inventories remain at high levels.<br />
Significant cost pressures in the countries in which we operate may inhibit our ability to reduce the operating cost of<br />
our smelter portfolio sufficiently to compensate for an extended period of weak aluminium prices<br />
<strong>Hydro</strong> acted quickly to reduce costs and production capacity following the severe market decline at the end of 2008 and into<br />
2009 but was unable to adjust the costs of its primary smelters sufficiently to avoid substantial underlying operating losses<br />
within its primary aluminium business during 2009. <strong>Hydro</strong> has implemented an improvement program targeting savings<br />
within its wholly owned smelter operations of USD 300 per mt by the end of 2013. However, cost pressure has increased, in<br />
particular raw material costs, which has more than offset targeted savings that were achieved.<br />
The majority of <strong>Hydro</strong>'s smelters are located in countries experiencing strong currencies and/or inflationary pressures such as<br />
Norway, Australia, Brazil, Qatar and Canada. These factors increase our operating costs and weaken our competitive position<br />
in some of the regions where we operate. In January, <strong>Hydro</strong> announced a partial curtailment of its Australian smelter which has<br />
been negatively impacted by the strong Australian dollar.<br />
We may not succeed in making the cost reductions necessary to achieve a sustainable level of profitability for our smelters'<br />
operations in the event of an extended period of weak aluminium prices.<br />
A deterioration of our financial position or a downgrade of our ratings by credit rating agencies could increase our<br />
borrowing cost and cost of capital and have an adverse effect on our business relationships<br />
It is important for <strong>Hydro</strong> to maintain its investment grade credit rating for competitive access to capital and to support its<br />
business relationship with customers, suppliers and other counterparties. Our credit rating is also an important factor in<br />
making <strong>Hydro</strong> attractive as a joint venture partner for new growth initiatives. Following the severe market downturn in the<br />
aluminium industry at the end of 2008 and beginning of 2009, our ratings were downgraded, together with other competitors
RISK REVIEW<br />
Risk factors 109<br />
in the aluminium industry, with one of our ratings reaching the lowest investment grade level. In November 2010 this rating<br />
was upgraded reflecting an improved outlook for <strong>Hydro</strong>'s ability to meet future commitments. Any deterioration of our<br />
financial position or another downgrade of our credit rating could increase our borrowing costs and have an adverse effect on<br />
our business relationships and attractiveness for major projects, contracts and other agreements.<br />
Price volatility can impact our operating costs and can also have a substantial effect on our reported operating<br />
results<br />
Commodity price volatility in general has increased significantly in recent years and can have significant impact on our<br />
operating results. Commodity price volatility, including raw material commodities such as oil, petroleum, coke and coal, can<br />
significantly impact our operating costs directly and can also have a substantial effect on our reported operating results due to<br />
realized and unrealized gains and losses on derivative instruments. Underlying results for our trading and hedging operations<br />
are subject to substantial variations in periods of significant fluctuations of spot and forward prices for aluminium.<br />
<strong>Hydro</strong>'s reported results and competitive position are exposed to changes in currency exchange rates<br />
<strong>Hydro</strong> has a substantial portion of its primary capacity based in Norway and its accounting and reporting currency is the<br />
Norwegian krone. Primary aluminium prices and a major part of the raw materials for producing aluminium are denominated<br />
in US dollars. Following the completion of the Vale aluminium acquisition, roughly half of <strong>Hydro</strong>'s capital employed is located<br />
in Brazil. Much of <strong>Hydro</strong>'s downstream business is based in Europe and a large portion of the production is sold in Euro while<br />
export sales are typically denominated in US dollars. As a result of these exposures, the relative value of the US dollar, Brazilian<br />
Real and Euro are of high importance to <strong>Hydro</strong>'s operating results. Changes in the value of these currencies can be significant<br />
and volatile. See the following section on "Market and commercial risk" for more information on <strong>Hydro</strong>'s exposure and<br />
sensitivities to currency movements.<br />
Periodic revaluation of foreign-denominated balances can have a significant impact on earnings. Revaluation upon realization<br />
of such balances can have a significant effect on both earnings and cash. The value of investments committed in foreign<br />
currencies is sensitive to currency movements.<br />
Failure or delays in the execution of major projects could have a negative impact on our competitive position<br />
The execution of major investment projects is subject to the risk of delays, cost increases, availability of adequate funding and<br />
other complications. Completing the ramp-up of production at Qatalum in Qatar was delayed until the third quarter of 2011<br />
following a power outage that stopped production at the plant in August 2010. Realizing the expected benefits from Qatalum<br />
is dependent upon securing efficient operations of the plant and the successful marketing of the full production volumes.<br />
<strong>Hydro</strong>'s strategy is to focus on business opportunities that enhance the cost position of its operations. We have several potential<br />
development projects which would require substantial funding. Such funding may not be available or become increasingly<br />
expensive when desired.<br />
Failure or delays in the execution of major projects could result in additional costs and lost operating revenues in addition to<br />
weakening our competitive position, which would in turn have a negative impact on our future operating results.<br />
<strong>Hydro</strong> may not realize the benefits expected from the integration of the Vale aluminium business into its existing<br />
operations.<br />
The integration of the Vale aluminium business into <strong>Hydro</strong>'s existing operations may expose <strong>Hydro</strong> to additional risks and<br />
losses and <strong>Hydro</strong> cannot be certain that it will realize the expected benefits from anticipated business opportunities, revenue<br />
enhancements or growth levels or that such results can be achieved in the time frame expected. <strong>Hydro</strong>'s ability to benefit from<br />
enhanced business opportunities is, among other things, dependent on business conditions in future periods that cannot be<br />
predicted or measured with certainty.<br />
<strong>Hydro</strong> may have insufficient managerial and technical know-how and other resources that can be directly applied to manage its<br />
new business operations. This may result in a delay or failure to realize the full value of the business acquired. <strong>Hydro</strong> may also<br />
be required to allocate additional managerial resources to manage the new operations which may divert attention and resources<br />
from other parts of its business.<br />
Costs associated with operating a mine may be unpredictable and may increase rapidly as a result of, among others, production<br />
interruptions or delays, increased or new license requirements and fees, new or increased royalties and/or indirect taxes, changes
110<br />
RISK REVIEW<br />
Risk factors<br />
or variations in geologic conditions, environmental hazards and weather and other natural phenomena, mining and processing<br />
equipment failures and unexpected maintenance problems and interruptions due to transportation delays.<br />
The acquisition of title to mineral concessions in Brazil is a detailed and time-consuming process. Failure to comply with the<br />
requirements of the Brazilian Department of Mines with respect to exploration permits and mining concessions may result in a<br />
loss of title. Third parties (including, but not limited to, indigenous persons) may dispute title to mineral concessions or the<br />
right to conduct mining or exploration activities. In addition, such properties may be subject to undetected or undisclosed<br />
defects.<br />
The bauxite reserves acquired in the Vale transaction and the estimated quantities of bauxite that <strong>Hydro</strong> expects can be<br />
economically mined and processed are subject to material uncertainties.<br />
Business development is more likely to occur in emerging and transitioning markets<br />
Following the acquisition of the Vale aluminium business and the completion of the Qatalum smelter, the geographic<br />
distribution of <strong>Hydro</strong>'s business has changed significantly. New primary smelter, alumina and bauxite capacity is expected to<br />
be mainly located in countries characterized by emerging and transitioning markets. <strong>Hydro</strong> is also targeting growth in its<br />
downstream business in emerging and transitioning markets such as China and Brazil.<br />
Investing in emerging and transitioning markets is demanding in terms of organizational capacity, effort, knowledge and<br />
experience and <strong>Hydro</strong> may not be capable of succeeding in expanding its business in such markets.<br />
Investments in emerging and transitioning markets may create exposure to economic structures that are generally less diverse<br />
and mature and may involve increased risks of severe inflation, fluctuation in currency rates, changing laws and judicial<br />
interpretations, disputes over ownership of land and other property and diverging financial, commercial or disclosure practices.<br />
Legal, fiscal and regulatory systems in emerging and transitioning markets may be less stable and have a lower degree of<br />
transparency and predictability, making investment evaluation and any eventual implementation more difficult. Lower<br />
transparency may also create exposure to actual or perceived corruption increasing the risk to the reputation of companies<br />
operating in such markets.<br />
Conducting business in emerging and transitioning markets may be affected by political instability or unpredictability resulting<br />
from national or regional political transitions. Conducting business in emerging and transitioning markets may also be affected<br />
by government regulations with respect to restrictions on production, price controls, export controls, restrictions on<br />
repatriation of profits, payment of dividends, income taxes, expropriation of property, environmental legislation and mine<br />
safety. The Brazilian government has in the past intervened in the Brazilian economy and has occasionally made substantial<br />
changes in policy.<br />
Our downstream business is exposed to competition from China<br />
China has in recent years imposed duties designed to reduce the export of aluminium metal, while also encouraging domestic<br />
production of more labor intensive semi-fabricated and finished aluminium products. This development exposes our<br />
downstream business to lower-priced exports from China.<br />
Emerging or transitioning markets present a competitive threat to our business<br />
Emerging or transitioning markets in countries with abundant natural resources, low-cost labor and energy, and lower<br />
environmental and other standards, have posed and may continue to pose a significant competitive threat to our business. In<br />
2007, the European Union (EU) reduced its duty on unalloyed aluminium. Any further reductions or cancellation of these<br />
duties could result in increased imports of primary aluminium to the EU market from sources such as Russia and the Middle<br />
East.<br />
<strong>Hydro</strong> is exposed to increasingly demanding legislation on reducing CO 2 emissions<br />
<strong>Hydro</strong> has substantial smelter operations located in Europe. Legislation regulating CO 2 emissions has resulted in higher power<br />
prices for our European operations but to a lesser extent for our Norwegian smelters in the short to medium term, since most<br />
of the electricity consumption in Norway is covered by our own equity production or through long-term supply contracts. The<br />
EU has enacted emissions regulations that will apply directly to CO 2 emissions from our smelter operations in Norway and in<br />
the EU from 2013 onward. Although there will be some compensation available to aluminium producers, these regulations are<br />
likely to be more demanding than those being contemplated in other regions of the world including China and Russia and
RISK REVIEW<br />
Risk factors 111<br />
could negatively impact our competitive position. See also the section in this report on Regulation and taxation for more<br />
information pertaining to climate gases.<br />
Our aluminium operations, and in particular our smelters, are dependent upon large volumes of energy<br />
Our position could be materially affected by the inability to replace, on competitive terms, our long-term energy supply<br />
contracts when they expire, or our own equity production to the extent that concessions revert to the Norwegian state. See also<br />
the section in this report on Regulation and taxation for more information pertaining to the Norwegian regulatory system for<br />
hydroelectric production.<br />
Future acquisitions, mergers, or strategic alliances may adversely affect our financial condition<br />
<strong>Hydro</strong> may undertake acquisitions additional to the Vale aluminium business in the future and may not be able to realize<br />
benefits expected for such transactions. Acquisitions may contain significant unidentified liabilities which could have a material<br />
adverse effect on our financial position.<br />
Increasing investments in jointly owned entities reduces <strong>Hydro</strong>'s ability to manage its business portfolio<br />
Investment as a minority partner in jointly owned entities and associates reduces <strong>Hydro</strong>'s ability to manage and control this<br />
part of its portfolio. Investments in jointly owned entities, including those in which we hold a majority position also entail the<br />
risk of diverging interests between business partners, which could impede <strong>Hydro</strong>'s ability to realize its objectives, repatriate<br />
funds from such entities and to achieve full compliance with its standards.<br />
We may not succeed in developing technological solutions to support our growth strategies<br />
Being at the forefront of technological development is important to remain competitive. <strong>Hydro</strong> is engaged in the development<br />
of new "next generation" cell and smelter technology together with key suppliers. We may fail to develop these technologies on a<br />
timely basis or they may not be commercially feasible, thereby resulting in a negative impact on our competitive position.<br />
<strong>Hydro</strong> faces the risk of counterparty default<br />
A significant downturn in the business or financial condition of a key customer or group of customers exposes us to the risk of<br />
default on contractual agreements and trade receivables, which would have a negative impact on our operational results. Weak<br />
and deteriorating economic conditions on a global, regional or industry sector level increases the risk of defaulting<br />
counterparties and may reduce or make prohibitively expensive credit insurance to cover such risk.<br />
Major accidents could result in substantial claims, fines or significant damage to <strong>Hydro</strong>'s reputation<br />
Some of our operations are located in close proximity to sizable communities. Major accidents due to human error, systems<br />
failures, deliberate sabotage, extreme weather or other natural disasters, could result in loss of life or extensive damage to the<br />
environment or communities. Such events could result in major claims, fines, penalties and significant damage to <strong>Hydro</strong>'s<br />
reputation.<br />
<strong>Hydro</strong> could be negatively affected by legal proceedings or investigations<br />
<strong>Hydro</strong> could be negatively affected by criminal or civil proceedings related to, but not limited to product liability,<br />
environment, health and safety, alleged breaches of anti-competitive, anti-corruption practices or other integrity legislation or<br />
commercial disputes. See also the section of this report on Viability for more information on issues relating to integrity and<br />
transparency, and Legal proceedings in this Risk review section for more information on these matters. Violation of applicable<br />
laws and regulations could result in substantial fines or penalties, costs of corrective works and, in rare instances, the suspension<br />
or shutdown of our operations and substantial damage to the company's reputation.<br />
<strong>Hydro</strong> may be subject to unforeseen liabilities for environmental damage<br />
Environmental laws may impose cleanup liability on owners and occupiers of contaminated property, including past or<br />
divested properties, regardless of whether the owners and occupiers caused the contamination or whether the activity that<br />
caused the contamination was lawful at the time it was conducted. Many of our present and former operations are and were<br />
located on properties with a long history of industrial use. See also the section in this report on Regulation and taxation for<br />
more information pertaining to Environmental matters.<br />
<strong>Hydro</strong> could be adversely affected by disruptions of our operations and may not be able to maintain sufficient<br />
insurance to cover all risks related to its operations<br />
<strong>Hydro</strong>'s business is subject to a number of risks and hazards which could result in damage to properties and production<br />
facilities, personal injury or death, environmental damages, monetary losses and possible legal liability. Breakdown of<br />
equipment, power failures or other events, including catastrophic events such as natural disasters and major military conflicts
112<br />
RISK REVIEW<br />
Risk factors<br />
leading to production interruptions in our plants could have a material adverse effect on our financial results and cash flows.<br />
Although <strong>Hydro</strong> maintains insurance to protect against certain risks in such amounts as it considers reasonable, its insurance<br />
may not cover all the potential risks associated with <strong>Hydro</strong>'s operations.<br />
<strong>Hydro</strong> is subject to a broad range of laws and regulations<br />
<strong>Hydro</strong> is subject to a broad range of laws and regulations in the countries and legal jurisdictions in which we operate. These<br />
laws and regulations impose stringent standards and requirements and potential liabilities regarding accidents and injuries, the<br />
construction and operation of our plants and facilities, air and water pollutant emissions, the storage, treatment and discharge<br />
of waste waters, the use and handling of hazardous or toxic materials, waste disposal practices, and the remediation of<br />
environmental contamination, among other things. We believe we are in material compliance with currently applicable laws<br />
and regulations. However, these laws and regulations may change or new laws and regulations enacted requiring substantial<br />
costs for compliance, reducing profitability or having a negative impact on our competitive position.<br />
<strong>Hydro</strong> may be subject to liabilities relating to businesses transferred to successor companies<br />
<strong>Hydro</strong> has certain joint liabilities under Norwegian statutory regulations following from demergers. Under the Norwegian<br />
public limited companies act section 14-11, <strong>Hydro</strong> and Statoil are jointly liable for liabilities accrued before the demerger date<br />
of October 1, 2007. This statutory liability is unlimited in time, but is limited in amount to the net value allocated to the nondefaulting<br />
party in the demerger. Similarly, <strong>Hydro</strong> and Yara International ASA are jointly liable for liabilities accrued before<br />
the demerger date of March 24, 2004, on the same conditions.<br />
Rights and legal remedies may be limited for certain classes of shareholders<br />
The exercise of shareholder rights such as voting and preferential subscription rights may not be available to beneficial<br />
shareholders whose shares are registered in a nominee account, and not in the shareholders' own names with the Norwegian<br />
Central Securities Depository, Verdipapirsentralen (VPS). <strong>Hydro</strong> cannot guarantee that beneficial shareholders will receive the<br />
notice for a general meeting in time to instruct their nominees to affect a re-registration of their shares. <strong>Hydro</strong> is organized<br />
under the laws of the Kingdom of Norway. It may be difficult for investors to effect service of process outside Norway upon<br />
<strong>Hydro</strong> or its directors and executive officers, or to enforce against <strong>Hydro</strong> or its directors and executive officers judgments<br />
obtained in other jurisdictions. Norwegian courts are unlikely to apply other than Norwegian law when deciding on civil<br />
liability claims under securities laws.<br />
Market and commercial risk<br />
Risk management in <strong>Hydro</strong> is based on the principle that risk evaluation is an integral part of all business activities. Business<br />
areas have the main responsibility for relevant risk management within their area. Corporate staff units establish policies and<br />
procedures for managing risk and coordinate an overall enterprise risk assessment.<br />
Financial position<br />
<strong>Hydro</strong>'s main strategy for mitigating risk related to volatility in cash flow is to maintain a strong balance sheet. Specific key<br />
financial ratios are targeted over the business cycle reflecting a solid financial position and strong credit worthiness. Examples<br />
include an adjusted net interest-bearing debt/equity ratio below 0.55 and a ratio of funds from operations to adjusted net<br />
interest-bearing debt above a level of 0.40. In addition, <strong>Hydro</strong> has established guidelines for liquidity reserves and for the<br />
profile of installment payments on debt in order to secure its financial position.<br />
Liquidity risk<br />
<strong>Hydro</strong>'s liquidity position at the end of 2011 is considered satisfactory and we do not expect any new long-term funding<br />
requirements in 2012. An undrawn committed credit facility from banks amounting to USD 1,7 billion remained outstanding<br />
from the previous year. A stand-by bank facility of NOK 10 billion was terminated at the beginning of 2011 as our liquidity<br />
position was considered adequate. <strong>Hydro</strong> continues to focus on cash flow and credit risk throughout the organization. We take a<br />
proactive approach toward customers to reduce credit risk and also monitor the financial performance of key suppliers in order<br />
to reduce the risk of default on operations and key projects.<br />
Prices and currency<br />
<strong>Hydro</strong>'s operating results are primarily affected by price developments of its main products, aluminium and power, in addition<br />
to fluctuations in the value of the Norwegian krone to the U.S. dollar and the Euro, which are the most significant currencies<br />
for <strong>Hydro</strong>. The Vale aluminium acquisition has increased our exposure to aluminium price developments and the Brazilian
Real. Our main risk management strategy for upstream operations is to accept exposure to aluminium and energy price<br />
movements, while at the same time focusing on reducing the average cost position of the smelter portfolio. In certain<br />
circumstances, derivatives may be used to mitigate overall financial and commercial risk exposures. For example, we have<br />
hedged the net aluminium price exposure in the Vale aluminium operations until the end of 2011.<br />
Downstream and other margin-based operations are to a certain extent hedged to protect processing and manufacturing<br />
margins against raw material price fluctuations. An operational hedging system has been established to protect commercial<br />
contracts from aluminium price fluctuations.<br />
Other than the specific hedging activities described above, price and currency exposures are normally managed utilizing a<br />
holistic approach in which potential negative or positive correlations from other cost and income elements, including the effect<br />
of currency exchange rate fluctuations, are taken into consideration. <strong>Hydro</strong> may to a limited extent enter into forward contracts<br />
in currencies to hedge certain revenue and cost positions.<br />
An indication of the sensitivities regarding aluminium prices and foreign currency fluctuations for 2012 is provided in the table<br />
below. The table illustrates the sensitivity of earnings, before and after tax, to changes in these factors and is provided to<br />
supplement the sensitivity analysis required by IFRS, included in note 7 to the Consolidated Financial Statements.<br />
Indicative price and currency sensitivities +10% 1)<br />
NOK million EBIT<br />
LME 2 800<br />
USD 2 300<br />
BRL (850)<br />
EUR (150)<br />
Financial<br />
items<br />
(550)<br />
- 2 800<br />
Income<br />
before tax Net income<br />
1 750<br />
2 150<br />
1 200<br />
Net income<br />
attributable to<br />
majority<br />
shareholders<br />
1) Assumptions: <strong>Annual</strong> sensitivities based on expected business volumes for 2012, LME USD 2,200, NOK/USD 5.70, NOK/BRL 3.35 and NOK/EUR 7.70.<br />
Aluminium price sensitivity is net of aluminium price indexed costs and excluding unrealized effects related to operational hedging. Currency sensitivities<br />
relating to financial items includes effects from intercompany positions.<br />
In addition to the above sensitivities, the revaluation of derivative instruments and contracts classified as derivatives may<br />
influence reported earnings. For accounting purposes, derivative financial and commodity instruments are recognized at fair<br />
value, with changes in fair value impacting earnings unless specific hedge criteria are met. This can result in volatility in<br />
earnings, since the associated gain or loss on the related physical transactions may be reported in earnings in different periods.<br />
Please see note 7 and 41 to the Consolidated Financial Statements for a detailed description of <strong>Hydro</strong>'s commercial and<br />
financial risk exposures and hedging activities related to such exposures.<br />
In accordance with IFRS requirements, <strong>Hydro</strong> has chosen to provide information about market risk and potential exposure to<br />
hypothetical loss from its use of derivative financial instruments and other financial instruments, and derivative commodity<br />
instruments through sensitivity analysis disclosures. Please see note 7 to the Consolidated Financial Statements for more<br />
information, and for additional information on these disclosures.<br />
Legal proceedings<br />
750<br />
(1 150)<br />
(100)<br />
(1 300)<br />
RISK REVIEW<br />
Market and commercial risk 113<br />
<strong>Hydro</strong> is involved in or threatened with various legal and tax matters arising in the ordinary course of business. <strong>Hydro</strong> is of the<br />
opinion that resulting liabilities, if any, will not have a material adverse effect on its consolidated results of operations, liquidity<br />
or financial position.<br />
(75)<br />
(900)<br />
1 900<br />
1 100<br />
(50)<br />
(900)
Share price development in 2011<br />
Share price development in 2011<br />
NOK<br />
55<br />
50<br />
45<br />
40<br />
35<br />
30<br />
25<br />
20<br />
Jan. Feb. Mar. Apr. May Jun. Jul. Aug. Sept. Oct. Nov. Dec.<br />
<strong>Hydro</strong><br />
Oslo Børs Benchmark Index<br />
S&P 500 Index<br />
sHAreHolDer InForMAtIon<br />
Index<br />
115<br />
05:<br />
Shareholder information<br />
Introduction p.116<br />
Dividend policy p.116<br />
Buyback of shares p.116<br />
funding and credit quality p.116<br />
Major shareholders<br />
and voting rights p.117<br />
Key figures for the <strong>Hydro</strong> share p.119<br />
Information from <strong>Hydro</strong> p.120<br />
<strong>Annual</strong> General Meeting p.120<br />
Change of address p.120<br />
financial calendar 2012 p.120<br />
QuICK overvIew<br />
<strong>Hydro</strong>’s share price closed at NOK 27.74 at the end of 2011. The<br />
return for 2011 was negative, amounting to NOK 14.87, or 35<br />
percent. <strong>Hydro</strong>’s Board of Directors proposes to pay a dividend of<br />
NOK 0.75 per share for 2011, for approval by the <strong>Annual</strong> General<br />
Meeting on May 8, 2012, reflecting the company’s strong<br />
commitment to provide a cash return to its shareholders. The dividend<br />
reflects the operational performance for 2011 and a strong financial<br />
position, also taking into consideration the uncertain market outlook.<br />
There were 2,036,459,019 outstanding shares at the end of 2011.<br />
<strong>Hydro</strong> had 54,625 registered shareholders as per the Norwegian<br />
Central Securities Depository. The Ministry of Trade and Industry of<br />
Norway was the largest of these with a shareholding of 34.26 percent<br />
of the total number of ordinary shares authorized and issued.<br />
<strong>Hydro</strong>’s shares are, in addition to the Oslo Stock Exchange, also<br />
listed in London while our American Depositary Shares (ADSs)<br />
trade on OTCQX International in the U.S., the premium over-thecounter<br />
market tier.
116<br />
SHAREHOLDER INFORMATION<br />
Introduction<br />
Introduction<br />
<strong>Hydro</strong>'s share price closed at NOK 27.74 at the end of 2011. The return for 2011 was negative with NOK 14.87, or 35<br />
percent. <strong>Hydro</strong>'s Board of Directors proposes to pay a dividend of NOK 0.75 per share for 2011, for approval by the <strong>Annual</strong><br />
General Meeting on May 8, 2012, reflecting the company's strong commitment to provide a cash return to its shareholders.<br />
The dividend reflects the operational performance for 2011 and a strong financial position, also taking into consideration the<br />
uncertain market outlook.<br />
There were 2,036,459,019 outstanding shares at the end of 2011. A total of 2.1 billion <strong>Hydro</strong> shares were traded on the Oslo<br />
Stock Exchange during 2010, representing 5.2 percent of the total turnover on the exchange in terms of share value.<br />
At the closing of the acquisition of Vale's aluminium assets on February 28, 2011, <strong>Hydro</strong> issued 447,834,465 new shares to<br />
Vale as part of the consideration in the transaction.<br />
<strong>Hydro</strong>'s shares are, in addition to the Oslo Stock Exchange, also listed in London while our American Depositary Shares<br />
(ADSs) trade on OTCQX International in the US, the premium over-the-counter market tier.<br />
Dividend policy<br />
Long-term returns to shareholders should reflect the value created by <strong>Hydro</strong>. Shareholders' returns consist of dividends and<br />
share price development. Over time, value creation should be reflected to a greater extent by share price development than<br />
through dividends. Our policy is to pay out, on average, 30 percent of net income as ordinary dividend over time to our<br />
shareholders. In setting the dividend for a specific year, we will take into consideration future earnings, future investment<br />
opportunities, the outlook for world commodity markets and our financial position. Share buybacks or extraordinary dividends<br />
will supplement ordinary dividends during periods of strong financials, due consideration being given to the commodity cycle<br />
and capital requirements for future growth. The total payout should reflect <strong>Hydro</strong>'s aim to give its shareholders competitive<br />
returns benchmarked against alternative investments in comparable companies.<br />
<strong>Hydro</strong>'s board of directors normally propose a dividend per share in connection with the publication of our fourth quarter<br />
results. The <strong>Annual</strong> General Meeting then considers this proposal in May each year, and the approved dividend is subsequently<br />
paid to shareholders in May or June. We pay dividends once each year. For non-Norwegian shareholders, Norwegian tax will<br />
be deducted at source in accordance with the current regulations.<br />
Buyback of shares<br />
In periods when earnings are high, <strong>Hydro</strong> may consider buying back shares in addition to ordinary or extraordinary dividend<br />
payments. This consideration will be made in the light of alternative investment opportunities and our financial situation. In<br />
circumstances when buying back shares are relevant, our board of directors proposes buyback authorizations to be considered<br />
and approved by the <strong>Annual</strong> General Meeting. Authorizations are granted for a specific time period and for a specific share<br />
price interval during which share buybacks can be made.<br />
Funding and credit quality<br />
Maintaining a strong financial position and an investment grade credit rating are viewed as important risk mitigating factors,<br />
supporting <strong>Hydro</strong>'s possibilities for strategic development of its businesses. Access to external financial resources is required in<br />
order to maximize value creation over time, balanced with acceptable risk exposure. To secure access to debt capital on<br />
attractive terms, we aim at maintaining an investment grade credit rating from the leading rating agencies.<br />
Contributing toward this ambition to retain our credit rating, we intend to keep our funds from operations at a level no less<br />
than 40 percent of net adjusted interest-bearing debt, in addition to net adjusted interest-bearing debt at a ratio not higher then<br />
0.55 to equity capital over time. In calculating this ratio, we include off-balance sheet pension obligations, operating lease<br />
commitments, share of net interest-bearing debt in joint ventures and certain other debt-like items. For a discussion of these<br />
adjustments see Note 35 - Capital Management in the Financial Statements section of this report.
Major shareholders and voting rights<br />
SHAREHOLDER INFORMATION<br />
Major shareholders and voting rights 117<br />
As of December 31, 2011, <strong>Hydro</strong> had 54,625 registered shareholders as per the Norwegian Central Securities Depository<br />
(VPS). The Ministry of Trade and Industry of Norway was the largest of these with a shareholding of 34.26 percent of the total<br />
number of ordinary shares authorized and issued, and 34.81 percent of the total shares outstanding. As of the same date, The<br />
Government Pension Fund - Norway (Folketrygdfondet) owned 4.24 percent of the total number of ordinary shares issued and<br />
4.31 percent of the total shares outstanding. In total, the Norwegian state owns 38.50 percent of the total number of ordinary<br />
shares issued and 39.12 percent of the total shares outstanding. There are no different voting rights associated with the ordinary<br />
shares held by the state.<br />
The Norwegian Ministry of Trade and Industry represents the Norwegian government in exercising the state's voting rights.<br />
The state has never taken an active role in the day-to-day management of <strong>Hydro</strong> and has for several decades not disposed of<br />
any of the ordinary shares owned by it, except when participating in the share buyback programs.<br />
At the closing of the acquisition of Vale's aluminium assets on February 28, 2011 <strong>Hydro</strong> issued 447,834,465 new shares to<br />
Vale as part of the consideration in the transaction. Vale therefore owns 21.65 percent of the total number of ordinary shares<br />
issued and 21.99 percent of the total shares outstanding. According to the agreement, Vale cannot increase its ownership<br />
beyond the 22 percent, is required to retain its shares for at least two years after the transaction closes and following the twoyear<br />
period not sell shares constituting more than 10 percent of <strong>Hydro</strong>'s issued shares to any single buyer or group.<br />
The state, represented by the Ministry of Trade and Industry has stated its intention to potentially increase its shareholding up<br />
to 39.9 percent through acquiring shares in the market.<br />
JPMorgan Chase & Co, as depositary of the ADSs, through its nominee company, Morgan Guaranty Trust Company, held<br />
interests in 10,390,127 ordinary shares, or 0.51 percent of the issued and outstanding ordinary shares as of December 31,<br />
2011. The interests are on behalf of approximately 430 registered holders of ADSs.<br />
All shares basically carry one vote. It is, however, a<br />
requirement of Norwegian legislation that a shareholder can<br />
only vote for shares registered in their name. Shares<br />
registered with a nominee account must be re-registered in<br />
the Norwegian Central Securities Depositary before the<br />
<strong>Annual</strong> General Meeting in order to obtain voting rights.<br />
This requirement also applies to our US-traded ADSs.
118<br />
SHAREHOLDER INFORMATION<br />
Major shareholders and voting rights<br />
<strong>Hydro</strong>'s 20 largest shareholders, December 31, 2011<br />
Shareholder Number of shares Ownership interest<br />
Ministry of Trade and Industry 708,865,253 34.3%<br />
Vale Austria Holdings Gmbh 447,834,465 21.6%<br />
Folketrygdfondet 87,699,011 4.2%<br />
Dodge & Cox 47,739,735 2.3%<br />
Rasmussengruppen AS 34,700,000 1.7%<br />
Norsk <strong>Hydro</strong> ASA 32,539,257 1.6%<br />
SAFE Investment Company Limited 29,710,438 1.4%<br />
BlackRock, Inc. 24,875,284 1.2%<br />
Silchester International Investors LLP 24,730,204 1.2%<br />
Storebrand Kapitalforvaltning AS 21,354,259 1.0%<br />
DnB NOR Kapitalforvaltning ASA 20,813,546 1.0%<br />
Skagen AS 19,060,043 0.9%<br />
KLP 18,713,723 0.9%<br />
Pareto Forvaltning AS 17,826,802 0.9%<br />
Altrinsic Global Advisors, LLC 17,236,490 0.8%<br />
State Street Corporation 14,421,048 0.7%<br />
APG Asset Management 12,877,736 0.6%<br />
ODIN Forvaltning AS 12,344,166 0.6%<br />
Danske Bank 11,396,187 0.6%<br />
UBS AG 10,133,463 0.5%<br />
Source: The data is provided by Thompson Reuters through the Share Register Analyses service. The data is obtained through the analysis of beneficial<br />
ownership Source: The and data fund is manager provided information by Thompson provided Reuters in replies through to disclosure the Share of Register ownership Analyses notices service. issued to The all custodians data is obtained on the through <strong>Hydro</strong> share the register. Whilst<br />
every analysis reasonable of beneficial effort ownership is made to verify and fund all data, manager Thompson information Reuters provided can not in guarantee replies to the disclosure accuracy of ownership the analysis. notices For a list issued of the to largest all shareholders as<br />
of<br />
custodians<br />
December<br />
on<br />
31,<br />
the<br />
2011,<br />
<strong>Hydro</strong><br />
from<br />
share<br />
the Norwegian<br />
register. Whilst<br />
Central<br />
every<br />
Securities<br />
reasonable<br />
Depositary<br />
effort<br />
(VPS),<br />
is made<br />
see<br />
to<br />
Note<br />
verify<br />
14<br />
all<br />
in Notes<br />
data, Thompson<br />
to the financial<br />
Reuters<br />
statements<br />
can not<br />
Norsk<br />
guarantee<br />
<strong>Hydro</strong> ASA.<br />
the accuracy of the analysis. For a list of the largest shareholders as of 31.12.2010 from the official VPS list, see Note 14 in Notes to<br />
the financial statements Norsk <strong>Hydro</strong> ASA.
Key figures for the <strong>Hydro</strong> share<br />
Key figures for the <strong>Hydro</strong> share<br />
2011 2010 2009 2008 2007<br />
Share price high, Oslo (NOK) 1) 48.24 50.30 49.25 85.60 80.13<br />
Share price low, Oslo (NOK) 23.96 29.06 20.40 21.20 68.00<br />
Share price average, Oslo (NOK) 36.92 38.75 33.65 57.32 70.32<br />
Share price year-end, Oslo (NOK) 27.74 42.61 48.71 27.80 77.60<br />
Earnings per share (EPS) (NOK) 3.41 1.33 0.25 (3.25) 14.90<br />
EPS from continuing operations (NOK) 2) 3.41 1.33 0.25 (3.04) 7.20<br />
Dividend per share (NOK) 3) 0.75 0.75 0.50 0.00 5.00<br />
Pay-out ratio 4) 22% 56% 200% - 69%<br />
Dividend growth 0% 50% - -100% 0%<br />
Pay-out ratio five year average 5) 77% 57% 39% 38% 34%<br />
Adjusted debt/equity ratio 6) 0.24 0.11 0.32 0.30 0.01<br />
Credit rating, Standard & Poor's BBB BBB BBB- BBB BBB<br />
Credit rating, Moody's Baa2 Baa2 Baa2 Baa1 Baa1<br />
Non-Norwegian ownership, year-end 44% 23% 27% 33% 42%<br />
Outstanding shares, average 1 965 039 601<br />
Outstanding shares, year-end 2 036 459 019<br />
1 419 052 116<br />
1 587 776 741<br />
1 205 376 724<br />
1 204 785 945<br />
1 209 143 809<br />
1 206 325 863<br />
1 221 195 650<br />
1 209 304 379<br />
1) An adjustment factor of 0.324396 bas been used for share prices prior to the demerger of the oil and gas activities on October 1, 2007. The adjustments<br />
are according to Oslo Stock Exchange's calculation methods.<br />
2) Oil and gas activities only included as discontinued for 2007.<br />
3) 2011 dividend per share proposed by Board of Directors, dependant on approval from the <strong>Annual</strong> General Meeting May 8, 2012.<br />
4) Dividend per share divided by earnings per share from continuing operations.<br />
5) Dividend per share divided by earnings per share from continuing operations for last five years.<br />
6) See note 35 to the Consolidated Financial Statements.<br />
SHAREHOLDER INFORMATION<br />
Key figures for the <strong>Hydro</strong> share 119
120<br />
SHAREHOLDER INFORMATION<br />
Information from <strong>Hydro</strong><br />
Information from <strong>Hydro</strong><br />
<strong>Hydro</strong> gives a high priority to communicating with the stock market, and aims to maintain an open dialogue with market<br />
participants. Our objective is to provide sufficient information on a timely basis to all market participants to ensure a fair<br />
valuation of our shares. Information that is considered price sensitive is communicated by news releases and stock exchange<br />
announcements. We host regular meetings for investors in Europe and the US. The major brokers in Oslo and London publish<br />
equity research reports on <strong>Hydro</strong>. All information about <strong>Hydro</strong> is published on our website: www.hydro.com<br />
Our annual and quarterly reports are available on www.hydro.com, and our latest annual reports can also be ordered in printed<br />
versions from the website.<br />
Two weeks before the announcement of quarterly results, <strong>Hydro</strong> practices a "closed period" meaning that contact with external<br />
analysts, investors and journalists is minimized. This is done to minimize the risk of information leaks and potentially unequal<br />
information in the marketplace.<br />
<strong>Annual</strong> General Meeting<br />
The <strong>Annual</strong> General Meeting will be held at the company's headquarters at Drammensveien 260, Oslo, Norway, on Tuesday,<br />
May 8, 2012, at 17:00 CET. Shareholders who wish to attend are asked to inform the registrar by 12:00 CET on Monday,<br />
May 7:<br />
DnB NOR Bank ASA<br />
Verdipapirservice<br />
0021 Oslo, Norway<br />
Fax: + 47 22 48 11 71<br />
You may also register electronically on our website www.hydro.com/register or via VPS Investor Services. Any shareholder may<br />
appoint a proxy with written authority to attend the meeting and vote on his or her behalf. Voting rights are discussed under<br />
"Major shareholders and voting rights."<br />
Change of address<br />
Shareholders registered in the Norwegian Central Securities Depository should send information on changes of address to their<br />
registrar and not directly to <strong>Hydro</strong>.<br />
Financial calendar 2012<br />
April 27 First quarter results<br />
May 8 <strong>Annual</strong> General Meeting<br />
May 9 Shares traded ex-dividend<br />
May 11 Record date for dividend<br />
July 24 Second quarter results<br />
October 23 Third quarter results<br />
November 29 Capital Markets Day
Tittel<br />
<strong>Hydro</strong> present<br />
Based in Norway, <strong>Hydro</strong> employs 23,000 people in more than 40 countries.<br />
CorporAte GovernAnCe<br />
Index<br />
121<br />
06:<br />
Corporate governance<br />
– including compliance with the Norwegian<br />
code of practice for corporate governance<br />
Introduction p.122<br />
Corporate directives and<br />
code of conduct p.123<br />
Business planning and<br />
risk management p.123<br />
Controls and procedures p.124<br />
Transparency and communication p.125<br />
Management compensation p.125<br />
Board of directors p.126<br />
Corporate management board p.128<br />
Governance bodies p.130<br />
further on the Norwegian<br />
code of practice for<br />
corporate governance p.132<br />
QuICK overvIew<br />
<strong>Hydro</strong> is a public limited company organized under Norwegian law<br />
with a governance structure based on Norwegian corporate law. Our<br />
corporate governance has been designed to provide a foundation<br />
for value creation and to ensure good control mechanisms. We<br />
maintain common requirements in the form of corporate directives<br />
that are mandatory for all parts of our organization.<br />
The corporate directives help ensure that all our employees carry<br />
out their activities in an ethical manner and in accordance with<br />
current legislation and <strong>Hydro</strong> standards. The board of directors has<br />
approved our code of conduct, which applies to all employees<br />
throughout the world, as well as to board members of <strong>Hydro</strong> and<br />
its subsidiaries. The code addresses compliance with laws and<br />
other matters such as handling of conflicts of interest and a<br />
commitment to equal opportunities for all employees. Our integrity<br />
program contributes to compliance with anti-corruption legislation<br />
and basic human rights.<br />
<strong>Hydro</strong> follows the Norwegian code of practice for corporate<br />
governance of October 2010.
122<br />
CORPORATE GOVERNANCE<br />
Introduction<br />
Introduction<br />
<strong>Hydro</strong> is a public limited company organized under Norwegian law with a governance structure based on Norwegian corporate<br />
law. Our main share listing is on Oslo Børs, which subjects us to Norwegian securities legislation and stock exchange<br />
regulations. <strong>Hydro</strong> has a secondary listing on London Stock Exchange.<br />
We have developed our governance structure through cooperation between our corporate management board and our superior<br />
governance bodies to secure compliance with relevant laws and regulations and to reflect business needs. Further development<br />
is a continuous process.<br />
We follow the Norwegian Code of Practice for Corporate Governance of October 2010. A detailed description of our<br />
compliance is presented on page 132. Information regarding our shareholder policy can be found on page 115.<br />
<strong>Hydro</strong> has been listed on the Dow Jones Sustainability Indexes (DJSI) every year since the start of the indexes in 1999. We are<br />
also listed on the corresponding UK index, FTSE4Good.<br />
<strong>Hydro</strong>'s strategic direction is described on page 11. More comprehensive information about our governance practices, policies<br />
and requirements can be found at www.hydro.com/governance<br />
General Meeting<br />
of Shareholders<br />
Nomination<br />
Committee<br />
Corporate<br />
Assembly<br />
Compensation<br />
Committee<br />
Board of<br />
Directors<br />
Audit<br />
Committee<br />
Internal Audit<br />
President<br />
and CEO<br />
Corporate<br />
Management Board
Corporate directives and code of conduct<br />
CORPORATE GOVERNANCE<br />
Corporate directives and code of conduct 123<br />
The <strong>Hydro</strong> Way represents our framework for leadership, organization and culture and is the foundation of our governance<br />
system. See page 50 for further information. Our system is based on the delegation of responsibility to our business areas and to<br />
corporate functions whose duties include finance, tax and accounting. In order to maintain uniformly high standards, we set<br />
common requirements in the form of corporate directives that are mandatory for all parts of our organization. The directives<br />
address a number of areas, including health, security, safety and environment (HSE), ethics and social responsibility, strategy<br />
and business planning, finance, risk management, and organizational and employee development. This information is made<br />
available to all employees.<br />
<strong>Hydro</strong>'s code of conduct, which is approved by the board of directors, applies to all employees throughout the world, as well as<br />
to board members of <strong>Hydro</strong> and its subsidiaries. See page 57 for more information about <strong>Hydro</strong>'s code of conduct, whistle<br />
blowing procedure and integrity program, and www.hydro.com/principles for more information regarding our corporate<br />
directives.<br />
In <strong>Hydro</strong>, compliance is defined as adherence to applicable laws and regulations worldwide as well as <strong>Hydro</strong>'s steering<br />
documents. Guidelines have been established to assist line management to adhere to <strong>Hydro</strong>'s compliance requirements. Special<br />
emphasis is made on reducing the risk of non-compliance within finance, anti-corruption, competition, AnnuAl and report health, security, page<br />
Corporate governance<br />
99<br />
safety and environment.<br />
Business planning and risk management<br />
Mission<br />
Portfolio<br />
Strategy<br />
<strong>Hydro</strong>'s overall goal is to create shareholder value through satisfied customers and motivated and competent employees. We<br />
and have environment defined two within main processes <strong>Hydro</strong>. We to ensure carry out that risk short assessments and long-term audit targets and non-audit are achieved. services to <strong>Hydro</strong> or any entity within the<br />
for defined exposure areas. Exposure to certain risks, particu- group. Under this pre-approval policy, the audit committee<br />
larly The portfolio, those threatening strategy and life business and health, planning has been process consistently involves strategic has defined and operative and pre-approved planning and subcategories results monitoring. of audit and The non-<br />
reduced planning, to which very low reflects levels. our See ambitions also page and 90 for values, a more is the detailed basis for audit the strategies services. and The measures audit that committee’s form the pre-approval business plans policy at all<br />
discussion levels of our of organization. <strong>Hydro</strong>’s financial We risk have management. defined key performance indicators includes for annual each unit, monetary including frames financial, for each human of the following resource, cat-<br />
ethical and HSE objectives, in addition to unit-specific operating egories targets.<br />
of services:<br />
• audit-related<br />
• tax<br />
• non-audit related<br />
Controls and procedures<br />
Our disclosure committee, comprised of senior managers, is<br />
responsible for reviewing financial and related information<br />
included in our reports.<br />
<strong>Hydro</strong>’s Internal Control over Financial <strong>Report</strong>ing (ICFR)<br />
framework is primarily designed to provide reasonable assurance<br />
to our management and the Board of Directors regarding<br />
the preparation and fair presentation of our Financial Statements.<br />
<strong>Hydro</strong> established its comprehensive ICFR framework<br />
in 2006 and continues to maintain it based on the principles<br />
established by “The Committee of Sponsoring Organizations<br />
of the Treadway Commission (COSO) internal control – integrated<br />
framework”. The five interrelated COSO principles are:<br />
1) Control Environment, 2) Risk Assessment, 3) Control<br />
Activities, 4) Information and Communication, and 5)<br />
Monitoring.<br />
<strong>Hydro</strong>’s overall control environment relevant for financial<br />
reporting is covered by “<strong>Hydro</strong>-Wide Controls (HWC)”.<br />
HWC reflects the tone set by the top management, management’s<br />
and employees’ common attitudes, ethics, and values,<br />
Business<br />
Strategy<br />
Business<br />
Planning<br />
Performance<br />
Management<br />
Within the scope of the pre-approval policy, all services have<br />
been pre-approved and all amounts for audit-related, tax and<br />
other non-audit related services are within the monetary<br />
frames established by the audit committee.<br />
Employment of external auditor personnel<br />
Principles have been established to ensure that the independence<br />
of <strong>Hydro</strong>’s external auditor is not impaired by means of the<br />
recruitment of former or current external auditor personnel and<br />
their close family members. Our policy requires a “cooling-off<br />
period” before recruiting former employees from the current<br />
external auditor to defined positions within <strong>Hydro</strong>.<br />
Transparency and communication<br />
<strong>Hydro</strong>’s corporate culture embodies the principles of honesty<br />
and respect for others. Our ability to operate efficiently in the
124<br />
CORPORATE GOVERNANCE<br />
Business planning and risk management<br />
The people process is designed to assess and develop our human resources, and is an integral part of our annual business<br />
planning. Its aim is to promote the potential of individual employees and of our organization as a whole.<br />
Risk management is also an integrated part of our planning and reporting process. Risk management deals with all aspects of<br />
value creation, including strategy, finance, commercial matters, organization, HSE, reputation, corporate responsibility,<br />
regulatory and legal matters. <strong>Hydro</strong>'s board of directors regularly reviews and evaluates the overall risk management systems<br />
and environment within <strong>Hydro</strong>. We carry out risk assessments for defined exposure areas. Exposure to certain risks, particularly<br />
those threatening life and health, has been consistently reduced to very low levels. See also page 131 for a more detailed<br />
discussion of <strong>Hydro</strong>'s financial risk management.<br />
Controls and procedures<br />
<strong>Hydro</strong>'s Internal Control over Financial <strong>Report</strong>ing (ICFR) framework is primarily designed to provide reasonable assurance to<br />
our management and the board of directors regarding the preparation and fair presentation of our Financial Statements.<br />
We established our comprehensive ICFR framework in 2006 and continue to maintain it based on the principles established by<br />
"The Committee of Sponsoring Organizations of the Treadway Commission (COSO) internal control - integrated<br />
framework." The five interrelated COSO principles are: Control Environment, Risk Assessment, Control Activities,<br />
Information and Communication, and Monitoring.<br />
Our overall control environment relevant for financial reporting is covered by <strong>Hydro</strong>-Wide Controls (HWC). HWC reflects<br />
the tone set by the common attitudes, ethics, and values, and competence of top management and management, and all the<br />
rest of our employees.<br />
Our ICFR model is implemented through a top-down and risk-based approach. Therefore, we emphasize four higher-risk<br />
areas: <strong>Hydro</strong>'s financial reporting risk, fraud risk, general computer risk, and financial closing risk.<br />
In addition, a standard and minimum level of controls is required for all reporting units, documented in an internal control<br />
handbook.<br />
<strong>Hydro</strong>'s disclosure committee assists the CEO and the CFO in ensuring fairness, accuracy, completeness and timeliness of<br />
<strong>Hydro</strong>'s public reports and disclosures. The disclosure committee is an integral component of <strong>Hydro</strong>'s disclosure controls and<br />
procedures and assesses <strong>Hydro</strong>'s compliance initiatives pertaining to ICFR. The disclosure committee reports quarterly a<br />
summary of its activities to the audit committee.<br />
Through reporting from the disclosure committee and internal audit, the audit committee takes an active role in ensuring the<br />
effective and harmonized functioning of the ICFR framework. See page 131 and www.hydro.com/governance for additional<br />
details.
Pre-approval of audit services<br />
The audit committee has a pre-approval policy governing the engagement of primary and other external auditors to provide<br />
audit and non-audit services to <strong>Hydro</strong> or any entity within the group. Under this pre-approval policy, the audit committee has<br />
defined and pre-approved subcategories of audit and non-audit services. The audit committee's pre-approval policy includes<br />
annual monetary frames for each of the following categories of services:<br />
· Audit-related<br />
· Tax<br />
· Non-audit related<br />
CORPORATE GOVERNANCE<br />
Pre-approval of audit services 125<br />
Within the scope of the pre-approval policy, all services have been pre-approved and all amounts for audit-related, tax and<br />
other non-audit related services are within the monetary frames established by the audit committee.<br />
Transparency and communication<br />
<strong>Hydro</strong>'s corporate culture embodies the principles of honesty and respect for others. Our ability to operate efficiently in the<br />
Norwegian market and internationally requires consistent and professional communication. We adhere, therefore, to the<br />
principles of transparency, honesty and sensitivity when interacting with our stakeholders.<br />
Management compensation<br />
Information concerning remuneration and remuneration policies, share ownership, loans outstanding and loan policy relating<br />
to <strong>Hydro</strong>'s board of directors and corporate management board is disclosed in Note 10, 11 and 44 of the consolidated financial<br />
statements.
126<br />
CORPORATE GOVERNANCE<br />
Board of directors<br />
Board of directors<br />
Name Place of residence<br />
Year<br />
of birth Position Board committee<br />
Terje Vareberg Stavanger, Norway 1948 Chairperson Chairperson<br />
Compensation<br />
Committee<br />
Meetings<br />
attended 1)<br />
Director<br />
since<br />
Term<br />
expires<br />
9 2007 2012<br />
Bente Rathe Trondheim, Norway 1954 Deputy chairperson Audit Committe 10 2007 2012<br />
Billy Fredagsvik Høyanger, Norway 1956 Director Audit Committe 10 2007 2013<br />
Inge K. Hansen Oslo, Norway 1946 Director Chairperson Audit<br />
Committe<br />
Finn Jebsen Oslo, Norway 1950 Director Compensation<br />
Committee<br />
10 2008 2012<br />
10 2007 2012<br />
Jørn B. Lilleby 1) 4) Sunndalsøra, Norway 1952 Director Audit Committe 4 2007<br />
Tito Botelho Martins Jr 1) 2) Toronto, Canada 1962 Director 6 2011 2012<br />
Ove Ellefsen 1) 5) Håvik, Norway 1956 Director 6 2011 2013<br />
Sten Roar Martinsen Kopervik, Norway 1962 Director Compensation<br />
Committee<br />
9 2005 2013<br />
Eva Persson Västra Frölunda,<br />
Sweden<br />
1953 Director Audit Committe 10 2010 2012<br />
Liv Monica Stubholt Lørenskog, Norway 1961 Director Compensation<br />
Committee<br />
7 2010 2012<br />
1) Total number of board meetings were 10. Eight of these were during Martins' term of service, four during Lilleby's and six during Ellefsen's.<br />
2) Member of the board as of 28 February, 2011.<br />
3) Member of the Board Audit Committee effective from 1 October, 2011<br />
4) Jørn Lilleby stepped down from the board on 13 May, 2011.<br />
5) Member of the board as of 13 May, 2011.<br />
Terje Vareberg, chairperson<br />
Position: Independent businessman<br />
Education: Master of Science in business, Norwegian School of Economics and Business Administration (NHH)<br />
Current directorships: Chairperson of Bergli Rådgivning AS, TS Eiendom AS, T Stangeland Maskin AS, NorDan AS,<br />
Malthus AS, Ipark AS, Aarsland Møbelfabrikk AS, Fabrikkveien II AS, Aarsland Holding II AS, Solstad Trading AS and<br />
for the Election committee of Innovation Norway. Board member of Solstad Offshore ASA, Energy Ventures IV AS,<br />
Lærdal Finans AS and Farsund Vekst AS. Member of the supervisory board of SpareBank 1 SR Bank ASA.<br />
No. of <strong>Hydro</strong> shares: 18,391<br />
Bente Rathe, deputy chairperson<br />
Position: Independent businesswoman<br />
Education: Master of Science in business, Trondheim Økonomiske Høgskole (HIST). MBA from the University of<br />
Denver<br />
Current directorships: Chairperson of Ecohz AS and Cenium AS. Board member of Powel AS, Nordic Choice<br />
Hospitality Group AS, Home Invest AS, Polaris Media ASA, Svenska Handelsbanken AB, and Innovation Norway.<br />
Member of Ethics of Council for the Government Pension Fund, Global.<br />
No. of <strong>Hydro</strong> shares: 29,000<br />
Ove Ellefsen, employee representative<br />
Position: Project Supervisor / full-time union official representing the Central Cooperative Council (Sentralt<br />
Samarbeidsråd)<br />
Education: Certificate of apprenticeship in electrochemistry. Work supervisor training<br />
Current directorships: None<br />
No. of <strong>Hydro</strong> shares: 2,544
Billy Fredagsvik, employee representative<br />
Position: Process operator / full-time union official. Represents the Norwegian Confederation of Trade Unions<br />
Education: Trade school (mechanics)<br />
Current directorships: None<br />
No. of <strong>Hydro</strong> shares: 2,159<br />
Inge K. Hansen<br />
Position: Independent adviser<br />
Education: Master of Science in business, Norwegian School of Economics and Business Administration (NHH)<br />
Current directorships: Chairperson of Bertel O. Steen AS, Norsun AS, Gjensidige Forsikring ASA, Hotell og<br />
Restauranthuset Continental, Leonhard Nilsen & Sønner AS, Core Energy AS and AIM Norway SF. Board member of<br />
Jiffy International AS, Master Marine AS, JGO AS and Sissener AS<br />
No. of <strong>Hydro</strong> shares: 12,000<br />
Finn Jebsen<br />
Position: Independent businessman<br />
Education: Master of Science in business from the Norwegian School of Economics and Business Administration<br />
(NHH). MBA from the University of California, Los Angeles<br />
Current directorships: Chairperson of Kongsberg Gruppen ASA and Kavli Holding AS; deputy chair of KLP Forsikring;<br />
board member of A. Wilhelmsen Management AS, Berner Group AS, Future Subsea AS, Norfund and his wholly-owned<br />
company Fateburet AS.<br />
No. of <strong>Hydro</strong> shares: 53,406<br />
Tito Botelho Martins Jr.<br />
Position: Chief Financial Officer and Investor Relations Executive Director, Vale S.A.<br />
Education: Bachelor's degree in Economics from the Federal University of Minas Gerais. MBA from IEAD at the Federal<br />
University of Rio de Janeiro.<br />
Current directorships: President of the Board of Directors of Mineração Rio do Norte S.A. (MRN)<br />
No. of <strong>Hydro</strong> shares: 0. Vale holds 447,834,465 shares.<br />
Sten Roar Martinsen, employee representative<br />
Position: Process operator / full-time union official representing the Norwegian Confederation of Trade Unions (LO)<br />
Education: Certificate of apprenticeship in electrochemistry. Work supervisor training<br />
Current directorships: None<br />
No. of <strong>Hydro</strong> shares: 3,215<br />
Eva Persson<br />
Position: Executive Vice President and General counsel for the Volvo Group<br />
Education: Master of Law from the University of Lund, Sweden<br />
Current directorships: Board member of Handelsbanken region Western Sweden<br />
No. of <strong>Hydro</strong> shares: 0<br />
Liv Monica Stubholt<br />
Position: CEO and member of the board of Aker Clean Carbon AS<br />
Education: Master's degree in law (cand. jur.), University of Oslo<br />
Current directorships: Board member of Aker Clean Carbon AS and the Norwegian-German Chamber of Commerce.<br />
Deputy chair of the Norwegian Review Committee for the European Economic Area .<br />
No. of <strong>Hydro</strong> shares: 0<br />
Number of <strong>Hydro</strong> shares is as per 31 December, 2011.<br />
For more extensive biographical information, please see www.hydro.com/governance<br />
CORPORATE GOVERNANCE<br />
Board of directors 127
128<br />
CORPORATE GOVERNANCE<br />
Corporate management board<br />
Corporate management board<br />
Name Place of Residence<br />
Year of<br />
birth<br />
Current<br />
position<br />
since Position<br />
Svein Richard Brandtzæg Oslo, Norway 1957 1985 2009 President and Chief Executive Officer<br />
Wenche Marie Agerup Oslo, Norway 1964 1997 2010 EVP Corporate Staffs and General Counsel<br />
Oliver Bell Grevenbroich, Germany 1958 1985 2009 EVP Rolled Products<br />
Kjetil Ebbesberg Oppegård, Norway 1971 2009 1)<br />
2009 EVP Metal Markets<br />
Hans-Joachim Kock Lausanne, Switzerland 1954 1981 2010 EVP Extruded Products<br />
Arvid Moss Oslo, Norway 1958 1991 2010 EVP Energy and Corporate Business Development<br />
Jørgen C. Arentz Rostrup Oslo, Norway 1966 1991 2009 EVP and Chief Financial Officer<br />
Tom Røtjer Oslo, Norway 1953 1980 2007 EVP Projects<br />
Johnny Undeli Gjøvik, Norway 1953 1978 2010 EVP Bauxite and Alumina<br />
Hilde Merete Aasheim Oslo, Norway 1958 2008 2)<br />
2008 EVP Primary Metal<br />
EVP: Executive vice president<br />
1) Ebbesberg also was employed in <strong>Hydro</strong> 1996-2007.<br />
2) Aasheim also was employed in <strong>Hydro</strong> 2005-2007.<br />
Employed<br />
in <strong>Hydro</strong><br />
since<br />
Svein Richard Brandtzæg, President and CEO<br />
Key experience: Executive vice president and head of Aluminium Products. Head of Rolled Products. Head of Metal<br />
Products. Head of Magnesium.<br />
Education: PhD, Norwegian Institute of Technology. Degree from the Norwegian School of Management.<br />
External directorships: Chairperson of the board of International Aluminium Institute. Vice chairperson of the board of<br />
European Aluminium Association. Board member of International Council on Mining and Metal, and European Round<br />
Table.<br />
No. of <strong>Hydro</strong> shares: 62,847<br />
Wenche Marie Agerup<br />
Key experience: Head of <strong>Hydro</strong>'s bauxite exploration activities in Australia. Plant manager in Årdal, Norway. Head of<br />
Bauxite and Alumina. Head of Mergers & Acquistions.<br />
Education: Master's degree in law (cand. jur.), University of Oslo. MBA from Babson College in Boston, U.S.<br />
External directorships: Board member of the Arbitration Institute of Oslo Chamber of Commerce.<br />
No. of <strong>Hydro</strong> shares: 20,637<br />
Oliver Bell<br />
Key experience: Head of Rolled Products. Head of Automotive, Construction, Packaging and General Engineering in<br />
Rolled Products. Various management positions in VAW.<br />
Education: Degree in business administration from the University of Cologne.<br />
External directorships: Chairperson of Eurometaux<br />
No. of <strong>Hydro</strong> shares: 14,415<br />
Kjetil Ebbesberg<br />
Key experience: Chief financial officer in Norwegian retail group Coop. CFO in Metal Products. Head of Foundry<br />
Alloys. International experience from Extrusion and Building Systems.<br />
Education: Master of Science in business, Norwegian School of Economics and Business Administration (NHH).<br />
External directorships: None<br />
No. of <strong>Hydro</strong> shares: 8,033
Hans-Joachim Kock<br />
Key experience: Head of finance in <strong>Hydro</strong>'s Aluminium Products. Head of Rolled Products. Plant manager Slim, Italy.<br />
Education: Degree in business administration and engineering from the University of Karlsruhe, Germany<br />
External directorships: None<br />
No. of <strong>Hydro</strong> shares: 13,325<br />
Arvid Moss<br />
Key experience: Executive vice president and head of Corporate Strategy and Business Development. Project leader for<br />
the oil and gas merger agreement with Statoil. Head of Metal Products. Head of Automotive Structures.<br />
Education: Master of Science in business, Norwegian School of Economics and Business Administration (NHH).<br />
External directorships: Chairperson of the board of Posten Norge. Board member of The Confederation of Norwegian<br />
Enterprise (NHO).<br />
No. of <strong>Hydro</strong> shares: 75,957<br />
Jørgen C. Arentz Rostrup<br />
Key experience: Executive vice president and head of Energy. Head of Markets in Oil & Energy. Head of Trading &<br />
Marketing in Markets. Head of Finance, Exploration & Production Norway. President of Norsk <strong>Hydro</strong> USA Inc.<br />
Education: Master of Science in business, Norwegian School of Economics and Business Administration (NHH).<br />
External directorships: Chairperson of the Election Committee of Norsk Industri. Board member of Argentum, and<br />
Citus AS.<br />
No. of <strong>Hydro</strong> shares: 22,902<br />
Tom Røtjer<br />
Key experience: Project director for the Ormen Lange and Langeled development project. Head of Technology and<br />
Projects.<br />
Education: Master of Science in mechanical engineering, Norwegian Institute of Technology.<br />
External directorships: Board member of F35 programme committee of the Norwegian Defense Department.<br />
No. of <strong>Hydro</strong> shares: 29,846<br />
Johnny Undeli<br />
Key experience: Executive vice president and head of Extrusion. Various leadership positions within <strong>Hydro</strong>'s extrusion<br />
business in Europe. Various positions in <strong>Hydro</strong>'s former oil and gas business. Six years in Total, UK.<br />
Education: Master of Science in petroleum technology, Norwegian Institute of Technology.<br />
External directorships: None<br />
No. of <strong>Hydro</strong> shares: 13,132<br />
Hilde Merete Aasheim<br />
Key experience: Head of Staff Functions and Corporate Services in Statoil<strong>Hydro</strong>. Head of the integration between Statoil<br />
and <strong>Hydro</strong>'s oil and gas activities. Head of Leadership and Culture in <strong>Hydro</strong>. 20 years of service in Elkem, three last years<br />
as head of the Silicon Division.<br />
Education: Master of Science in business, Norwegian School of Economics and Business Administration (NHH).<br />
Certified public accountant from NHH.<br />
External directorships: Board member of Yara ASA and Norsk Industri.<br />
No. of <strong>Hydro</strong> shares: 11,112<br />
Number of <strong>Hydro</strong> shares is as per 31 December, 2011.<br />
For more extensive biographical information, please see www.hydro.com/governance<br />
CORPORATE GOVERNANCE<br />
Corporate management board 129
130<br />
CORPORATE GOVERNANCE<br />
Governance bodies<br />
Governance bodies<br />
Description Developments and events in 2011 References<br />
General meeting of shareholders<br />
Company shareholders exercise ultimate authority through the general<br />
meeting. Shareholders registered in VPS, the Norwegian Central<br />
Securities Depository, can vote in person or by proxy. Invitations are<br />
sent to shareholders or to the shareholder's security deposit bank.<br />
The general meeting of shareholders:<br />
· Elects the shareholders' representatives to the corporate assembly<br />
· Elects the external auditor and determines the auditor's remuneration<br />
· Approves the report according to Norwegian requirements and<br />
financial statements, including the dividend proposed by the board of<br />
directors and recommended by the corporate assembly<br />
· Elects the nomination committee and determines their remuneration<br />
· Deals with any other matters listed in the notice convening the<br />
meeting<br />
· Determines the remuneration of the corporate assembly<br />
Shareholders may, at least four weeks before an ordinary general<br />
meeting, request in writing that proposals for resolutions are submitted<br />
to the general meeting, or that items are added to the agenda.<br />
Corporate assembly<br />
Eighteen members. Twelve are elected by the general meeting of<br />
shareholders, six are elected by and among the group's employees in<br />
Norway.<br />
In accordance with Norwegian law, the corporate assembly:<br />
· Elects the board of directors and determines their remuneration<br />
· Nominates the external auditor to be elected by the general meeting<br />
of shareholders<br />
· Based on recommendations from the board of directors, makes<br />
decisions in matters relating to investments that are substantial in<br />
relation to <strong>Hydro</strong>'s resources, and when closures and reorganizations<br />
will lead to significant changes for the workforce<br />
· Provides recommendations to the general meeting of shareholders<br />
with respect to approval of the board of directors' proposal regarding<br />
the financial statements and dividend<br />
Nomination commitee<br />
Four members appointed by the general meeting of shareholders. The<br />
chairperson of the committee and at least one of the other members<br />
shall be elected among the shareholder-elected corporate assembly<br />
members.<br />
Nominates candidates to the board of directors, the corporate<br />
assembly and the nomination committee, and proposes remuneration<br />
to the board, its sub-committees, the corporate assembly and the<br />
nomination committee.<br />
Board of directors<br />
Following the Vale transaction in February 2011 the board increased<br />
from nine to 10 members. Seven are elected by the corporate<br />
assembly, three elected by and among the company's employees in<br />
Norway, normally for a period of two years.<br />
In accordance with Norwegian law, the board of directors assumes the<br />
overall governance of the company, ensures that appropriate<br />
management and control systems are in place and supervises the dayto-day<br />
management as carried out by the President and CEO.<br />
General meeting in May The protocols can<br />
be found at<br />
www.hydro.com/gov<br />
ernance<br />
4 meetings. 96 percent meeting attendance.<br />
Members:<br />
Siri Teigum (chairperson), Leif Teksum (deputy<br />
chairperson), Anne Kverneland Bogsnes, Anne-<br />
Margrethe Firing, Westye Høegh, Idar Kreutzer, Jon<br />
Lund, Bjørn Nedreaas, Tor Egil Skulstad, Unni<br />
Steinsmo, Svein K. Sund, Sten Arthur Sælør, Eivind<br />
Torvik, Lars Tronsgaard, Terje Venold, Tove<br />
Wangensten, Bente Linnerud Østlyngen, Bjørn<br />
Øvstetun<br />
Deputy members:<br />
Rolf Arnesen, Odd Asbjørnsen, Arne Eide, Jan Einan,<br />
Trygve Eriksen, Odd Arne Fodnes, Kristin Færøvik,<br />
Roar Jakobsen, Jørn Lilleby, Line Melkild, Birger<br />
Solberg, Anne Kristin Sydnes, Gro Thorstensen,<br />
Gunvor Ulstein, Einar Øren<br />
12 meetings. Meeting attendance 92 percent<br />
Members:<br />
Siri Teigum (chairperson), Westye Høegh, Leif<br />
Teksum, Mette Wikborg<br />
10 meetings. 92 percent meeting attendance.<br />
Tito Botelho Martins Jr. joined the board of directors<br />
28 February, 2011 as a 10th board member. Ove<br />
Ellefsen was elected new board member 13 May,<br />
replacing Jørn B. Lilleby who stepped down from the<br />
board at the same date.<br />
The board has an annual plan for its work. It includes<br />
recurring topics such as a review of board<br />
procedures, competency, priorities, collaboration with<br />
the company's management, strategy review,<br />
business planning as well as HSE and CSR, including<br />
risk and compliance oversight.<br />
Note 44 to the<br />
Consolidated<br />
financial statements<br />
for remuneration<br />
and share<br />
ownership<br />
Articles of<br />
Association<br />
§§ 7-8 at<br />
www.hydro.com/gov<br />
ernance<br />
Articles of<br />
association § 5A<br />
and biographical<br />
information can be<br />
found at<br />
www.hydro.com/gov<br />
ernance<br />
The board's<br />
mandate can be<br />
found at<br />
www.hydro.com/gov<br />
ernance<br />
Biographical<br />
information on the<br />
board members on<br />
page 126
Description Developments and events in 2011 References<br />
Board of directors (continued)<br />
All shareholder-elected members are external. No members elected by<br />
employees are part of the company's executive management.<br />
Employee directors have no other service contractual agreements with<br />
the company outside of their employee contracts, though they are<br />
subject to their duties as board members.<br />
The board of directors has an annual plan for its work. It includes<br />
recurring topics such as strategy review, business planning, risk and<br />
compliance oversight, financial reporting, people strategy, succession<br />
planning as well as HSE and CSR.<br />
Compensation committee<br />
Consists of four of the board of directors' nine members.<br />
The committee reviews the performance of, and puts forward<br />
proposals regarding the compensation of the President & CEO to the<br />
board of directors. The committee assists in evaluating the<br />
compensation of the corporate management board and in determining<br />
performance-promoting schemes for management.<br />
Audit committee<br />
Consists of four of the board of directors' 10 members. The audit<br />
committee meets Norwegian requirements regarding independence<br />
and competence.<br />
The audit committee assists the board of directors relating to the<br />
integrity of the company's financial statements and financial reporting<br />
processes and internal controls; the company's risk assessment and<br />
risk management policies related to financial reporting; the<br />
qualifications, independence and performance of the external auditor;<br />
and the performance of the internal audit function.<br />
To ensure the independence of the internal audit function, the head of<br />
Internal Audit reports functionally to the board through the audit<br />
committee.<br />
The audit committee maintains a pre-approval policy governing the<br />
engagement of the company's primary and other external auditors to<br />
ensure auditor independence.<br />
President & CEO and corporate management board<br />
According to Norwegian corporate law, the President & CEO<br />
constitutes a formal governing body that is responsible for the daily<br />
management of the company. The division of functions and<br />
responsibilities between the President & CEO and the board of<br />
directors is defined in greater detail in the rules of procedures<br />
established by the board.<br />
The Corporate Management Board (CMB), including the President &<br />
CEO, has a shared responsibility for promoting <strong>Hydro</strong>'s objectives and<br />
securing the company's property, organization and reputation.<br />
Members of the CMB are also Executive Vice Presidents (EVPs) with<br />
responsibility for the respective business areas, Projects, Finance, and<br />
Corporate Staffs and Legal.<br />
The board of directors used significant time on the<br />
completion of the Vale transaction and integration<br />
follow up. This included a visit to Brazil and <strong>Hydro</strong>'s<br />
mining operations in Paragominas, the Alunorte<br />
refinery, the Albras smelter and <strong>Hydro</strong>'s regional<br />
headquarter in Rio de Janeiro. The visit included<br />
follow-up of the integration and operations of the<br />
businesses acquired from Vale, and different social<br />
programs established in connection with these<br />
operations. The board was also involved in evaluating<br />
market developments including continuous evaluation<br />
of curtailed capacity.<br />
In 2011, the board also made a self-assessment and<br />
a separate assessment of the board's chairperson.<br />
Both were presented to the nomination committee.<br />
The evaluation processes were facilitated by an<br />
external service provider.<br />
All shareholder-elected members except Martins<br />
were in 2011 deemed to be independent according<br />
to the Norwegian standards. None of the company's<br />
non-employee board members had any other<br />
service contractual agreements with the company.<br />
Martins, who is a board member as per 28 February,<br />
2011 is not independent of <strong>Hydro</strong>'s second largest<br />
shareowner, Vale.<br />
Seven meetings. Meeting attendance 86 percent.<br />
Members:<br />
Terje Vareberg (chairperson)<br />
Finn Jebsen<br />
Sten Roar Martinsen*<br />
Liv Monica Stubholt<br />
* Martinsen joined the committe as of 1 January, 2011. Martinsen is<br />
employed in <strong>Hydro</strong> and represents the employees through the<br />
Norwegian Confederation of Trade Unions. We believe that such<br />
reliance does not adversely affect, in any material way, the ability of the<br />
compensation committee to act independently or to satisfy the other<br />
requirements.<br />
Nine meetings. Meeting attendance 97 percent<br />
Members:<br />
Inge K Hansen (chairperson)<br />
Billy Fredagsvik*<br />
Eva Persson<br />
Bente Rathe<br />
* Fredagsvik joined the Audit committee 1 October, following Jørn B.<br />
Lilleby. Fredagsvik is employed in <strong>Hydro</strong> and represents the employees<br />
through the Central Cooperative Council. We believe that such reliance<br />
does not adversely affect, in any material way, the ability of the audit<br />
committee to act independently or to satisfy the other requirements.<br />
Met every second week.<br />
No member of <strong>Hydro</strong>'s board of directors or the CMB<br />
has any family relationship with any other director or<br />
member of the CMB.<br />
CORPORATE GOVERNANCE<br />
Governance bodies 131<br />
Note 44 to the<br />
Consolidated<br />
financial statements<br />
for remuneration,<br />
share ownership<br />
and loans.<br />
The mandate can<br />
be found on<br />
www.hydro.com/gov<br />
ernance<br />
The mandate can<br />
be found on<br />
www.hydro.com/gov<br />
ernance<br />
Pre-approval of<br />
audit services on<br />
page 125<br />
Biographical<br />
information on page<br />
128<br />
Note 10 and 11 to<br />
the Consolidated<br />
financial statements<br />
for remuneration,<br />
share ownership<br />
and loans
132<br />
CORPORATE GOVERNANCE<br />
Further on the Norwegian code of practice for corporate governance<br />
Further on the Norwegian code of practice for corporate governance<br />
The table below shows specific information related to the Norwegian code of practice on corporate governance and should be<br />
seen in context with the general corporate governance report given in the previous pages.<br />
Page numbers and notes to the consolidated financial statements refer to this report. All other references can be found at<br />
www.hydro.com/governance where a table with full references is available.<br />
Topic Comments References<br />
1 Statement of Corporate<br />
Governance<br />
<strong>Hydro</strong> follows the Norwegian Code of Practice for Corporate Governance<br />
of 2010 including all its recommendations. The <strong>Hydro</strong> Way represents<br />
our framework for leadership, organization and culture and is the<br />
foundation for our governance system, including our code of conduct.<br />
<strong>Hydro</strong>'s code of conduct has been approved by the board of directors,<br />
which also oversees that <strong>Hydro</strong> has appropriate corporate directives for<br />
HSE and corporate responsibility.<br />
2 <strong>Hydro</strong>'s business <strong>Hydro</strong> is a global supplier of aluminium with businesses throughout the<br />
entire value chain, from extraction of bauxite to production of rolled and<br />
extruded aluminium products and building systems. The company has<br />
23,000 employees in over 40 countries, around 4,000 of whom are based<br />
in Norway. With more than 100 years of experience in producing<br />
renewable energy, technology development and innovative cooperation,<br />
<strong>Hydro</strong> aims to strengthen the viability of the customers we serve and the<br />
communities in which we operate.<br />
The company's stated business objectives are to engage in industry,<br />
commerce and transport, to utilize energy resources and raw materials,<br />
and to engage in other activities connected with these objectives. Its<br />
business activities may also be conducted through participation in or in<br />
cooperation with other enterprises.<br />
3 Equity and dividends <strong>Hydro</strong>'s equity capital is appropriate to the company's objectives, strategy<br />
and risk profile.<br />
<strong>Hydro</strong>'s dividend policy is to pay out an average of 30 percent of net<br />
earnings over time.<br />
The board of directors may obtain authorization from the general meeting<br />
of shareholders to buy back <strong>Hydro</strong> shares in the market.<br />
When the general meeting considers whether or not to authorize the<br />
board of directors to carry out share capital increases for multiple<br />
purposes, each purpose must be considered separately by the meeting.<br />
Such authorization will be limited in time, and will last no longer than until<br />
the date of the next general meeting of shareholders. Authorization<br />
granted to the board is restricted to specific purposes. One example of<br />
this is the Vale transaction, where the board of directors was authorized<br />
to issue consideration shares to Vale.<br />
See also item 4.<br />
Learn more about The <strong>Hydro</strong> Way at<br />
www.hydro.com/principles<br />
<strong>Hydro</strong>'s Articles of Association are<br />
available at<br />
www.hydro.com/governance<br />
Page 115<br />
4 Equal treatment of<br />
<strong>Hydro</strong> has one share class. Page 115<br />
shareholders<br />
Transactions involving own shares are normally executed on the stock<br />
exchange. Buybacks of own shares are executed at the current market<br />
rate.<br />
Shareholders who are registered in the Norwegian Central Securities<br />
Depository (VPS) may vote in person or by proxy. Invitations are sent to<br />
the shareholders or to the bank/broker where the shareholder's securities<br />
account is held.<br />
Sales of shares to employees are conducted at a discount to market<br />
value. See also item 6.<br />
Contact between the board and the investors is normally conducted via<br />
the management. Under special circumstances the board, represented<br />
by the chair, may conduct dialog directly with investors.<br />
Note 11
Topic Comments References<br />
Transactions with related<br />
parties<br />
On February 28, 2011 the agreement to take over the majority of Vale's<br />
aluminium business in Brazil was concluded. Vale received a<br />
consideration totaling USD 1.1 billion in cash and new <strong>Hydro</strong> shares<br />
equivalent to a 22 percent share in the company's outstanding share<br />
capital. To partly finance the transaction, support the company’s<br />
investment class credit rating and capacity to implement future projects,<br />
<strong>Hydro</strong> completed a fully subscribed rights issue of NOK 10 billion in July<br />
2010. Information on the consequences of the issue for existing and new<br />
shareholders was made public in June and July 2010 in press releases,<br />
in the rights issue prospectus, in the memorandum that was prepared in<br />
connection with <strong>Hydro</strong>'s takeover of the majority of Vale S.A.'s bauxite,<br />
alumina and aluminium activities in Brazil and at the extraordinary<br />
general meeting. See also items 8 and 9.<br />
<strong>Hydro</strong>'s code of conduct contains guidelines for how any conflicts of<br />
interest that may arise should be dealt with. The code applies to all board<br />
of directors members and <strong>Hydro</strong> employees. It is the opinion of the board<br />
of directors that there were no material transactions between the group<br />
and its shareholders, board members, officers or close associates of<br />
such parties in 2011.<br />
Regulation of share issues and pre-emptive rights are described in<br />
<strong>Hydro</strong>'s Articles of Association.<br />
State ownership As of December 31, 2011, the Norwegian state, represented by the<br />
Ministry of Trade and Industry, owned 34.3 percent of <strong>Hydro</strong>'s issued<br />
shares. <strong>Hydro</strong> holds regular meetings with the Ministry, where topics<br />
discussed include <strong>Hydro</strong>’s economic development, strategic<br />
development, corporate social responsibility, and the Norwegian State's<br />
expectations regarding results and returns on investments. These<br />
meetings are comparable to what is customary between a private<br />
company and its principal shareholders. The meetings comply with the<br />
provisions specified in company and securities legislation, not least with<br />
respect to equal treatment of shareholders. As a shareholder, the<br />
Norwegian state does not usually have access to more information than<br />
what is available to other shareholders. If state participation is imperative<br />
and the government must seek approval from the Norwegian parliament<br />
(Stortinget), it may be necessary to provide the Ministry with insider<br />
information. In such cases, the state is subject to the general rules that<br />
apply to the handling of such information.<br />
5 Freely negotiable shares The <strong>Hydro</strong> share is freely negotiable. They are among the most traded<br />
shares on the Oslo Stock Exchange and are subject to efficient pricing.<br />
CORPORATE GOVERNANCE<br />
Further on the Norwegian code of practice for corporate governance 133<br />
As of 31 December 2011, the Norwegian state, represented by the<br />
Ministry of Trade and Industry owned 34.3 percent of <strong>Hydro</strong>'s issued<br />
shares. The Government Pension Fund Norway owned 4.2 percent.<br />
Under the transaction with <strong>Hydro</strong>, Vale received 22 percent of <strong>Hydro</strong>'s<br />
outstanding shares. At the same time, Norwegian state ownership,<br />
represented by the Ministry of Trade and Industry, was reduced from<br />
43.7 percent to 34.3 percent. Under the agreement between <strong>Hydro</strong> and<br />
Vale, Vale may not increase its ownership interest in <strong>Hydro</strong> beyond 22<br />
percent. Furthermore, Vale must retain its shares in <strong>Hydro</strong> for at least<br />
two years after the transaction is completed, and must not sell shares<br />
constituting more than 10 percent of <strong>Hydro</strong>'s issued shares to any<br />
individual buyer or group.<br />
<strong>Hydro</strong>'s code of conduct can be found<br />
on www.hydro.com/principles<br />
<strong>Hydro</strong>'s Articles of Association can be<br />
found on www.hydro.com/governance<br />
Read more about major shareholders<br />
at page 117<br />
Read more about the <strong>Hydro</strong> share at<br />
page 115
134<br />
CORPORATE GOVERNANCE<br />
Further on the Norwegian code of practice for corporate governance<br />
Topic Comments References<br />
6 General meeting The notice of a general meeting of shareholders is normally published on<br />
www.hydro.com approximately four weeks in advance, and is sent to the<br />
shareholders at least three weeks before the meetings are held.<br />
Notice of general meetings provides information on the procedures which<br />
shareholders must observe in order to participate in and vote at the<br />
meetings. Notices also detail:<br />
• the procedure for representation by proxy, including the use of a form<br />
of proxy<br />
• the right of shareholders to propose resolutions for consideration by the<br />
general meeting<br />
• the website where the notice of the meeting and other supporting<br />
documents will be made available<br />
The following information is available at www.hydro.com:<br />
• information on the right of shareholders to propose matters for<br />
consideration by the general meeting<br />
• how to make proposals for resolutions for consideration by the general<br />
meeting or how to comment on matters for which no resolution is<br />
proposed<br />
• form of proxy<br />
Our aim is that the resolution proposals and supporting information that<br />
are distributed are sufficiently detailed and comprehensive to enable<br />
shareholders to reach decisions on the matters to be considered at the<br />
meeting.<br />
The notification deadline for shareholders wishing to attend the general<br />
meeting is five days prior to the meeting.<br />
Shares registered in a nominee account must be re-registered in the<br />
Norwegian Central Securities Depository no later than the fifth business<br />
day before the general meeting in order to obtain voting rights.<br />
Shareholders who are unable to attend in person may vote by proxy.<br />
<strong>Hydro</strong> will nominate a person who will be available to vote on behalf of<br />
shareholders as their proxy.<br />
The general meeting votes for each candidate nominated for election to<br />
the company’s corporate assembly and nomination committee.<br />
To the extent possible, the form of proxy will facilitate separate voting<br />
instructions for each matter to be considered by the meeting and for each<br />
of the candidates nominated for election.<br />
On 5 May 2011 the general meeting resolved that the possibility to cast<br />
advance votes electronically may be given.<br />
The general meeting is chaired by the chair of the corporate assembly or,<br />
in his or her absence, by the deputy chair.<br />
The chairperson of the board of directors, nomination committee<br />
representative(s) and the external auditor attend the <strong>Annual</strong> General<br />
Meeting.<br />
Deviation: The board of directors and the nomination committee are<br />
represented at the general meeting of shareholders, but all members are<br />
not necessarily present.<br />
7 Nomination committee In accordance with <strong>Hydro</strong>'s Articles of Association, the company must<br />
appoint a nomination committee. This committee comprises four<br />
members who are either shareholders or shareholder representatives.<br />
The committee's chairperson and members are appointed by the general<br />
meeting of shareholders. At least two, including the chairperson, must be<br />
elected from among the representatives in the corporate assembly<br />
elected by the shareholders.<br />
The shareholders may propose candidates for the board of directors , the<br />
corporate assembly and the nomination committee.<br />
Read more about the general meeting<br />
at www.hydro.com/investor<br />
Read more about <strong>Hydro</strong>'s Articles of<br />
Association and the nomination<br />
committee's mandate and members<br />
at www.hydro.com/governance<br />
Nominations may be submitted<br />
electronically via<br />
www.hydro.com/governance
Topic Comments References<br />
8 Corporate assembly and board<br />
of directors: Composition and<br />
independence<br />
9 The work of the board of<br />
directors<br />
CORPORATE GOVERNANCE<br />
Further on the Norwegian code of practice for corporate governance 135<br />
The general meeting of shareholders has established guidelines for the<br />
nomination committee (May 5, 2011). The general meeting also<br />
determines the remuneration of the committee. All shareholders may<br />
submit proposals to the nomination committee of candidates to the corpo<br />
at any time. In order to be considered at the next ordinary election,<br />
proposals must be submitted by the end of January in the election year.<br />
The recommendations of the nomination committee include details on the<br />
candidates' background and independence.<br />
All members of the nomination committee are independent of <strong>Hydro</strong>'s<br />
board of directors, Chief Executive Officer and other executive<br />
management.<br />
As the largest shareholder, the Norwegian state is represented on the<br />
nomination committee by Mette I. Wikborg, Director General of the<br />
Ownership Department, on behalf of the Ministry of Trade and Industry.<br />
All board directors, members of the board committees and members of<br />
the corporate assembly are independent of the company's executive<br />
management and material business relationships. Lars Tronsgård, a<br />
member of the corporate assembly, is an employee of the Government<br />
Pension Fund Norway. Tito Botelho Martins Jr., who is Chief Financial<br />
Officer in Vale S.A., sits on <strong>Hydro</strong>'s board of directors.<br />
Two thirds of the corporate assembly and its deputies are elected by the<br />
general meeting of shareholders. The nomination committee nominates<br />
candidates with a view to broad representation by the company's<br />
shareholders and other relevant stakeholders with competence in, for<br />
example, technology, finance, and corporate social responsibility.<br />
The corporate assembly elects the board directors, including its<br />
chairperson and deputy chairperson.<br />
In compliance with <strong>Hydro</strong>'s articles of association, the board consists of<br />
between 9 and 11 members. These are elected for a period of two years.<br />
The upper age limit for members of the board of directors and the<br />
corporate assembly is 70.<br />
The nomination committee aims to achieve a board composition whereby<br />
the members complement each other professionally and the board of<br />
directors is able to function as a corporate body.<br />
As from 28 February 2011, Vale is represented on <strong>Hydro</strong>'s board of<br />
directors. This decision was approved by <strong>Hydro</strong>'s general meeting of<br />
shareholders and corporate assembly. On the same date, Tito Martins Jr.<br />
was appointed as a 10th member of <strong>Hydro</strong>'s board of directors.<br />
As of 31 December 2011, seven of the board's directors own a total of<br />
118,715 shares. <strong>Hydro</strong> has no share purchase program for members of<br />
the board of directors, with the exception of employee representatives,<br />
who are entitled to buy shares through the employee share purchase<br />
scheme. All share purchase transactions are conducted in compliance<br />
with the Securities Trading Act. Vale owns 447,834,465 shares in <strong>Hydro</strong>.<br />
The board of directors has established procedures for its own work and<br />
for the executive management, with particular emphasis on clear internal<br />
division of responsibilities whereby the board has responsibility for<br />
supervising and administrating the company and the executive<br />
management has responsibility for the general operation of the Group.<br />
An overview of the members of the<br />
corporate assembly, can be found at<br />
page 130.<br />
Vale S.A. and the Government<br />
Pension Fund Norway are significant<br />
shareholders in <strong>Hydro</strong>; see page 117.<br />
See page 126 for the current<br />
composition of the board of dirctors<br />
See <strong>Hydro</strong>'s Articles of Association at<br />
www.hydro.com/governance<br />
See page 130 for the current<br />
composition of the board of dirctors<br />
The board of directors' mandate is<br />
available at<br />
www.hydro.com/governance<br />
See also page 130-131
136<br />
CORPORATE GOVERNANCE<br />
Further on the Norwegian code of practice for corporate governance<br />
Topic Comments References<br />
10 Risk management and internal<br />
controls<br />
11 Remuneration of the board of<br />
directors<br />
12 Remuneration of the executive<br />
management<br />
If the chairperson of the board of directors is or has been actively<br />
engaged in a given case, another board member will normally lead<br />
discussions concerning that particular case.<br />
The board of directors has an annual work plan, with particular emphasis<br />
on objectives, strategy and implementation.<br />
Since 2001 <strong>Hydro</strong> has had an audit committee and a compensation<br />
committee.<br />
The board of directors conducts an annual self-assessment of its work,<br />
competence and cooperation with management and a separate<br />
assessment of the chairperson. Both assessments are submitted to the<br />
nomination committee, which in turn assesses the board of directors'<br />
composition, competence and performance.<br />
The board of directors ensures that the company has sound internal<br />
controls and appropriate risk management systems through, for example,<br />
an annual review of the key risk areas and the company's internal<br />
controls. Internal audit reports directly to the board of directors, but is for<br />
administrative purposes placed under the purview of the Chief Financial<br />
Officer.<br />
<strong>Hydro</strong>'s internal control system includes all parts of our corporate<br />
directives, including our code of conduct and HSE and corporate social<br />
corporate responsibility requirements. The annual report contains a more<br />
detailed description of the company's internal controls and risk<br />
management systems related to financial reporting.<br />
The shareholder-elected members of th board of directors perform no<br />
duties for the company other than their board duties.<br />
Remuneration is determined by the Corporate Assembly on the<br />
recommendation of the nomination committee. The nomination<br />
committee recommends compensation with the intention that it should<br />
reflect the board's responsibility, competence and time commitment as<br />
well as the company's complexity and global activities compared with the<br />
general level of directors' fees in Norway. Remuneration of the board of<br />
directors is based neither on performance nor on shares.<br />
The board of directors has established guidelines for remuneration of<br />
members of the executive management. These guidelines are<br />
communicated to the general meeting of shareholders and included in<br />
the annual report. The guidelines for determining remuneration of the<br />
executive management are based on the main principles for <strong>Hydro</strong>'s pay<br />
policy, which is that <strong>Hydro</strong> shall offer its employees an overall<br />
compensation package that is competitive and in line with good industry<br />
standards in the country in question. Where appropriate this package<br />
should include, in addition to the base salary, also a performance-based<br />
incentive that overall shall reflect individual performance. Determination<br />
of the level of the total compensation package will be first and foremost<br />
based on being competitive, but not a wage leader.<br />
The guidelines are also intended to contribute to long-term value creation<br />
for the company's shareholders. A ceiling has been set on performancebased<br />
compensation. The company has share-based long-term incentive<br />
programs, but no share option scheme for its executive management.<br />
For more details about the<br />
composition and tasks of these<br />
committees, see page 130-131.<br />
A review of <strong>Hydro</strong>'s main risks can be<br />
found at page 107.<br />
All aspects of remuneration of the<br />
board directors are described in Note<br />
44.<br />
<strong>Hydro</strong>'s Articles of Association are<br />
available at<br />
www.hydro.com/governance<br />
The board's guidelines for<br />
management remuneration are<br />
described in Note 10. All aspects of<br />
remuneration of executive<br />
management are described in Note<br />
11.<br />
<strong>Hydro</strong>'s remuneration policy is also<br />
described in <strong>Hydro</strong>'s People Policy,<br />
which is available at<br />
www.hydro.com/principles<br />
See also page 64<br />
Learn more about performance-based<br />
compensation and long-term<br />
incentives in Notes 10 and 11.
Topic Comments References<br />
13 Information and communication <strong>Hydro</strong> has established guidelines for the company's reporting of financial<br />
and other information based on transparency and with regard to the<br />
requirement of equal treatment of all parties in the securities market. This<br />
also pertains to contact with shareholders outside of the general meeting.<br />
A financial calendar is available in this report and at www.hydro.com Page 120<br />
Shareholder information is available at www.hydro.com<br />
The Financial Statements and <strong>Annual</strong> <strong>Report</strong> are sent free of charge to<br />
shareholders on request. Notice of a general meeting of shareholders is<br />
sent directly to shareholders unless they have consented to receive<br />
these documents electronically.<br />
14 Takeovers The board of directors will handle takeover bids in accordance with<br />
Norwegian law and the Norwegian Code of Practice for Corporate<br />
Governance. No mechanisms to prevent takeover bids are contained in<br />
our Articles of Association or underlying steering documents, nor have<br />
we implemented any measures limiting opportunities to buy shares in the<br />
company. See also item 5.<br />
Despite the restrictions described in item 5 to which Vale is subject, Vale<br />
may sell its shares in <strong>Hydro</strong> to a third party on the following conditions:<br />
The third party must make an unconditional offer for all the <strong>Hydro</strong> shares<br />
or the offer must be recommended by <strong>Hydro</strong>'s board of directors, and the<br />
third party must own or become the owner of 50 percent of <strong>Hydro</strong>'s<br />
shares during the bidding period before Vale may sell its shares to a third<br />
party.<br />
Deviation: The board of directors has chosen not to prepare explicitly<br />
formulated general principles for handling takeover bids. The reason for<br />
this is that the Norwegian state, represented by the Ministry of Trade and<br />
Industry, owns 34.3 percent of the <strong>Hydro</strong> shares issuedd (as of<br />
31.12.2011) and has clearly expressed a long-term ownership<br />
perspective in the company for the purpose of retaining its head office<br />
and research activities in Norway. Reference is given to e.g. the Active<br />
Ownership <strong>Report</strong> (<strong>Report</strong> to the Storting no. 13, 2010-2011).<br />
15 Auditor Every year the external auditor presents to the audit committee the main<br />
features of the plan for the audit of the company.<br />
CORPORATE GOVERNANCE<br />
Further on the Norwegian code of practice for corporate governance 137<br />
The external auditor participates in considering relevant matters at all<br />
meetings of the Audit Committee. The minutes from these meetings are<br />
distributed to all member of the board of directors. This practice is in line<br />
with the EU Audit Directive.<br />
The external auditor expresses its opinion on internal control procedures<br />
in an annual management letter.<br />
The external auditor participates in board of directors' meetings where<br />
the company's financial statements are discussed. At these meetings the<br />
auditor will review material changes in the company's accounting policies,<br />
assess material accounting estimates and any other material matters on<br />
which the exteranl auditor and executive management may disagree, and<br />
identify weaknesses in and suggest improvements to the company's<br />
internal controls.<br />
Both the board of directors and the audit committee hold meetings with<br />
the external auditor without members of the corporate management<br />
present. The audit committee holds meetings with the management of<br />
Internal audit at least once a year without members of the executive<br />
management present.<br />
<strong>Hydro</strong> places importance on independence and has clear guidelines<br />
regarding the use of services from external auditors. All use of services<br />
from an external auditor, including non-audit services, are subject to prior<br />
approval as defined by the audit committee.<br />
Remuneration of the external auditor is stated in the annual report and<br />
approved the general meeting of shareholders<br />
In 2010 the general meeting of shareholders chose KPMG as the new<br />
group external auditor with effect from reporting period 2010.<br />
See also page 115 and 125<br />
Read more about the <strong>Hydro</strong> share at<br />
www.hydro.com/no/investor<br />
See also page 72 and F77<br />
See also page 125<br />
Note 43
Consolidated financial statements f2<br />
Notes to the consolidated<br />
financial statements f7<br />
note 1 significant accounting policies and reportingentity F7<br />
note 2 Changes in accounting principles and<br />
newpronouncements F14<br />
note 3 Basis of presentation and measurement of fairvalue F15<br />
note 4 Critical accounting judgment and key sourcesof<br />
estimation uncertainty F16<br />
note 5 Acquisitions F18<br />
note 6 Financial and commercial risk management F20<br />
note 7 operating and geographic segmentinformation F23<br />
note 8 other income F27<br />
note 9 raw material and energy expense F28<br />
note 10 Board of Directors’ statement onManagement<br />
remuneration F28<br />
note 11 employee and management remuneration F30<br />
note 12 Depreciation and amortization expense F33<br />
note 13 Impairment of non-current assets F33<br />
note 14 research and development F34<br />
note 15 operating leases F34<br />
note 16 Financial income and expense F35<br />
note 17 Income tax expense F35<br />
note 18 short-term investments F36<br />
note 19 Accounts receivable F36<br />
note 20 Inventories F36<br />
note 21 other non-current assets F37<br />
note 22 property, plant and equipment F37<br />
note 23 Intangible assets F38<br />
note 24 Goodwill F39<br />
note 25 Investments in associates F39<br />
note 26 Investments in jointly controlled entities F41<br />
FInAnCIAl stAteMents<br />
Index<br />
F1<br />
07:<br />
Financial statements<br />
note 27 Jointly owned assets F43<br />
note 28 Bank loans and other interest-bearing<br />
short-termdebt F44<br />
note 29 trade and other payables F44<br />
note 30 long-term debt F44<br />
note 31 provisions F45<br />
note 32 employee retirement plans F46<br />
note 33 Deferred tax F48<br />
note 34 shareholders’ equity F49<br />
note 35 Capital management F50<br />
note 36 Dividends F52<br />
note 37 Guarantees F53<br />
note 38 Contingent liabilities and contingent assets F53<br />
note 39 Contractual commitments and<br />
othercommitments for future investments F54<br />
note 40 Financial instruments F55<br />
note 41 Derivative instruments and hedge accounting F58<br />
note 42 Cash flow information F60<br />
note 43 Auditor remuneration F60<br />
note 44 Board of Directors and Corporate Assembly F61<br />
note 45 related party information F62<br />
financial statements<br />
Norsk <strong>Hydro</strong> ASA f64<br />
Notes to the financial<br />
statements Norsk <strong>Hydro</strong> ASA f67<br />
Responsibility Statement f76<br />
Auditor’s report f77<br />
Corporate assembly f79
F2<br />
FINANCIAL STATEMENTS<br />
Consolidated financial statements<br />
Consolidated financial statements<br />
Consolidated income statements<br />
Amounts in NOK million (except per share amounts). Years ended December 31 Notes 2011 2010<br />
Revenue 7 91 444 75 754<br />
Share of the profit (loss) in equity accounted investments 7, 25, 26 (260) (606)<br />
Other income, net 7, 8 6 222 568<br />
Total revenue and income 97 406 75 717<br />
Raw material and energy expense 9 55 825 48 694<br />
Employee benefit expense 11 11 202 10 282<br />
Depreciation and amortization expense 12 4 928 2 952<br />
Impairment of noncurrent assets 13 1 231 32<br />
Other 14, 15 14 394 10 573<br />
Total expenses 87 579 72 533<br />
Earnings before financial items and tax 7 9 827 3 184<br />
Financial income 16 209 346<br />
Financial expense 16 (1 498) 176<br />
Financial income (expense), net (1 288) 522<br />
Income before tax 8 539 3 706<br />
Income taxes 17 (1 790) (1 588)<br />
Net income 6 749 2 118<br />
Net income attributable to minority interests 44 230<br />
Net income attributable to <strong>Hydro</strong> shareholders 6 705 1 888<br />
Basic and diluted earnings per share attributable to <strong>Hydro</strong> shareholders 34 3.41 1.33<br />
The accompanying notes are an integral part of the consolidated financial statements.
Consolidated statements of comprehensive income<br />
Amounts in NOK million. Years ended December 31 Notes 2011 2010<br />
Net income 6 749 2 118<br />
Other comprehensive income<br />
Currency translation differences, net of tax 34 (3 264) (932)<br />
Unrealized gain (loss) on securities, net of tax 34 (259) 22<br />
Cash flow hedges, net of tax 34 58 (58)<br />
Share of other comprehensive income in equity accounted investments, net of tax 34 (289) (234)<br />
Other comprehensive income (3 754) (1 201)<br />
Total comprehensive income 2 995 917<br />
Total comprehensive income attributable to minority interests (272) 260<br />
Total comprehensive income attributable to <strong>Hydro</strong> shareholders 3 267 657<br />
The accompanying notes are an integral part of the consolidated financial statements.<br />
FINANCIAL STATEMENTS<br />
Consolidated statements of comprehensive income F3
F4<br />
FINANCIAL STATEMENTS<br />
Consolidated balance sheets<br />
Consolidated balance sheets<br />
Amounts in NOK million, December 31 Notes 2011 2010 2009<br />
Assets<br />
Cash and cash equivalents 8 365 10 929 2 573<br />
Shortterm investments 18 1 780 1 321 1 519<br />
Accounts receivable 19 13 217 12 783 11 571<br />
Inventories 20 14 157 10 971 10 030<br />
Other current financial assets 40 666 814 2 109<br />
Total current assets 7 38 185 36 817 27 802<br />
Property, plant and equipment 22 64 192 24 849 25 647<br />
Intangible assets 23, 24 7 930 1 920 1 881<br />
Investments accounted for using the equity method 25, 26 11 442 18 649 15 721<br />
Other noncurrent assets 21, 40 7 348 3 391 3 818<br />
Prepaid pension 32 1 596 1 481 1 328<br />
Deferred tax assets 33 1 860 1 681 1 402<br />
Total noncurrent assets 7 94 368 51 971 49 797<br />
Total assets 7 132 554 88 788 77 599<br />
Liabilities and equity<br />
Bank loans and other interestbearing shortterm debt 28 4 248 940 2 010<br />
Trade and other payables 29 12 316 9 920 9 917<br />
Provisions 31 1 369 1 758 1 094<br />
Taxes payable 2 505 1 999 1 196<br />
Other current financial liabilities 2, 40 779 1 292 826<br />
Total current liabilities 21 216 15 910 15 042<br />
Longterm debt 30 4 190 328 88<br />
Provisions 31 3 331 2 104 2 007<br />
Pension obligation 32 9 099 9 088 9 368<br />
Other noncurrent financial liabilities 2, 40 2 943 1 895 2 144<br />
Other liabilities 1 282 838 906<br />
Deferred tax liabilities 2, 33 5 325 1 183 849<br />
Total noncurrent liabilities 26 170 15 435 15 361<br />
Total liabilities 47 386 31 346 30 403<br />
Share capital 34 2 272 1 780 1 362<br />
Additional paidin capital 34 29 056 9 553 43<br />
Treasury shares 34 (1 084) (1 112) (1 177)<br />
Retained earnings 2 51 792 46 616 45 128<br />
Other components of equity 34 (3 856) (418) 813<br />
Equity attributable to <strong>Hydro</strong> shareholders 78 180 56 418 46 169<br />
Minority interests 6 988 1 025 1 026<br />
Total equity 85 168 57 443 47 195<br />
Total liabilities and equity 132 554 88 788 77 599<br />
The accompanying notes are an integral part of the consolidated financial statements.
Consolidated statements of cash flows<br />
Amounts in NOK million. Years ended December 31 Notes 2011 2010<br />
Operating activities<br />
Net income 6 749 2 118<br />
Adjustments to reconcile net income to net cash provided by operating activities:<br />
Depreciation, amortization and impairment 7, 12, 13 6 158 2 985<br />
Share of loss in equity accounted investments 7, 25, 26 260 606<br />
Dividends received from equity accounted investments 25, 26 99 108<br />
Deferred taxes (103) (64)<br />
Gain on sale of noncurrent assets (5 328) (49)<br />
Loss (gain) on foreign currency transactions 16 971 (513)<br />
Net sales (purchases) of trading securities (16) 233<br />
Capitalized interest 16 (1) (5)<br />
Changes in assets and liabilities that provided (used) cash:<br />
Accounts receivable 445 (1 693)<br />
Inventories (1 158) (1 176)<br />
Trade and other payables 759 311<br />
Financial and commodity derivatives (357) 2 003<br />
Other items (1 201) 1 499<br />
Net cash provided by operating activities 42 7 277 6 363<br />
Investing activities<br />
Purchases of property, plant and equipment (3 841) (2 138)<br />
Purchases of other longterm investments (6 328) (3 918)<br />
Proceeds from sales of property, plant and equipment 110 23<br />
Proceeds from sales of other longterm investments 1 295 (18)<br />
Net cash used in investing activities (8 764) (6 051)<br />
Financing activities<br />
Loan proceeds 3 668 3 167<br />
Principal repayments (2 880) (4 056)<br />
Net increase (decrease) in other shortterm debt 146 (180)<br />
Proceeds from shares issued 88 9 910<br />
Dividends paid (1 781) (866)<br />
Net cash provided by (used in) financing activities (759) 7 975<br />
Foreign currency effects on cash and bank overdraft (145) (51)<br />
Net increase (decrease) in cash, cash equivalents and bank overdraft (2 391) 8 236<br />
Cash, cash equivalents and bank overdraft at beginning of year 10 735 2 499<br />
Cash, cash equivalents and bank overdraft at end of year 42 8 344 10 735<br />
The accompanying notes are an integral part of the consolidated financial statements.<br />
FINANCIAL STATEMENTS<br />
Consolidated statements of cash flows F5
F6<br />
FINANCIAL STATEMENTS<br />
Consolidated statements of changes in equity<br />
Consolidated statements of changes in equity<br />
Amounts in NOK million Notes<br />
Share<br />
capital<br />
Additional<br />
paidin Treasury Retained<br />
capital shares earnings<br />
Other<br />
components<br />
of equity<br />
Equity<br />
attributable<br />
to <strong>Hydro</strong><br />
share Minority<br />
holders interest<br />
December 31, 2009 1 362 43 (1 177) 45 128 813 46 169 1 026 47 195<br />
Treasury shares reissued to employees 34 15 65 80 80<br />
Shares issued 34 418 9 495 9 913 9 913<br />
Dividends 36 (603) (603) (263) (866)<br />
Equity interests purchased 6 6 2 8<br />
Total comprehensive income for the year 1 888 (1 231) 657 260 917<br />
December 31, 2010 1 780 9 553 (1 112) 46 419 (418) 56 221 1 025 57 246<br />
Change in accounting policy 2 197 197 197<br />
December 31, 2010 restated 1 780 9 553 (1 112) 46 616 (418) 56 418 1 025 57 443<br />
Treasury shares reissued to employees 34 11 28 39 39<br />
Shares issued 34 492 19 493 19 985 19 985<br />
Dividends 36 (1 527) (1 527) (314) (1 841)<br />
Minority interest recognized at<br />
acquisition of subsidiaries 5 6 470 6 470<br />
Capital contribution in subsidiaries 78 78<br />
Transactions with minority holders (1) (1) 1 <br />
Total comprehensive income for the year 6 705 (3 438) 3 267 (272) 2 995<br />
December 31, 2011 2 272 29 056 (1 084) 51 792 (3 856) 78 180 6 988 85 168<br />
The accompanying notes are an integral part of the consolidated financial statements.<br />
Oslo, March 20, 2012<br />
Terje Vareberg<br />
Chair<br />
Finn Jebsen<br />
Board member<br />
Sten Roar Martinsen<br />
Board member<br />
Tito Martins<br />
Board member<br />
Bente Rathe<br />
Deputy chair<br />
Inge K. Hansen<br />
Board member<br />
Liv Monica Bargem Stubholt<br />
Board member<br />
Billy Fredagsvik<br />
Board member<br />
Ove Ellefsen<br />
Board member<br />
Eva Persson<br />
Board member<br />
Svein Richard Brandtzæg<br />
President and CEO<br />
Total<br />
equity
Notes to the consolidated financial statements<br />
FINANCIAL STATEMENTS<br />
Notes to the consolidated financial statements F7<br />
Note 1 - Significant accounting policies and reporting entity<br />
The reporting entity reflected in these financial statements includes Norsk <strong>Hydro</strong> ASA and consolidated subsidiaries (<strong>Hydro</strong>).<br />
<strong>Hydro</strong> is headquartered in Oslo, Norway, and the group employs around 23,000 people in more than 40 countries. <strong>Hydro</strong> is a<br />
fully integrated aluminium company with operations in all major activities along the industry value chain. Operations include<br />
power production, bauxite mining, alumina refining, aluminium smelting and remelting, and rolling and extrusion activities.<br />
<strong>Hydro</strong> is listed on the Oslo and London stock exchanges.<br />
The consolidated financial statements of Norsk <strong>Hydro</strong> ASA and its subsidiaries are prepared in accordance with International<br />
Financial <strong>Report</strong>ing Standards (IFRS) as issued by the International Accounting Standards Board (IASB) and the disclosure<br />
requirements as specified under the Norwegian Accounting Law (Regnskapsloven). All standards applied by <strong>Hydro</strong> have been<br />
endorsed by the European Union (EU) and Norwegian authorities and are effective as of December 31, 2011.<br />
The following description of accounting principles applies to <strong>Hydro</strong>'s 2011 financial reporting, including all comparative<br />
figures. See note 3 Basis of presentation and measurement of fair value, and note 4 Critical accounting judgment and key<br />
sources of estimation uncertainty for additional information related to the presentation, classification and measurement of<br />
<strong>Hydro</strong>'s financial reporting.<br />
Basis of consolidation<br />
The consolidated financial statements include Norsk <strong>Hydro</strong> ASA and subsidiaries, which are entities in which <strong>Hydro</strong> has the<br />
power to govern the financial and operating policies of the entity (control). Control is normally achieved through ownership,<br />
directly or indirectly, of more than 50 percent of the voting power. Currently, <strong>Hydro</strong> has more than 50 percent of the voting<br />
power in all subsidiaries. Subsidiaries are included from the date control commences until the date control ceases.<br />
Intercompany transactions and balances have been eliminated. Profits and losses resulting from intercompany transactions have<br />
been eliminated.<br />
Minority interests<br />
Minority interests represent non-controlling interests in subsidiaries. Minority interests are reported as a separate section of the<br />
Group's equity in accordance with IAS 27 Consolidated and Separate Financial Statements. Results attributed to minority<br />
interests are based on ownership interest or other method of allocation if required by contract. Dividends to minority<br />
shareholders are not presented separately.<br />
Business combinations<br />
Business combinations are accounted for using the acquisition method in accordance with IFRS 3 (revised 2008) Business<br />
Combinations (IFRS 3R). Consideration is the sum of the fair values, as of the date of exchange, of the assets given, liabilities<br />
incurred or assumed, and equity instruments issued in exchange for control of the acquiree. The fair value of <strong>Hydro</strong>'s<br />
preexisting ownership interest in an acquiree is included in the consideration, with any gain or loss recognized in Other<br />
income, net.<br />
The acquiree's identifiable assets, liabilities and contingent liabilities are recognized separately at the acquisition date at their<br />
fair value irrespective of any minority interest. Goodwill is initially measured either as the excess of the consideration over<br />
<strong>Hydro</strong>'s interest in the fair value of the acquiree's identifiable net assets (partial goodwill) or as the fair value of 100 percent of<br />
the acquiree in excess of the acquiree's identifiable net assets (full goodwill). The method is elected on a transaction-bytransaction<br />
basis. Goodwill is not amortized, but is tested for impairment annually and more frequently if indicators of possible<br />
impairment are observed, in accordance with IAS 36 Impairment of Assets. Goodwill is allocated to the cash generating units<br />
or groups of cash generation units expected to benefit from the synergies of the combination and that are monitored for<br />
internal management purposes.<br />
The interest of minority shareholders in the acquiree is initially measured as the minority's proportion of the fair value of the<br />
net assets recognized (partial goodwill method), or as the minority's proportion of the fair value of the acquiree (full goodwill<br />
method). Minority interests are subsequently adjusted for changes in equity after the acquisition date.
F8<br />
FINANCIAL STATEMENTS<br />
Note 1 - Significant accounting policies and reporting entity<br />
Transactions between minority shareholders and the group<br />
Sales and purchases of share interests and equity contributions not resulting in <strong>Hydro</strong> gaining or losing control of a subsidiary<br />
are reported as equity transactions in accordance with IAS 27. No gain, loss or change of recognized assets, liabilities or<br />
goodwill is recognized as result of such transactions.<br />
Investments in associates and jointly controlled entities<br />
An associate is an equity investment in which <strong>Hydro</strong> has the ability to exercise significant influence, which is the power to<br />
participate in the financial and operating policy decisions of the entity. Significant influence is assumed to exist when <strong>Hydro</strong><br />
owns between 20 to 50 percent of the voting rights unless other terms and conditions affects <strong>Hydro</strong>'s ability to exercise<br />
significant influence. Currently, one equity investment of less than 20 percent ownership is classified as an associate.<br />
A joint venture is an entity, asset or operation that is subject to contractually established joint control. Special voting rights may<br />
extend control beyond what is conveyed through the owners' proportional ownership interest. Such rights may take the form of<br />
a specified number of board representatives, the right of refusal for important decisions, or the requirement of a qualified<br />
majority for important decisions which effectively results in joint control with the specific ownership situation.<br />
<strong>Hydro</strong> accounts for investments in associates and participation in a joint venture which is conducted in an entity using the<br />
equity method. This involves recognizing <strong>Hydro</strong>'s interest based on its proportional share of the entity's equity, including any<br />
excess values or goodwill. <strong>Hydro</strong> recognizes its share of net income, including depreciation and amortization of excess values<br />
and any impairment losses, in Share of the profit (loss) in equity accounted investments. Other comprehensive income derived<br />
from associates and joint ventures is included in <strong>Hydro</strong>'s Other comprehensive income. <strong>Hydro</strong>'s proportional share of<br />
unrealized profits resulting from transactions with associate and joint ventures is eliminated.<br />
Accounting policies used by associates and joint ventures may differ from the accounting policies adopted by <strong>Hydro</strong>.<br />
Differences in recognition or measurement are adjusted for prior to equity accounting described above.<br />
Investments in associates and joint ventures are tested for impairment when there are indications of a possible loss in value. An<br />
impairment loss is recognized if the recoverable amount, estimated as the higher of fair value less cost to sell or value in use is<br />
below <strong>Hydro</strong>'s carrying value. Impairment losses are reversed if circumstances change and the impairment situation is no longer<br />
deemed to exist.<br />
Investments in jointly controlled and jointly owned assets<br />
Jointly owned assets are arrangements where <strong>Hydro</strong> and the other partners have a direct ownership in specifically identified<br />
assets. Jointly controlled assets or operations are such assets or a direct participation in certain operations that are under<br />
contractually joint control. <strong>Hydro</strong> uses the proportional method of accounting for both jointly controlled and jointly owned<br />
assets or operations. Under the proportional method, <strong>Hydro</strong>'s relative share of the assets, liabilities, income and expense for<br />
these arrangements is included on a line-by-line basis in the group financial statements.<br />
Assets held for sale and Income from discontinued operations<br />
Assets held for sale are reported separately in accordance with IFRS 5 Non-current Assets Held for Sale and Discontinued<br />
Operations, provided that the sale is highly probable, which includes the criteria that management is committed to the sale,<br />
and that the sale will be completed within one year. Assets held for sale are not depreciated, but are measured at the lower of<br />
carrying value and the fair value less costs to sell. Assets are not reclassified in prior period balance sheets. Immaterial disposal<br />
groups are not reclassified.<br />
A discontinued operation is a component of <strong>Hydro</strong> that is held for sale or has been disposed of and that can be clearly<br />
distinguished both operationally and for financial reporting purposes. A discontinued operation is a separate major line of<br />
business or geographical area of operations. Related cash flows, results of operations and gain or loss from disposal are reported<br />
separately as Income from discontinued operations.<br />
Foreign currency transactions<br />
Transactions in foreign currencies are initially recorded in the functional currency of the entity by applying the rate of exchange<br />
as of the date of the transaction. Monetary assets and liabilities denominated in foreign currencies are translated into the<br />
functional currency at the rate of exchange at the balance sheet date. Realized and unrealized currency gains or losses are<br />
included in financial expense.
Foreign currency translation<br />
For consolidation purposes, the financial statements of subsidiaries, joint ventures and associates with a functional currency<br />
other than Norwegian kroner (NOK) are translated into NOK. Assets and liabilities, including goodwill, are translating using<br />
the rate of exchange as of the balance sheet date. Income, expenses and cash flows are translated using the average exchange rate<br />
for the reported period. Translation adjustments are recognized in Other comprehensive income and accumulated in Currency<br />
translation reserve in Other components of equity. On disposal of such subsidiary, joint venture or associate, the cumulative<br />
translation adjustment of the disposed entity is recognized in the income statement.<br />
Provisions<br />
Provisions are recognized when <strong>Hydro</strong> has a present obligation (legal or constructive) as a result of a past event, it is probable<br />
(more likely than not) that <strong>Hydro</strong> will be required to settle the obligation, and a reliable estimate can be made of the amount,<br />
taking into account the risks and uncertainties. The provision is measured at the present value of the cash flows estimated to<br />
settle the obligation. See also the accounting policy discussion for Asset retirement obligations.<br />
Exit and disposal activity costs<br />
<strong>Hydro</strong> recognizes a provision in the amount of the direct costs associated with an exit and/or disposal activity when a formal<br />
commitment to a detailed exit plan is made and communicated to those affected. A provision for termination benefits to<br />
employees is recognized as of the date of employee notification. Costs related to such activities are classified as restructuring<br />
costs if the exit or disposal materially change the scope of <strong>Hydro</strong>'s business.<br />
Contingent liabilities and assets<br />
A contingent liability is a possible obligation that arises from a past event, with the resolution of the contingency dependent on<br />
uncertain future events, or a present obligation where no outflow is probable. Contingent liabilities are disclosed in the<br />
financial statements unless the possibility of an outflow of economic resources is remote. Contingent assets are not recognized<br />
in the financial statements.<br />
Guarantees<br />
<strong>Hydro</strong> recognizes a liability for the fair value of obligations undertaken in issuing guarantees.<br />
FINANCIAL STATEMENTS<br />
Note 1 - Significant accounting policies and reporting entity F9<br />
Revenue recognition<br />
Revenue from sales of products, including products sold in international commodity markets, is recognized upon transfer of<br />
ownership, which generally occurs on delivery. Rebates and incentive allowances are deferred and recognized in income upon<br />
the realization or at the closing of the rebate period. In arrangements where <strong>Hydro</strong> acts as an agent, such as commission sales,<br />
the net commission fee is recognized as revenue.<br />
To the extent a transaction consists of multiple elements, the transaction is analyzed into the separately identifiable components<br />
for revenue recognition.<br />
Margins related to the trading of derivative commodity instruments, including instruments used for risk management purposes,<br />
purchase or delivery of physical commodities on a commodity exchange, and physical commodity swaps with a single<br />
counterparty, are presented on a net basis in the income statement with trading margins included in revenues.<br />
Other income, net<br />
Transactions resulting in income from activities other than normal production and sales operations are classified as Other<br />
income, net. This includes gains and losses resulting from the sale or disposal of PP&E, investments in subsidiaries, associates<br />
or joint ventures as well as government grants, rental revenue and revenue from utilities.<br />
Inventories<br />
Inventories are valued at the lower of cost, using the first-in, first-out method (FIFO), or net realizable value. Net realizable<br />
value is the estimated selling price in the ordinary course of business less estimated costs of completion and selling costs.<br />
Inventory cost includes direct materials, direct labor and a portion of production overhead (manufactured goods) or the<br />
purchase price of the inventory. Abnormal amounts of idle facility expense, freight, handling costs, and wasted materials are<br />
recognized as expense in the current period. Inventory write-downs to net realizable value occurs when the cost of the inventory<br />
is not recoverable, and is reversed in later periods when there is clear evidence of an increase in the net realizable value.
F10<br />
FINANCIAL STATEMENTS<br />
Note 1 - Significant accounting policies and reporting entity<br />
Property, plant and equipment<br />
Property, plant and equipment (PP&E) is recognized at acquisition cost when there is probable future economic benefits and<br />
the cost can be measured reliably. The carrying value of PP&E is comprised of the historical cost less accumulated depreciation<br />
and any accumulated impairment losses. The carrying value also includes the estimated fair value of the asset retirement<br />
obligation upon initial recognition of the liability. <strong>Hydro</strong> uses the cost model for investment properties.<br />
Exploration cost<br />
Exploration cost for mineral resources are expensed as incurred. Costs related to acquired exploration rights are allocated to the<br />
relevant areas and capitalized. Such costs are expensed if economically viable resources are not identified.<br />
Capitalized maintenance<br />
Expenditures for maintenance and repairs applicable to production facilities are capitalized in accordance with IAS 16 Property,<br />
Plant and Equipment when such costs are incurred on a scheduled basis with a time interval of greater than one year.<br />
Expenditures that regularly occur at shorter intervals are expensed as incurred. Major replacements and renewals are capitalized<br />
and any assets replaced are retired.<br />
Stripping cost<br />
Stripping costs incurred during the production phase are allocated between cost of inventory produced and the existing mine<br />
asset. Stripping costs are allocated as a component of the mine asset when they represent significantly improved access to ore.<br />
Stripping costs include such activities as removal of vegetation as well as digging the actual pit for mining the ore.<br />
Capitalized interest<br />
<strong>Hydro</strong> capitalizes borrowing costs on qualifying assets in accordance with IAS 23 Borrowing Costs. Currency gains or losses<br />
related to <strong>Hydro</strong>'s foreign currency denominated borrowings are not capitalized.<br />
Leased assets<br />
Leases which transfer to <strong>Hydro</strong> substantially all the risks and benefits incidental to ownership of the leased item are identified<br />
using the guidance in IAS 17 Leases and IFRIC 4 Determining whether an Arrangement contains a lease. Such arrangements<br />
are capitalized as finance leases at inception and included under Property, plant and equipment at the fair value of the leased<br />
asset, or, if lower, the present value of the minimum lease payments as of the later of date of the inception of the lease or<br />
getting access to the services of the asset. The assets are depreciated over the shorter of the estimated useful life of the asset or<br />
the lease term. The liability is included in Long-term debt and amortized by the amount of the lease payment less the effective<br />
interest expense. All other leases are classified as operating leases with lease payments recognized as an expense over the term of<br />
the lease.<br />
Asset retirement obligations<br />
<strong>Hydro</strong> recognizes liabilities for the estimated fair value of asset retirement obligations (ARO) relating to assets where such<br />
obligations exists, in the period incurred in accordance with IAS 37 Provisions, Contingent Liabilities and Contingent Assets.<br />
Fair value is estimated as the present value of costs relating to dismantlement or removal of buildings or other assets, and/or the<br />
restoration or rehabilitation of industrial or mining sites. The liability is recognized when an asset is constructed and ready for<br />
use or when the obligation is incurred if imposed at a later date. Related asset retirement costs are capitalized and depreciated<br />
over the useful life of the asset. Accretion costs are recognized for the change in the present value of the liability and classified as<br />
part of Financial expense. Liabilities that are conditional on a future event (e.g. the timing or method of settlement) are<br />
recognized if the fair value of the liability can be reasonably estimated.<br />
Intangible assets<br />
Intangible assets acquired individually or as a group are recognized at fair value when acquired. Intangible assets acquired in a<br />
business combination are recognized at fair value separately from goodwill when they arise from contractual or legal rights or<br />
can be separated from the acquired entity and sold or transferred.<br />
Emission rights<br />
Government granted and purchased CO 2 emission allowances expected to be used towards <strong>Hydro</strong>'s own emissions are<br />
recognized as intangible assets at nominal value (cost). The amounts are not amortized but are tested for impairment at least<br />
annually. Actual CO 2 emissions which exceed the level covered by emission rights are recognized as a liability. Sale of<br />
government granted CO 2 emission rights are recognized at the time of sale at the transaction price. CO 2 emission allowances<br />
purchased for trading are measured and classified as inventory.
FINANCIAL STATEMENTS<br />
Note 1 - Significant accounting policies and reporting entity F11<br />
Research and development<br />
Research expenditures are expensed as incurred. Development costs are capitalized as intangible assets at cost in accordance<br />
with IAS 38 Intangible Assets when the recognition criteria are met, including probable future economic benefit and that the<br />
cost can be measured reliably.<br />
Depreciation and amortization<br />
Depreciation and amortization expenses are measured on a straight-line basis over the estimated useful life of the asset,<br />
commencing when the asset is ready for its intended use. Mine property and development costs in extractive activities are<br />
depreciated using the unit-of-production method. Tangible and intangible assets with an indefinite useful life are not<br />
depreciated. Estimated useful life by category is as follows:<br />
Machinery and equipment, initial investment 4-30 years, for power plants up to 75 years<br />
Machinery and equipment, capitalized maintenance 1-15 years<br />
Buildings 20-50 years<br />
Intangibles with definite lives 3-10 years, for rights related to hydroelectric power production up to 50 years<br />
A component of an item of property, plant and equipment with a significantly differing useful life and a cost that is significant<br />
in relation to the item is depreciated separately. At each financial year-end <strong>Hydro</strong> reviews the residual value and useful life of its<br />
assets, with any estimate changes accounted for prospectively over the remaining useful life of the asset.<br />
Impairment of property, plant and equipment and intangible assets<br />
Property, plant and equipment and intangible assets are reviewed for impairment whenever events or changes in circumstances<br />
indicate that the carrying amount may not be recoverable, in accordance with IAS 36 Impairment of Assets. Intangible assets<br />
with indefinite useful life are tested for impairment at least annually. The carrying amount is not recoverable if it exceeds the<br />
higher of the asset's or cash generating unit's fair value less costs to sell or the value in use. An impairment loss is recognized in<br />
the amount that the carrying value exceeds its recoverable amount. Losses are reversed in the event of a subsequent increase in<br />
the recoverable amount of an impaired asset, however, impairment of goodwill is not reversed.<br />
Financial assets<br />
Financial assets represent a contractual right by <strong>Hydro</strong> to receive cash or another financial asset in the future. Financial assets<br />
include financial instruments used for cash-flow hedges, financial derivatives and commodity derivative contracts. Non-current<br />
assets include long-term financial instruments, other investments, long-term loans to employees, long-term bank accounts,<br />
restricted cash and other long-term receivables.<br />
Financial assets are derecognized when the rights to receive cash from the asset have expired or when <strong>Hydro</strong> has transferred its<br />
rights to receive cash flows and has either transferred substantially all of the risks and rewards of the asset or has transferred<br />
control of the asset.<br />
Cash and cash equivalents, short-term investments, accounts receivable and other non-current financial assets are discussed<br />
below. All other financial assets are measured at amortized cost.<br />
Cash and cash equivalents<br />
Cash and cash equivalents in the balance sheet includes cash, bank deposits and all other monetary instruments with a maturity<br />
of less than three months from the date of acquisition, and are measured at fair value. Cash and cash equivalents in the<br />
statement of cash flows is presented net of outstanding bank overdrafts connected to cash management activities.<br />
Short-term investments<br />
Short-term investments include bank deposits and all other monetary instruments with a maturity between three and twelve<br />
months at the date of purchase. Short-term investments also includes <strong>Hydro</strong>'s current portfolio of marketable equity and debt<br />
securities which are considered trading securities and measured at fair value. The resulting unrealized holding gains and losses<br />
are included in Financial income. Investment income is recognized when earned.<br />
Accounts receivable<br />
Accounts receivable are initially recognized at fair value, and subsequently accounted for at amortized cost and are reviewed for<br />
impairment on an ongoing basis. Individual accounts are assessed for impairment taking into consideration delayed payments<br />
and other indicators of financial difficulty. Other overdue accounts receivable are assessed for impairment based on prior
F12<br />
FINANCIAL STATEMENTS<br />
Note 1 - Significant accounting policies and reporting entity<br />
collection experience, the customer portfolio, local economic conditions and management assessment. Discounting generally<br />
does not have a material effect on accounts receivable, however, in special cases discounting may be applied.<br />
Other non-current assets<br />
Other non-current assets includes <strong>Hydro</strong>'s portfolio of non-marketable equity securities that are not consolidated or accounted<br />
for using the equity method. The portfolio is classified as available-for-sale securities and is measured at fair value with changes<br />
in fair value recognized in Other comprehensive income. Investment income is recognized when earned. Fair value of the<br />
investment is estimated based on valuation model techniques for non-marketable securities. When the estimated fair value of<br />
the investment is below <strong>Hydro</strong>'s cost, the impairment is recognized in earnings. Any reduction in fair value previously<br />
recognized in Other comprehensive income is reclassified to the income statement.<br />
Financial liabilities<br />
Financial liabilities represent a contractual obligation by <strong>Hydro</strong> to deliver cash in the future, and are classified as either short or<br />
long-term. Financial liabilities include financial instruments used for cash-flow hedges, financial derivatives, commodity<br />
derivative contracts and other financial liabilities. Financial liabilities, with the exception of derivatives, are initially recognized<br />
at fair value including transaction costs directly attributable to the transaction and are subsequently measured at amortized cost.<br />
Financial liabilities are derecognized when the obligation is discharged through payment or when <strong>Hydro</strong> is legally released from<br />
the primary responsibility for the liability.<br />
Derivative instruments<br />
Derivative instruments are marked-to-market with the resulting gain or loss reflected in the income statement, except when the<br />
instruments meet the criteria for cash flow hedge accounting. Derivatives, including hedging instruments and embedded<br />
derivatives with expected cash flows within twelve months from the balance sheet date, or held solely for trading are classified as<br />
short-term. Instruments with expected cash flows more than 12 months after the balance sheet date are classified as long-term.<br />
Derivative contracts are presented gross on the balance sheet unless contract terms include the possibility to settle the contracts<br />
on a net basis and <strong>Hydro</strong> has the intention and ability to do so. The ability to settle net is conditional on simultaneous<br />
offsetting cash-flows.<br />
Physical commodity contracts are evaluated on a portfolio basis. If a portfolio of contracts contains contracts of a similar nature<br />
that are settled net in cash, or the assets are not intended for own use, the entire portfolio of contracts is recognized at fair value<br />
and classified as derivatives. Physical commodity contracts that are entered into and continue to be held for the purpose of the<br />
receipt or delivery of the commodity in accordance with <strong>Hydro</strong>'s expected purchase, sale or usage requirements (own use) are<br />
not accounted for at fair value. Commodity purchase contracts are generally considered to be the primary source for usage<br />
requirements. <strong>Hydro</strong>'s own production of such commodities, for instance electricity, is considered to be available for use or sale<br />
at its discretion unless relevant concessions contains restrictions for use.<br />
Derivative commodity instruments are marked-to-market with their fair value recorded in the balance sheet as either assets or<br />
liabilities. Adjustments for changes in the fair value of the instruments are reflected in the current period's revenue and/or cost,<br />
unless the instrument is designated as a cash flow hedge instrument and qualifies for hedge accounting.<br />
Forward currency contracts and currency options are recognized in the financial statements and measured at fair value at each<br />
balance sheet date with the resulting gain or loss recorded in Financial expense.<br />
Interest income and expense relating to swaps are netted and recognized as income or expense over the life of the contract.<br />
The fair value option is currently not utilized by <strong>Hydro</strong>.<br />
Hedge accounting is applied when specific hedge criteria are met, including documentation of the hedge relationship. The<br />
changes in fair value of the hedging instruments are offset in part or in full by the corresponding changes in the fair value or<br />
cash flows of the underlying exposures being hedged. Gains and losses on cash flow hedging instruments are recognized in<br />
Other comprehensive income and deferred in the Hedging reserve in Other components of equity until the underlying<br />
transaction is recognized in earnings. Deferred gains and losses relating to forecasted hedged transactions that are no longer<br />
expected to occur are immediately recognized in earnings. Any amounts resulting from hedge ineffectiveness for both fair value
FINANCIAL STATEMENTS<br />
Note 1 - Significant accounting policies and reporting entity F13<br />
and cash flow hedges are recognized in the current period's income statement. For fair value hedges, both the changes in the<br />
fair value of the designated derivative instrument and the changes in the fair value of the hedged item are recognized currently<br />
in earnings.<br />
An embedded derivative is bifurcated and accounted for as a separate financial instrument, provided that the economic<br />
characteristics and risks of the embedded derivative are not closely related to those of the host contract, a separate instrument<br />
with the same terms as the embedded derivative would meet the definition of a derivative, and the host contract is not<br />
accounted for at fair value. Embedded derivatives are classified both in the income statement and on the balance sheet based on<br />
the risks in the derivatives' underlying.<br />
Income taxes, current and deferred<br />
Taxes payable is based on taxable profit for the year which excludes items of income or expense that are taxable or deductible in<br />
other years. Taxable profit also excludes items that are never taxable or deductible. <strong>Hydro</strong>'s liability for current tax is calculated<br />
using tax rates that have been enacted or substantively enacted as of the balance sheet date.<br />
Deferred income tax expense is calculated using the liability method in accordance with IAS 12 Income Taxes. Deferred tax<br />
assets and liabilities are classified as non-current in the balance sheet and are measured based on the difference between the<br />
carrying value of assets and liabilities for financial reporting and their tax basis when such differences are considered temporary<br />
in nature. Temporary differences related to intercompany profits are deferred using the buyer's tax rate. Deferred tax assets are<br />
reviewed for recoverability every balance sheet date, and the amount probable of recovery is recognized.<br />
Deferred income tax expense represents the change in deferred tax asset and liability balances during the year except for the<br />
deferred tax related to items recognized in Other comprehensive income or resulting from a business combination or disposal.<br />
Changes resulting from amendments and revisions in tax laws and tax rates are recognized when the new tax laws or rates<br />
become effective or are substantively enacted. Uncertain tax positions are recognized in the financial statements based on<br />
management's expectations.<br />
Deferred tax assets and liabilities are offset when there is a legally enforceable right to set off current tax assets against current<br />
tax liabilities, when they relate to income taxes levied by the same taxation authority, and when the Group intends to settle its<br />
current tax assets and liabilities on a net basis.<br />
Deferred taxes are not provided on undistributed earnings of subsidiaries when the timing of the reversal of this temporary<br />
difference is controlled by <strong>Hydro</strong> and is not expected to happen in the foreseeable future. This is applicable for the majority of<br />
<strong>Hydro</strong>'s subsidiaries.<br />
Share-based compensation<br />
<strong>Hydro</strong> accounts for share-based compensation in accordance with IFRS 2 Share-based Payment. Share-based compensation<br />
expense is measured at fair value over the service period and includes social security taxes that will be paid by <strong>Hydro</strong> at the<br />
settlement date. All changes in fair value are recognized in the income statement.<br />
Employee benefits and post-employment benefits<br />
Payments to employees, such as wages, salaries, social security contributions, paid annual leave, as well as bonus agreements are<br />
accrued in the period in which the associated services are rendered by the employee.<br />
Post-employment benefits are recognized in accordance with IAS 19 Employee Benefits. The cost of providing pension benefits<br />
under a defined benefit plan is determined separately for each plan using the projected unit credit method. Past service costs are<br />
recognized in the income statement on a straight-line basis over the remaining vesting period. Past service cost related to<br />
benefits that are already vested are recognized immediately. Net cumulative actuarial gains and losses in excess of the greater of<br />
10 percent of the benefit obligation (before deducting plan assets) and 10 percent of the fair value of any plan assets are<br />
recognized in the income statement over the remaining service period of active plan participants. When the number of active<br />
plan participants is negligible as compared to the number of inactive plan participants, then the excess cumulative actuarial gain<br />
(loss) is fully recognized at the beginning of the following year. The funded status of a defined benefit pension plan is measured<br />
as of December 31, and disclosed in note 32 Employee retirement plans.
F14<br />
FINANCIAL STATEMENTS<br />
Note 1 - Significant accounting policies and reporting entity<br />
Contributions to defined contribution plans are recognized in the income statement in the period in which they accrue. Multiemployer<br />
defined benefit plans where available information is insufficient to use defined benefit accounting are accounted for<br />
as if the plan were a defined contribution plan.<br />
Segment information<br />
<strong>Hydro</strong> identifies its reportable segments and discloses segment information under IFRS 8 Operating Segments.<br />
Note 2 - Changes in accounting principles and new pronouncements<br />
Changes in accounting principles<br />
<strong>Hydro</strong> has elected to change the accounting policy for valuation of its embedded derivatives as of January 1, 2011. All<br />
embedded derivatives are now calculated on the basis of committed volumes for liability positions rather than estimated<br />
volumes. To reflect this change, financial liabilities were decreased by NOK 271 million, deferred tax was increased by NOK<br />
74 million, resulting in a net increase of equity as of January 1, 2011 by NOK 197 million. The change is reflected in the<br />
restated balance sheet for 2010. The income statement effects for 2010 would have been immaterial, therefore the income<br />
statement for 2010 and balance sheet for 2009 has not been restated.<br />
<strong>Hydro</strong> implemented the following new guidance as of January 1, 2011 with no material impact.<br />
IAS 24 (revised 2009) Related Party Disclosure<br />
Amendments resulting from May 2010 <strong>Annual</strong> Improvements to IFRSs<br />
New pronouncements<br />
As of the date of authorization of these financial statements, the following standards, amendments and interpretations have<br />
been issued by the IASB. These standards or amendments have not yet been adopted by <strong>Hydro</strong> and are relevant related to<br />
<strong>Hydro</strong>'s future financial reporting. The effective date is applicable to annual accounting periods beginning on or after that date,<br />
unless stated otherwise. None of the new relevant standards will be implemented in 2012.<br />
IFRS 9 Financial Instruments - Classification and Measurement; effective date January 1, 2015.<br />
IFRS 10 Consolidated Financial Statements; effective date January 1, 2013.<br />
IFRS 11 Joint Arrangements; effective date January 1, 2013.<br />
IFRS 12 Disclosures of Interests with Other Entities; effective date January 1, 2013.<br />
IFRS 13 Fair Value Measurement; effective date January 1, 2013.<br />
IAS 19 Employee Benefits (as revised in 2011); effective date January 1, 2013.<br />
IAS 27 Separate Financial statements (as revised in 2011); effective date January 1, 2013.<br />
IAS 28 Investments in Associates and Joint Ventures (as revised in 2011); effective date January 1, 2013.<br />
IFRIC 20 Stripping Cost in the Production Phase of a Surface Mine; effective date January 1, 2013.<br />
As of the date of issue of <strong>Hydro</strong>'s financial statements, all of the implemented standards, amendments to standards and<br />
interpretations were endorsed by the EU. The new pronouncements to be implemented in 2013 or later were not endorsed by<br />
the EU as of the date of issue of <strong>Hydro</strong>'s financial statements.<br />
<strong>Hydro</strong> is currently evaluating the potential accounting impact of IFRS 9, IFRS 10, IFRS 11, IFRS 12, IFRS 13, IAS 19R, IAS<br />
27R 2011 and IAS 28R. We expect that IFRS 11 Joint Arrangement may impact how <strong>Hydro</strong> accounts for and discloses certain<br />
of our operations conducted in co-operation with others. Further, we expect that IAS 19R Employee Benefits will impact how<br />
post employment benefits including pensions and measurement changes in the measurement related to such arrangements are<br />
reflected in our financial statements.
Note 3 - Basis of presentation and measurement of fair value<br />
Basis of presentation<br />
The financial statements have been prepared on a historical cost basis except for certain assets, liabilities and financial<br />
instruments, which are measured at fair value. Preparation of financial statement including note disclosures requires<br />
management to make estimates and assumptions that affect amounts reported. Actual results may differ. See note 4 Critical<br />
accounting judgment and key sources of estimation uncertainty.<br />
Presentation and classification of items in the financial statements is consistent for the periods presented. Gains and losses on<br />
disposal of non-current assets are presented net, as well as expenditures related to provisions that are reimbursed by a third<br />
party. However, insurance compensation is reported on a gross basis.<br />
The functional currency of Norsk <strong>Hydro</strong> ASA is the Norwegian krone (NOK). The <strong>Hydro</strong> group accounts are presented in<br />
NOK.<br />
As a result of rounding adjustments, the figures in one or more columns included in the financial statements may not add up to<br />
the total of that column.<br />
Net present value<br />
Interest rates used for calculating net present values are rounded to the nearest 25 basis points.<br />
FINANCIAL STATEMENTS<br />
Note 3 - Basis of presentation and measurement of fair value F15<br />
Measurement of fair value<br />
For both financial statement measurement and note disclosure, fair value is estimated using inputs which are to varying degrees<br />
objectively observable. Certain items are valued on the basis of quoted prices in active markets for identical assets or liabilities,<br />
others are valued on the basis of inputs that are derived from observable prices, while certain positions are valued on the basis of<br />
judgmental assumptions that are to a limited degree or not at all based on observable market data.<br />
Financial instruments<br />
The estimated fair value of <strong>Hydro</strong>'s financial instruments is based on market prices and valuation methodologies. Valuations<br />
are made with the objective to include relevant factors that market participants would consider in setting a price, and to apply<br />
accepted economic and financial methodologies for the pricing of financial instruments. References for less active markets are<br />
carefully reviewed to establish relevant and comparable data. Extrapolations and other accepted valuation techniques are<br />
employed in periods with few or no transactions.<br />
<strong>Hydro</strong>'s credit spread for similar liabilities is used when determining the fair value of financial instruments where <strong>Hydro</strong> is net<br />
liable. <strong>Hydro</strong> determines the appropriate discount factor and credit spread for financial assets based on both an individual and<br />
portfolio assessment.<br />
Marketable and non-marketable equity securities<br />
Fair value for listed shares is based on quoted market prices as of the balance sheet date. Fair value for unlisted shares is<br />
calculated based on commonly accepted valuation techniques utilizing significant unobservable data. If fair value cannot be<br />
measured reliably unlisted shares are recognized at cost.<br />
Derivatives<br />
Fair value of financial derivatives, including currency swaps, foreign currency forward contracts and interest rate swaps, is<br />
estimated as the present value of future cash flows, calculated by reference to quoted swap price curves and exchange rates as of<br />
the balance sheet date.<br />
Fair value of commodity derivatives, including futures, forwards and options, is measured as the present value of future cash<br />
flows, calculated using forward curves and exchange rates as of the balance sheet date. Estimates from brokers and extrapolation<br />
techniques are applied for non-quoted periods to achieve the most relevant forward curve. In addition, when deemed<br />
appropriate, correlation techniques between commodities are applied. Options are revalued using appropriate option pricing<br />
models and credit spreads are applied where deemed to be significant.
F16<br />
FINANCIAL STATEMENTS<br />
Note 3 - Basis of presentation and measurement of fair value<br />
Embedded derivatives<br />
<strong>Hydro</strong> measures embedded derivatives that are separated (i.e. bifurcated) from the host contract by comparing the forward<br />
curve at contract inception to the forward curve as of the balance sheet date. Changes in the present value of the cash flows<br />
related to the embedded derivative are recognized in the balance sheet and in the income statement. Forward curves are<br />
established as described above under Derivatives. For contracts that contain embedded caps or floors, Asian option valuation<br />
models are used.<br />
Note 4 - Critical accounting judgment and key sources of estimation uncertainty<br />
The application of accounting policies require that management make estimates and judgments in determining certain<br />
revenues, expenses, assets, and liabilities. The following accounting policies represent areas that are considered more critical,<br />
involving a higher degree of judgment and complexity.<br />
Impairment of non-current assets<br />
IAS 36 requires that <strong>Hydro</strong> assess conditions that could cause an asset to become impaired and to test recoverability of<br />
potentially impaired assets. These conditions include significant decrease in the market value of the asset, changes in <strong>Hydro</strong>'s<br />
business plan for the asset or a significant adverse change in the business and legal climate. Each Cash Generating Unit (CGU)<br />
or individual asset is reviewed for impairment indicators. Most of <strong>Hydro</strong>'s assets are assigned to CGUs, which is the lowest<br />
level where largely independent cash flows are deemed to exist. The identification of CGUs involves judgment, including<br />
assessment of where active markets exist, and the level of interdependency of cash inflows. For <strong>Hydro</strong>, the CGU is usually the<br />
individual plant, unless the asset or asset group is an integral part of a value chain where no independent prices for the<br />
intermediate products exist, a group of plants is combined and managed to serve a common market, or where circumstances<br />
otherwise indicate significant interdependencies.<br />
If a loss in value is indicated, the recoverable amount is estimated as the higher of the asset or CGU's fair value less cost to sell,<br />
or its value in use. Directly observable market prices rarely exist for our assets, however, fair value may be estimated based on<br />
recent transactions on comparable assets, bids or other discussions of potential transactions involving the asset, or internal<br />
models used by <strong>Hydro</strong> for transactions involving the same type of assets. Calculation of value in use is a discounted cash flow<br />
calculation based on continued use of the assets in its present condition, excluding potential exploitation of improvement or<br />
expansion potential.<br />
Determination of the recoverable amount involves management estimates on highly uncertain matters, such as commodity<br />
prices and their impact on markets and prices for upgraded products, development in demand, inflation and operating<br />
expenses, and technology changes. We use internal business plans, quoted forward prices and our best estimate of commodity<br />
prices, currency rates, discount rates and other relevant information. In periods when observed prices in the market are<br />
considered inconsistent because they over time render either exceptionally positive cash flows or consistently negative cash flows<br />
for a majority of market participants over time, adjustments in the mid to long term prices are made in order to reflect <strong>Hydro</strong>'s<br />
current expectations of net cash flows. A detailed forecast is developed for a period of three to five years with projections<br />
thereafter. <strong>Hydro</strong> does not include a general growth factor above inflation to volumes or cash flows for the purpose of<br />
impairment tests, however, market recovery towards previously observed levels is considered. Estimated cash flows are<br />
discounted with a risk adjusted discount rate derived as the weighted average cost of capital (WACC) for a similar business in<br />
the same business environment. For <strong>Hydro</strong>'s businesses the pre tax nominal discount rate is estimated at between 9 and 12<br />
percent (2010: 8.75-13.5 percent). The variance in discount rates mainly results from differences in risk free interest rates and<br />
tax levels in different regions. For further information about impairment tests, see note 13 Impairment of non-current assets.<br />
Financial instruments<br />
Certain commodity contracts are deemed to be financial instruments under IAS 39 or to contain embedded derivatives which<br />
are required to be recognized at fair value, with subsequent changes in fair value impacting the income statement. Determining<br />
whether contracts qualify as financial instruments at fair value involves evaluation of markets, <strong>Hydro</strong>'s use of those instruments<br />
and historic or planned use of physically delivered products under such contracts. Determining whether embedded derivatives<br />
are required to be separated and accounted for at fair value involve assessing price correlations and normal market pricing<br />
mechanisms for relevant products and market places. Where no directly observable market prices exist, fair value is estimated<br />
through valuation models which rely on internal assumptions as well as observable market information such as forward curves,<br />
yield curves and interest rates. Market stability impacts the reliability of observed prices and other market information, and<br />
consequently, the extent of judgment necessary to estimate appropriate market prices for valuation purposes. Volatility also
FINANCIAL STATEMENTS<br />
Note 4 - Critical accounting judgment and key sources of estimation uncertainty F17<br />
impacts the magnitude of changes in estimated fair value, which can be substantial, in particular on long-term contracts.<br />
Historically, financial and commodity markets have been highly volatile.<br />
Employee retirement plans<br />
<strong>Hydro</strong> provides both defined benefit employee retirement plans and defined contribution plans. A declining, but still<br />
significant share is defined benefit plans. Measurement of pension cost and obligations under such plans require numerous<br />
assumptions and estimates that can have a significant impact on the recognized pension cost and obligation, such as future<br />
salary levels, discount rates, turnover rate, and the rate of return on plan assets.<br />
The discount rate is based on the yield from a portfolio of long-term debt instruments. <strong>Hydro</strong> provides defined benefit plans in<br />
several countries and in various economic environments that affects the actual discount rate applied. Around 70 percent of<br />
<strong>Hydro</strong>'s projected benefit obligation (PBO) relates to Norway. The discount rate applied for Norwegian plans as of December<br />
31, 2011 was 2.5 percent, based on government bond yield as required by IAS 19 Employee Benefits. The discount rates<br />
applied in Germany and the UK are based on high quality corporate bonds, which are available in those markets. <strong>Hydro</strong>'s<br />
weighted average discount rates used are 4.9 percent for the main German plans and 4.7 percent for the main UK plans.<br />
<strong>Hydro</strong>'s weighted average discount rate declined by 0.9 percentage points in 2011 due to decreased interest levels. Around 85<br />
percent of plan assets relates to Norway. The expected rate of return on plan assets is determined to be approximately 1.5<br />
percentage points above the yield on government bonds in Norway. Assumptions for salary increase in the remaining service<br />
period for active plan participants are based on expected salary increases for each country or economic area. <strong>Hydro</strong> expects a<br />
somewhat lower salary increase for our Norwegian activities compared to the average development in Norway, based on the<br />
challenged profitability and international competition in our industry.<br />
Changes in these assumptions can influence the funded status of the plan as well as the net periodic pension cost. <strong>Hydro</strong><br />
incurred an actuarial loss of NOK 1,817 million for the year, mainly resulting from reduced discount rates. Actual return on<br />
plan assets was NOK 292 million below the estimated return for the year. The PBO is sensitive to changes in assumed discount<br />
rates and assumed compensation rates. Based on indicative sensitivities calculated for the Norwegian plans, a 0.5 percentage<br />
point reduction or increase in the discount rate will increase or decrease the PBO in the range of 8 percent, for 2011 this is<br />
around NOK 1.6 billion. A 0.5 percentage point reduction or increase in compensation rates for all plan member categories in<br />
Norway will also decrease or increase the PBO in the range of 8 percent. The PBO is also sensitive to demographic<br />
assumptions. An indicative sensitivity for change in mortality assumptions indicates that a one year increase in expected life for<br />
each plan member increases the PBO with around 5 percent, for 2011 around NOK 1.0 billion. Changes in the<br />
aforementioned parameters and changes in the PBO will affect net periodic pension cost in subsequent periods, both the<br />
service cost and interest cost components, in addition to the amortization of any unrecognized net gains or losses.<br />
Business combinations and goodwill<br />
In a business combination consideration, assets and liabilities are recognized at fair value, and any excess purchase price<br />
included in goodwill. Where <strong>Hydro</strong> had an existing ownership interest in the acquiree that interest is also reassessed to<br />
determine its acquisition date estimated fair value, resulting in the acquisition date gain or loss. In the businesses <strong>Hydro</strong><br />
operates, fair values of individual assets and liabilities are normally not readily observable in active markets. This requires the<br />
use of valuation models to estimate the fair value of acquired assets and liabilities. Such valuations are subject to numerous<br />
assumptions including the useful lives of assets, replacement costs and the timing and amounts of certain future cash flows,<br />
which may be dependent on future commodity prices, currency rates, discount rates and other factors.<br />
In accordance with IAS 36, goodwill and certain intangible assets are reviewed at least annually for impairment. See discussion<br />
above about impairment of non-current assets relating to the determination of a CGU and valuation principles and<br />
methodologies.<br />
Contingencies, uncertain liabilities and environmental liabilities<br />
Liabilities that are uncertain in timing or amount are recognized when a liability arises from a past event and an outflow of cash<br />
or other resources is probable and can be reasonably estimated. Contingent liabilities are possible obligations where a future<br />
event will determine whether <strong>Hydro</strong> will be required to make a payment to settle the liability, or where the size of the payment<br />
cannot be determined reliably. Contingent liabilities are disclosed unless a future payment is considered remote. Evaluation of<br />
uncertain liabilities and contingencies requires judgment and assumptions regarding the probability of realization and the<br />
timing and amount or range of amounts that may ultimately be incurred. Such estimates may vary from the ultimate outcome<br />
as a result of differing interpretations of laws and the assessment of damages. Environmental liabilities and asset retirement
F18<br />
FINANCIAL STATEMENTS<br />
Note 4 - Critical accounting judgment and key sources of estimation uncertainty<br />
obligations require interpretation of scientific and legal data, in addition to assumptions about probability and future costs. A<br />
description of <strong>Hydro</strong>'s major contingencies is included in note 38 Contingent liabilities and contingent assets.<br />
Insurance and other compensation<br />
<strong>Hydro</strong> has insurance contracts and certain other arrangements giving right to compensation for damage and/or losses.<br />
Compensation claims are recognized when it is deemed to be virtually certain that <strong>Hydro</strong> will receive a compensation under<br />
the contract. Such determination requires detailed analysis of the legal basis for the claim; any contingencies that are or may be<br />
raised by the liable party; evaluation of assessment from technical, legal or other third party experts; and other relevant<br />
information. To recognize such claims <strong>Hydro</strong> normally expect to have received either a confirmation from the liable party that<br />
the claim is valid and will be honored, or a confirmation from an external expert that <strong>Hydro</strong> has a valid claim with no or<br />
remote risk of not being honored. The claim is measured at <strong>Hydro</strong>'s best estimate of the amount to be received.<br />
Income tax<br />
<strong>Hydro</strong> calculates income tax expense based on reported income in the different legal entities. Deferred income tax expense is<br />
calculated based on the differences between the carrying value of assets and liabilities for financial reporting purposes and their<br />
respective tax basis that are considered temporary in nature. Valuation of deferred tax assets is dependent on management's<br />
assessment of future recoverability of the deferred benefit. Expected recoverability may result from expected taxable income in<br />
the future, planned transactions or planned tax optimizing measures. Economic conditions may change and lead to a different<br />
conclusion regarding recoverability. Tax authorities in different jurisdictions may challenge <strong>Hydro</strong>'s calculation of taxes payable<br />
from prior periods. Such processes may lead to changes to prior periods' taxable income, resulting in changes to income tax<br />
expense in the period of change.<br />
Note 5 - Acquisitions<br />
On February 28, 2011 <strong>Hydro</strong> acquired the majority of Vale S.A.'s aluminium business. Vale Aluminium included the<br />
following equity interests all of which are located in the state of Pará:<br />
57 percent of the shares in the alumina refinery Alunorte - Alumina do Norte do Brasil S.A. (Alunorte), increasing<br />
<strong>Hydro</strong>'s ownership interest from 34 percent to 91 percent<br />
60 percent ownership interest in the bauxite mine Paragominas with the right and obligation to acquire the remaining 40<br />
percent ownership within a period of five years from completion of the acquisition. The put and call arrangements are at a<br />
fixed price and effectively transfer the majority of the economic exposure to <strong>Hydro</strong>, and is thus accounted for as a<br />
purchase of the remaining shares with deferred payment.<br />
51 percent ownership in the aluminium smelter Albras - Aluminio Brasileiro S.A. (Albras)<br />
61 percent ownership in Companhia de Alumina do Pará S.A. (CAP), an alumina refinery under evaluation for<br />
development, increasing <strong>Hydro</strong> ownership interest from 20 percent to 81 percent.<br />
In addition, <strong>Hydro</strong> acquired certain commercial contracts related to sale of alumina and aluminium. The acquired business was<br />
consolidated as of the acquisition date and has improved <strong>Hydro</strong>'s access to bauxite and alumina, the main raw materials for<br />
production of aluminium.<br />
The fair value of consideration for the ownership interests as of the acquisition date was as follows:<br />
Amounts in NOK million<br />
Consideration shares (22%) 19 987<br />
Cash consideration 6 193<br />
Deferred cash payment 1 541<br />
Cost of acquired shares 27 721<br />
Fair value of previously held shares in Alunorte and CAP 9 162<br />
Fair value of <strong>Hydro</strong>'s interests as of the business combination 36 883<br />
Consideration paid on closing consisted of approximately USD 1.1 billion in cash later reduced by approximately NOK 95<br />
million following agreed procedures in establishing closing accounts. The consideration also included 447,834,465 shares<br />
corresponding to 22 percent of <strong>Hydro</strong>'s outstanding shares, valued at the price at Oslo Børs (Oslo Stock Exchange) as of the<br />
end of trading Friday February 25, the latest market observation prior to completion of the transaction. In addition, the<br />
consideration includes the deferred payment for the remaining 40 percent in Paragominas described above and certain<br />
contingent compensation arrangements. Vale has given certain representations and warranties primarily related to tax issues
which result in recognition of indemnification assets of approximately NOK 150 million. The fair value of <strong>Hydro</strong>'s previous<br />
ownership interests in Alunorte and CAP is part of the initial recognition of the acquired entities. A remeasurement gain of<br />
NOK 4,222 million was recognized in Other income, net.<br />
The values of assets acquired and liabilities assumed are included in the table below:<br />
Amounts in NOK million<br />
FINANCIAL STATEMENTS<br />
Note 5 - Acquisitions F19<br />
Cash and cash equivalents 347<br />
Shortterm investments 188<br />
Receivables 1 297<br />
Other current assets 389<br />
Inventories 2 177<br />
Total current assets 4 398<br />
Property, plant and equipment 43 439<br />
Other noncurrent assets 4 950<br />
Intangible assets excluding goodwill 3 043<br />
Goodwill 3 499<br />
Total noncurrent assets 54 930<br />
Bank loans and other interst bearing shortterm debt 2 086<br />
Other current liabilities 1 732<br />
Total current liabilities 3 818<br />
Longterm debt 4 818<br />
Other longterm liabilities 1 998<br />
Deferred tax liabilities 5 341<br />
Total noncurrent liabilities 12 157<br />
Minority interests 6 470<br />
Fair value of <strong>Hydro</strong>'s interests as of the business combination 36 883<br />
The majority of receivables were towards shareholders related to their right and obligation to purchase products from the<br />
entities. Receivables have been collected.<br />
<strong>Hydro</strong> has elected to utilize the option to measure non-controlling interests (minority interests) at their proportionate share of<br />
the acquiree's identifiable net assets. Minority interests are recognized with NOK 4,154 million related to the 49 percent<br />
minority in Albras, with NOK 2,200 million related to the 9 percent minority in Alunorte and with NOK 116 million related<br />
to the 19 percent minority in CAP. Goodwill is measured at NOK 3,499 million. Goodwill is allocated to one cash generating<br />
unit in Bauxite & Alumina. The main reasons for identification of goodwill are synergies in the common location of plants and<br />
mine and the difference between nominal value and fair value of deferred tax. No amount of goodwill is expected to be<br />
deductible for tax purposes.<br />
<strong>Hydro</strong> had existing contracts and balances with Vale Aluminium, primarily an off-take arrangement for alumina as part of the<br />
equity investment in Alunorte including related payables, receivables and loans. In addition, the acquiree held certain long-term<br />
sales contracts with <strong>Hydro</strong>. The fair value of the contracts has been determined to be a liability for the acquiree because the<br />
contract terms were below market value at the time of acquisition. The difference was accounted for as settlement of a preexisting<br />
relationship resulting in a credit to Other income, net, of NOK 267 million. In addition, an existing loan to Alunorte<br />
at below market interest was accounted for as settlement of a pre-existing loan resulting in a charge of NOK 68 million<br />
included in Other income, net. These amounts have been excluded from the purchase price and purchase accounting.<br />
Acquisition related costs incurred during 2011 were approximately NOK 20 million, in total for the transaction approximately<br />
NOK 90 million, included in operating costs.<br />
Results of the acquired businesses are included in <strong>Hydro</strong>'s consolidated income statement as of February 28, 2011. The<br />
acquired businesses are an integral part of <strong>Hydro</strong>'s operations and are not reported separately. The acquired businesses<br />
contributed about NOK 11,500 million to the group's revenue in the period after acquisition, and about NOK 330 million to<br />
EBIT.
F20<br />
FINANCIAL STATEMENTS<br />
Note 5 - Acquisitions<br />
The following information represents unaudited pro forma financial information as if the acquisition was completed as of the<br />
beginning of 2011 based on <strong>Hydro</strong>'s actual financial statements as of December 31, 2011. As Vale Aluminium has not been<br />
incorporated or reported as a separate reporting entity, separate financial information does not exist for the acquired entities.<br />
This pro forma financial information is, for the period prior to the acquisition, based on financial information for the separate<br />
entities acquired, and carve-out condensed financial information derived from Vale's financial reporting records, provided by<br />
Vale for illustrative purposes. The financial information for Vale Aluminium has been translated to NOK using the average<br />
exchange rate for the period. Pro forma information is based on actual transactions completed by <strong>Hydro</strong> and Vale, which may<br />
have been different had the acquisition been completed at an earlier time. Pro forma information has been prepared for<br />
information purposes only, and is not intended to indicate what the results of operations would have been if the transaction<br />
had occurred at the beginning of 2011.<br />
Amounts in NOK million 2011<br />
Revenue 93 121<br />
Earnings before financial items and tax (EBIT) 5 576<br />
Net income 2 519<br />
Net income attributable to minority interests 76<br />
Net income attributable to <strong>Hydro</strong> shareholders 2 444<br />
<strong>Hydro</strong> issued an Information Memorandum dated June 2, 2010 describing the acquisition, and a Prospectus dated June 21,<br />
2010 for the rights issue in July 2010 and the private placement to Vale in connection with the agreement for sale and<br />
contribution of Vale Aluminium. Both documents contain more detailed information about the transactions, and are available<br />
at www.hydro.com.<br />
<strong>Hydro</strong> has not entered into any other significant business combinations during 2011 or 2010.<br />
Note 6 - Financial and commercial risk management<br />
<strong>Hydro</strong> is exposed to market risks from fluctuations in the price of commodities bought and sold, prices of other raw materials,<br />
currency exchange rates and interest rates. Price volatility, which may be significant, can have a substantial impact on <strong>Hydro</strong>'s<br />
results. Market risk exposures are evaluated based on a holistic approach in order to take advantage of offsetting positions and<br />
to manage risk on a net exposure basis. Natural hedging positions are established where possible and economically viable.<br />
<strong>Hydro</strong> uses financial derivatives to some extent to manage financial and commercial risk exposures. <strong>Hydro</strong>'s market risk<br />
strategy is materially unchanged in 2011 compared to previous years.<br />
Commodity price risk exposure<br />
Aluminium<br />
<strong>Hydro</strong> produces primary aluminium and fabricated aluminium products including remelting. <strong>Hydro</strong> also engages in sourcing<br />
and trading activities to procure raw materials and primary aluminium for internal use and for resale to external customers.<br />
These activities serve to optimize capacity utilization, reduce logistical costs and strengthen our market positions.<br />
<strong>Hydro</strong> enters into future contracts with the London Metal Exchange (LME) mainly for two purposes. The first is to achieve an<br />
average LME aluminium price on smelter production, matching the average customer pricing. Second, because <strong>Hydro</strong>'s<br />
downstream business, remelting, and the sale of third party products are based on margins above the LME price, <strong>Hydro</strong> hedges<br />
metal prices when entering into customer and supplier contracts with corresponding physical or derivative future contracts at<br />
fixed prices (back-to-back hedging). The majority of these contracts mature within one year. <strong>Hydro</strong> manages these risk<br />
management activities on a portfolio basis, taking external LME positions based upon net exposures within given limits.<br />
Aluminium price volatility can result in significant fluctuations in earnings as the derivative positions are marked to their<br />
market value with changes to market value recognized in the income statement, while the underlying physical transactions<br />
normally are not marked-to-market, except for those included in trading portfolios.<br />
In order to secure cash flow or margins for specific projects or special circumstances, <strong>Hydro</strong> might enter into future contracts<br />
on a longer-term basis. In these cases, hedge accounting has normally been applied. See the section on cash flow hedges in note<br />
41 Derivative instruments and hedge accounting.
FINANCIAL STATEMENTS<br />
Note 6 - Financial and commercial risk management F21<br />
Bauxite and alumina<br />
<strong>Hydro</strong> produces more alumina than is consumed in its primary aluminium production. In addition, <strong>Hydro</strong> has entered into<br />
long-term agreements to purchase alumina from third parties. The majority of purchase and sale of alumina are under contracts<br />
where the price is linked to the LME aluminium price.<br />
<strong>Hydro</strong> is a producer and consumer of bauxite. <strong>Hydro</strong>'s usage needs for bauxite are secured through long-term contracts as well<br />
as by own production. The purchasing contracts have links to the LME aluminium price and to alumina indexes. The risk<br />
associated with aluminium price links in contracts for bauxite and alumina is managed together with the market risk arising<br />
from changes in the aluminium price discussed above.<br />
Electricity<br />
<strong>Hydro</strong> is a large power consumer with a significant power production. <strong>Hydro</strong>'s consumption is mainly secured through longterm<br />
contracts with power suppliers and through <strong>Hydro</strong>'s own production in Norway. <strong>Hydro</strong>'s own production is influenced<br />
by hydrological conditions which can vary significantly. The net power position in Norway is balanced out in the Nordic<br />
power market. In order to manage and mitigate risks related to price and volume fluctuations, <strong>Hydro</strong> utilizes physical contracts<br />
and derivatives including future contracts, forwards and options. <strong>Hydro</strong> also participates in trading activities within strict<br />
volume and risk limits.<br />
A significant part of <strong>Hydro</strong>'s power purchase contracts are linked to aluminium prices in order to mitigate market price risk<br />
related to the sales of its aluminium products. These contract elements are bifurcated from their host contracts and accounted<br />
for as derivatives.<br />
Other raw materials<br />
<strong>Hydro</strong> is party to both long-term and short-term sourcing agreements for a range of raw materials and services both fixed and<br />
variable prices. Such agreements include pitch, petroleum coke, caustic, natural gas, coal, fuel oil and freight. The number of<br />
purchasing agreements with prices linked to the price of other commodities such as aluminium is limited and the fair value<br />
exposure is considered to be immaterial.<br />
Foreign currency risk exposure<br />
The prices of <strong>Hydro</strong>'s upstream products bauxite, alumina and primary aluminium, are denominated in US dollars. Margins<br />
for mid- and downstream products are mainly priced in US dollars and Euro. Further, the prices of major raw materials used in<br />
<strong>Hydro</strong>'s production processes, are quoted in US dollars in the international commodity markets. <strong>Hydro</strong> also incurs local costs<br />
related to the production, distribution and marketing of products in a number of different currencies, mainly Norwegian<br />
Krone, Brazilian Real, Euro, US dollar, Australian dollar and Canadian dollar. With the acquisition of Vale Aluminium<br />
<strong>Hydro</strong>'s exposure to Brazilian Real fluctuations has increased significantly as a large share of the local production cost is<br />
denominated in Brazilian Real.<br />
<strong>Hydro</strong>'s primary underlying foreign currency risk is linked to fluctuations in the value of the US dollar versus the currencies in<br />
which significant costs are incurred. In addition, <strong>Hydro</strong>'s results and equity are influenced by value changes for the functional<br />
currencies of the individual entities and the Norwegian Krone as the Group's presentation currency.<br />
To mitigate the US dollar exposure, <strong>Hydro</strong>'s policy is to raise funding in US dollar. The relationship between the primary<br />
aluminium price development and the currencies in which major costs are incurred acts as an additional natural protection to a<br />
certain extent. To reduce the effects of fluctuations in the US dollar and other exchange rates, <strong>Hydro</strong> has also used foreign<br />
currency swaps and forward currency contracts. Currently, there are no material amounts outstanding under such contracts.<br />
Interest rate exposure<br />
<strong>Hydro</strong> is exposed to changes in interest rates, primarily as a result of financing its business operations and managing its<br />
liquidity in different currencies. <strong>Hydro</strong>'s interest rate exposure has increased with the US dollar debt incurred as part of the<br />
Vale Aluminium acquisition. Cash and other liquid resources are currently mainly held in Norwegian Krone and US dollars,<br />
whereas debt is mainly US dollar denominated. The corresponding interest rate exposures are consequently related to<br />
Norwegian Krone and US dollar short-term rates.<br />
<strong>Hydro</strong> has an exposure to interest rate fluctuations on part of the debt in its equity accounted investments. This is mainly<br />
related to US dollar denominated debt in Qatalum. See note 35 Capital management for additional information.
F22<br />
FINANCIAL STATEMENTS<br />
Note 6 - Financial and commercial risk management<br />
The fair value of interest rate derivatives as of December 31, 2011 and 2010 is immaterial and not presented here.<br />
Financial instruments and provisions are also exposed to changes in interest rates in connection with discounting of positions to<br />
net present value. See sensitivity analysis of financial instruments below.<br />
Sensitivity analysis<br />
In accordance with IFRS, requirements <strong>Hydro</strong> has chosen to provide information about market risk and potential exposure to<br />
hypothetical loss from its use of derivative financial instruments and other financial instruments and derivative commodity<br />
instruments through sensitivity analysis disclosures. The sensitivity analysis depicted in the tables below reflects the<br />
hypothetical gain/loss in fair values that would occur assuming a 10 percent increase in rates or prices and no changes in the<br />
portfolio of instruments as of December 31, 2011 and December 31, 2010, respectively. Effects shown below are largely also<br />
representative of reductions in rates or prices by 10 percent but with the opposite sign convention. Only effects that would<br />
ultimately be accounted for in profit and loss, or equity, as a result of a change in rates or prices are included. All changes are<br />
before tax.<br />
Interest<br />
Amounts in NOK million 2011 1)<br />
Gain/loss from 10 percent increase in<br />
Fair value as of<br />
December 31, Foreign currency exchange rates Commodity prices<br />
USD EUR Other Aluminium Other rates Other<br />
Derivative financial instruments 2)<br />
Other financial instruments 3)<br />
Derivative commodity instruments 4)<br />
Financial instruments directly to equity 5)<br />
27 (75) (20) <br />
7 890 (572) 285 79 (9) 41<br />
(1 157) (490) 1 3 (233) (266) (13) 4<br />
1 052 421 3 3 231 (42) <br />
Interest<br />
Amounts in NOK million 2010 1)<br />
Gain/loss from 10 percent increase in<br />
Fair value as of<br />
December 31, Foreign currency exchange rates Commodity prices<br />
USD EUR Other Aluminium Other rates Other<br />
Derivative financial instruments 2)<br />
Other financial instruments 3)<br />
Derivative commodity instruments 4)<br />
Financial instruments directly to equity 5)<br />
11 86 (29) <br />
19 564 727 347 58 (14) 38<br />
(2 156) (558) (12) (1) (905) (294) 42 (29)<br />
1 455 108 2 1 (276) (87) <br />
1) The change in fair value due to price changes is calculated based on pricing formulas for certain derivatives, the Black-Scholes/Turnbull-Wakeman models<br />
for options and the net present value of cash flows for certain financial instruments or derivatives. Discount rates vary as appropriate for the individual<br />
instruments.<br />
2) Includes mainly forward currency contracts.<br />
3) Includes cash and cash equivalents, investments in marketable securities, bank loans and other interest-bearing short-term debt and long-term debt.<br />
Trade payables and trade receivables are also included.<br />
4) Includes all contracts with commodities as underlying, both financial and physical contracts, such as LME contracts and NASDAQ OMS Commodities<br />
Europe contracts, which are accounted for at fair value.<br />
5) Includes shares classified as available-for-sale and commodity hedging derivatives.<br />
<strong>Hydro</strong>'s management emphasizes that the above sensitivity analysis contains material limitations due to the necessarily<br />
simplified assumptions including:<br />
Include only the effects of the derivative instruments discussed above and of certain financial instruments (see footnotes<br />
in the table above) which excludes all related offsetting physical positions, contracts, and anticipated transactions.<br />
No adjustments for potential correlations between the risk exposure categories, such as the effect of a change in a foreign<br />
exchange rate on a commodity price.<br />
The unlikely assumption that all rates or prices simultaneously move in directions that would have negative/positive<br />
effects on <strong>Hydro</strong>'s portfolio of instruments.<br />
The above discussion about <strong>Hydro</strong>'s risk management policies and the estimated amounts included in the sensitivity analysis<br />
relate to the balance sheet position as of December 31. Outcomes could differ materially based on actual developments in the<br />
global markets. The methods used by <strong>Hydro</strong> to analyze risks discussed above should not be considered projections of future<br />
events, gains or losses.
FINANCIAL STATEMENTS<br />
Note 6 - Financial and commercial risk management F23<br />
Credit risk management<br />
<strong>Hydro</strong> manages credit risk by setting counterparty risk limits and establishing procedures for monitoring exposures and timely<br />
settlement of customer accounts. <strong>Hydro</strong> is also monitoring the financial performance of key suppliers in order to reduce the<br />
risk of default on operations and key projects. Our overall credit risk exposure is reduced due to a diversified customer base<br />
representing various industries and geographic areas. Enforceable netting agreements, guarantees, and credit insurance, also<br />
contribute to a lower credit risk.<br />
Credit risk arising from derivatives is generally limited to net exposures. Exposure limits are established for financial institutions<br />
relating to current accounts, deposits and other obligations. Credit risk related to commodity derivatives is limited by<br />
settlement through commodity exchanges. Current counterparty risk related to the use of derivative instruments and financial<br />
operations is considered limited.<br />
Liquidity risk<br />
Volatile commodity prices and exchange rates as well as fluctuation business volumes and inventory levels can have a<br />
substantial effect on <strong>Hydro</strong>'s cash positions and borrowing requirements.<br />
To fund cash deficits of a more permanent nature <strong>Hydro</strong> will normally raise long-term bond or bank debt in available markets.<br />
<strong>Hydro</strong> has entered into agreements with banks for a stand-by credit facility of USD 1.7 billion maturing in 2014. This facility<br />
was undrawn at year-end 2011. A revolving EUR 750 million credit facility maturing in 2012 was canceled in 2011.<br />
<strong>Hydro</strong> has obtained bank guarantees to cover daily settlements for positions held toward electricity or commodity exchanges.<br />
Repayments of long-term debt are disclosed in note 30 Long-term debt. Further, all other financial liabilities, such as trade<br />
payables, with the exception of derivatives, have a final maturity date within one year. An overview of estimated gross cash<br />
flows from derivatives accounted for as liabilities and assets is presented below. Many of these assets and liabilities are offset by<br />
cash flows from contracts not accounted for as derivatives.<br />
Expected gross cash flow from derivatives accounted for as financial liabilities and financial assets, respectively, as of end of<br />
year:<br />
December 31, 2011 December 31, 2010<br />
Amounts in NOK million Liabilities Assets Liabilities Assets<br />
2011 (3 680) 3 849<br />
2012 (711) 741 (92) 281<br />
2013 (52) 63 38<br />
2014 2 11<br />
Total (763) 806 (3 772) 4 179<br />
The cash-flows above are to a large extent subject to enforceable netting agreements reducing <strong>Hydro</strong>'s exposure substantially.<br />
For additional information on contracts accounted for at fair value, see note 41 Derivative instruments and hedge accounting.<br />
Note 7 - Operating and geographic segment information<br />
<strong>Hydro</strong> identifies its reportable segments and discloses segment information under IFRS 8 Operating Segments which requires<br />
<strong>Hydro</strong> to identify its segments according to the organization and reporting structure used by management. Operating segments<br />
are components of a business that are evaluated regularly by the chief operating decision maker for the purpose of assessing<br />
performance and allocating resources. <strong>Hydro</strong>'s chief operating decision maker is the President and CEO. Generally, financial<br />
information is required to be disclosed on the same basis that is used by the CEO.<br />
<strong>Hydro</strong>'s operating segments represent separately managed business areas with unique products serving different markets.<br />
<strong>Hydro</strong>'s reportable segments are the six business areas Bauxite & Alumina, Primary Metal, Metal Markets, Rolled Products,<br />
Extruded Products and Energy.
F24<br />
FINANCIAL STATEMENTS<br />
Note 7 - Operating and geographic segment information<br />
Bauxite & Alumina activities includes bauxite mining activities, production of alumina and related commercial activities,<br />
primarily the sale of alumina.<br />
Primary Metal includes primary aluminium production, remelting and casting activities. The main products are comprised of<br />
extrusion ingots, foundry alloys and sheet ingot.<br />
Metal Markets includes all sales activities relating to products from our primary metal plants and operational responsibility for<br />
<strong>Hydro</strong>'s stand-alone remelters as well as physical and financial metal trading activities.<br />
Rolled Products includes <strong>Hydro</strong>'s rolling mills. The main products are comprised of aluminium foil, strip, sheet, and<br />
lithographic plate for application in such sectors as packaging, automotive and transport industries, as well as for offset printing<br />
plates.<br />
Extruded Products includes <strong>Hydro</strong>'s extrusion-based businesses. The main products are aluminium extrusion and semifabricated<br />
products for the building and construction, transportation and engineered products industrial sectors.<br />
Energy includes operating and commercial responsibility for <strong>Hydro</strong>'s power stations in Norway and energy sourcing for<br />
<strong>Hydro</strong>'s world-wide aluminium operations.<br />
Other consist of <strong>Hydro</strong>'s investments in the Solar Industry, its captive insurance company Industriforsikring, <strong>Hydro</strong>'s industry<br />
parks, internal service providers and certain other activities.<br />
<strong>Hydro</strong>'s segment structure was changed as of February 28, 2011. The financial information in this report is restated to reflect<br />
the current segment structure.<br />
Operating segment information<br />
<strong>Hydro</strong> uses two measures of segment results, Earnings before financial items and tax - EBIT and EBITDA. EBIT is consistent<br />
with the same measure for the group, considering the principles for measuring certain intersegment transactions and contracts<br />
described below. <strong>Hydro</strong> defines EBITDA as Income (loss) before tax, financial income and expense, depreciation, amortization<br />
and write-downs, including amortization and impairment of excess values in equity accounted investments. <strong>Hydro</strong>'s definition<br />
of EBITDA may be different from other companies.<br />
Because <strong>Hydro</strong> manages long-term debt and taxes on a Group basis, Net income is presented only for the Group as a whole.<br />
Intersegment sales and transfers reflect arm's length prices as if sold or transferred to third parties at the time of inception of the<br />
internal contract, which may cover several years. Transfers of businesses or assets within or between <strong>Hydro</strong>'s segments are<br />
reported without recognizing gains or losses. Results of activities not considered part of <strong>Hydro</strong>'s main operations as well as<br />
unallocated revenues, expenses, liabilities and assets are reported together with Other under the caption Other and<br />
eliminations.<br />
The accounting policies used for segment reporting reflect those used for the Group with the following exceptions: Internal<br />
commodity contracts may meet the definition of a financial instrument in IAS 39 or contain embedded derivatives that are<br />
required to be bifurcated and valued at fair value under IAS 39. However, <strong>Hydro</strong> considers these contracts as sourcing of raw<br />
materials or sale of own production, and accounts for such contracts as executory contracts. Certain other internal contracts<br />
may contain lease arrangements that qualify as a capital lease. However, the segment reporting reflects the responsibility<br />
allocated by <strong>Hydro</strong>'s management for those assets. Costs related to certain pension schemes covering more than one segment<br />
are allocated to the operating segments based either on the premium charged or the estimated service cost. Any difference<br />
between these charges and pension expenses measured in accordance with IFRS, as well as pension assets and liabilities are<br />
included in Other and eliminations.<br />
The following tables include information about <strong>Hydro</strong>'s operating segments.
External revenue Internal revenue<br />
Total revenue<br />
Amounts in NOK million 2011 2010 2011 2010 2011 2010<br />
Bauxite & Alumina 8 595 3 364 5 876 4 518 14 471 7 882<br />
Primary Metal 4 462 1 603 30 258 25 988 34 720 27 592<br />
Metal Markets 33 363 27 090 15 362 15 911 48 725 43 001<br />
Rolled Products 21 392 20 611 (95) 569 21 297 21 180<br />
Extruded Products 19 944 19 225 140 180 20 085 19 405<br />
Energy 3 424 3 448 2 969 3 607 6 393 7 055<br />
Other and eliminations 1)<br />
264 414 (54 510) (50 774) (54 246) (50 360)<br />
Total 91 444 75 754 91 444 75 754<br />
Other income, net<br />
Share of the profit (loss) in<br />
equity accounted<br />
investments 2)<br />
Depreciation, amortization<br />
and impairment 3)<br />
Amounts in NOK million 2011 2010 2011 2010 2011 2010<br />
Bauxite & Alumina 4 903 6 177 1 580 2<br />
Primary Metal 43 40 13 (574) 3 136 1 737<br />
Metal Markets 3 10 (4) 101 106<br />
Rolled Products 10 47 (76) (64) 399 398<br />
Extruded Products 75 24 16 13 742 571<br />
Energy 659 15 29 132 118<br />
Other and eliminations 529 448 (235) (182) 69 52<br />
Total 6 222 568 (260) (606) 6 158 2 985<br />
Earnings before financial<br />
items and tax (EBIT) EBITDA<br />
Amounts in NOK million 2011 2010 2011 2010<br />
4)<br />
Bauxite & Alumina 5 846 847 7 438 875<br />
Primary Metal 1 265 615 4 421 2 372<br />
Metal Markets 457 160 557 266<br />
Rolled Products 66 1 214 519 1 668<br />
Extruded Products (240) 426 501 997<br />
Energy 2 550 1 438 2 685 1 561<br />
Other and eliminations 1)<br />
(116) (1 514) 109 (1 395)<br />
Total 9 827 3 184 16 231 6 343<br />
Current assets 5)<br />
FINANCIAL STATEMENTS<br />
Note 7 - Operating and geographic segment information F25<br />
Noncurrent assets Total assets 5)<br />
Amounts in NOK million 2011 2010 2011 2010 2011 2010<br />
Bauxite & Alumina 5 292 1 343 43 603 7 372 48 895 8 714<br />
Primary Metal 9 005 9 218 33 133 24 306 42 138 33 524<br />
Metal Markets 6 915 7 460 1 165 1 402 8 079 8 861<br />
Rolled Products 7 424 7 692 4 636 4 807 12 059 12 500<br />
Extruded Products 5 844 5 556 4 653 5 120 10 497 10 677<br />
Energy 1 015 1 244 5 420 5 875 6 436 7 120<br />
Other and eliminations 2 691 4 304 1 758 3 088 4 449 7 393<br />
Total 38 185 36 817 94 368 51 971 132 554 88 788
F26<br />
FINANCIAL STATEMENTS<br />
Note 7 - Operating and geographic segment information<br />
Investments accounted for<br />
using the equity method<br />
2) 6)<br />
Segment debt 7)<br />
Amounts in NOK million 2011 2010 2011 2010 2011 2010<br />
Bauxite & Alumina 5 757 2 669 1 134 36 865 65<br />
Primary Metal 9 997 9 786 3 167 4 230 9 505 4 900<br />
Metal Markets 22 21 5 242 5 698 103 148<br />
Rolled Products 1 152 1 242 2 869 2 904 435 296<br />
Extruded Products 40 33 3 401 3 761 515 434<br />
Energy 50 385 990 1 038 564 284<br />
Other and eliminations 181 1 425 (3 932) (5 795) 39 105<br />
Total 11 442 18 649 14 406 12 971 48 025 6 231<br />
Total assets Noncurrent assets<br />
Investments 8)<br />
Investments 8)<br />
Amounts in NOK million 2011 2010 2011 2010 2011 2010<br />
Norway 33 466 39 336 16 749 18 127 1 177 1 164<br />
Germany 11 967 11 677 5 048 5 124 393 265<br />
Italy 1 610 1 743 407 520 44 35<br />
Slovakia 1 842 1 938 1 127 1 179 54 51<br />
Spain 1 260 1 608 567 915 31 40<br />
France 1 597 1 551 655 660 87 112<br />
Denmark 632 628 237 260 29 22<br />
Great Britain 648 561 264 237 24 11<br />
Austria 427 420 194 172 32 29<br />
Other 1 857 1 860 1 240 1 181 128 31<br />
Total EU 21 840 21 986 9 739 10 248 822 596<br />
Other Europe 1 302 150 366 8 4 5<br />
Total Europe 56 608 61 472 26 853 28 383 2 003 1 765<br />
USA 2 422 2 450 1 230 1 293 93 77<br />
Canada 1 926 1 952 1 670 1 706 89 166<br />
Brazil 58 008 8 903 53 118 8 551 45 050 72<br />
Other Americas 232 155 117 57 18 11<br />
Qatar 8 852 8 614 8 852 8 614 306 3 529<br />
Other Asia 1 516 1 474 471 448 45 160<br />
Australia and New Zealand 2 984 3 764 2 057 2 918 424 453<br />
Africa 6 6 1 <br />
Total outside Europe 75 946 27 316 67 515 23 588 46 024 4 467<br />
Total 132 554 88 788 94 368 51 971 48 025 6 231<br />
1) Other and eliminations include elimination of unrealized gains and losses on power contracts between Energy and other units in <strong>Hydro</strong> with a gain of NOK<br />
370 million in 2011 and a loss of NOK 637 million in 2010.<br />
2) Share of the profit (loss) in equity accounted investments includes impairment write-downs in the solar activities of NOK 157 million in 2011 and NOK 66<br />
million in 2010.<br />
3) Impairment write-downs for Property, Plant and Equipment by segment are presented in note 13 Impairment of non-current assets.<br />
4) Total segment Earnings before financial items and tax is the same as <strong>Hydro</strong> group's total Earnings before financial items and tax. Financial income and<br />
financial expense are not allocated to the segments. There are no reconciling items between segment Earnings before financial items and tax to <strong>Hydro</strong><br />
Earnings before financial items and tax. Therefore, a separate reconciliation table is not presented.<br />
5) Current assets and total assets exclude internal cash accounts and accounts receivables related to group relief.<br />
6) Investments accounted for using the equity method comprises investments and advances, see note 25 Investments in associates and note 26 Investments<br />
in jointly controlled entities.<br />
7) Segment debt is defined as short-term interest free liabilities excluding income tax payable.<br />
8) Additions to property, plant and equipment plus long-term securities, intangible assets, long-term advances and investments in equity accounted<br />
investments. Investments 2011 include investments related to the acquisition of Vale Aluminium with NOK 35,321 million for Bauxite & Alumina and NOK<br />
8,055 million for Primary Metal.
Revenue<br />
Amounts in NOK million 2011 2010<br />
Norway 4 739 4 840<br />
Germany 14 003 12 740<br />
Great Britain 5 103 3 567<br />
Italy 4 990 5 297<br />
France 4 823 4 514<br />
Spain 3 279 3 865<br />
Poland 2 372 1 961<br />
The Netherlands 1 914 1 693<br />
Austria 1 887 1 489<br />
Other 7 707 7 627<br />
Total EU 46 078 42 754<br />
Switzerland 8 491 4 070<br />
Other Europe 3 135 3 447<br />
Total Europe 62 442 55 110<br />
USA 8 102 6 592<br />
Canada 309 34<br />
Other Americas 3 087 2 097<br />
Asia 15 935 10 489<br />
Australia and New Zealand 1 140 1 144<br />
Africa 429 288<br />
Total outside Europe 29 002 20 644<br />
Total 91 444 75 754<br />
The identification of assets, long-lived assets and investments is based upon location of operation. Included in long-lived assets<br />
are investments in equity accounted investments; property, plant and equipment (net of accumulated depreciation) and noncurrent<br />
financial assets.<br />
Operating revenues are identified by customer location.<br />
Note 8 - Other income<br />
FINANCIAL STATEMENTS<br />
Note 7 - Operating and geographic segment information F27<br />
Amounts in NOK million 2011 2010<br />
Gain on sale of property, plant and equipment 89 40<br />
Gain on previous ownership interests in acquired subsidiaries 1)<br />
4 222 <br />
Gain on sale of subsidiaries, associates and jointly controlled entities 2)<br />
1 134 <br />
Revenue from utilities 3)<br />
131 165<br />
Rental revenue 316 271<br />
Other 4)<br />
330 93<br />
Other income, net 6 222 568<br />
1) Remeasurment gain on the previous ownership interests in Alunorte and CAP. See note 5 Acquisitions for further information.<br />
2) Includes sale of Alpart alumina refinery in Jamaica and the Norwegian power production company SKS Produksjon AS.<br />
3) Revenue from utilities include quay structures, pipe network, tank terminal, process water and grid rental.<br />
4) Other includes government grants, royalties, insurance compensation and settlements of pre-existing relationships in acquired entities, see note 5<br />
Acquisitions.
F28<br />
FINANCIAL STATEMENTS<br />
Note 9 - Raw material and energy expense<br />
Note 9 - Raw material and energy expense<br />
Amounts in NOK million 2011 2010<br />
Raw material expense and production supplies 55 807 49 555<br />
Change in inventories own production (135) (921)<br />
Writedowns of inventories 172 74<br />
Reversals of writedowns of inventory (19) (15)<br />
Raw material and energy expense 55 825 48 694<br />
Raw material expense and production supplies include effect of commodity derivative instruments. See note 41 Derivative<br />
instruments and hedge accounting.<br />
Note 10 Board of Directors' statement on Management remuneration<br />
Board of Directors' statement on Management remuneration<br />
The statement on the remuneration of the company's Chief Executive Officer (CEO) and other members of the Corporate<br />
Management Board has been prepared in accordance with the provisions of the Norwegian Public Limited Companies Act, the<br />
Norwegian Accounting Act and the Norwegian Code of Practice for Corporate Governance.<br />
Guidelines for management remuneration<br />
<strong>Hydro</strong>'s guidelines for the remuneration of the company's CEO and other members of the Corporate Management Board<br />
reflect <strong>Hydro</strong>'s global human resources policy, whereby "<strong>Hydro</strong> shall offer its employees an overall compensation package that is<br />
competitive and in line with good industry standards in the country in question. Where appropriate this package should include, in<br />
addition to the base salary, also a performance-based incentive that overall shall reflect individual performance."<br />
Process for determination of remuneration<br />
The Board of Directors has appointed a separate compensation committee consisting of the board chairman and two<br />
shareholder-elected board members, as well as one employee representative. The CEO normally participates in the committee's<br />
meetings unless the committee is considering issues relating directly to the CEO. Other representatives of senior management<br />
may attend meetings if requested to do so.<br />
The committee functions as an advisory body for the Board of Directors and the CEO and is responsible primarily for:<br />
Making recommendations to the Board of Directors based on the committee's annual evaluation of the principles and<br />
systems underlying the remuneration of the CEO and other members of the Corporate Management Board.<br />
Making recommendations to the Board of Directors based on the committee's annual evaluation of the overall<br />
remuneration of the CEO, including the annual basis for bonus payments and bonus payments actually made.<br />
Assisting the CEO by consulting on the remuneration of the other members of the Corporate Management Board.<br />
Key principles for determination of remuneration during the coming financial year<br />
The following statement regarding the remuneration of members of the Corporate Management Board will be presented for an<br />
indicative vote to the annual shareholders' meeting to be held in May 2012. The Board of Directors proposes that the<br />
guidelines set forth below shall apply for 2012 and up until the annual shareholders' meeting in 2013.<br />
The remuneration of members of the Corporate Management Board shall reflect at all times the responsibility of the CEO and<br />
the other members of the Corporate Management Board for the management of <strong>Hydro</strong>, taking into account the complexity<br />
and breadth of the company's operations, as well as the growth and sustainability of such operations. The determination of the<br />
level of the total compensation package will be, first and foremost, based on being competitive, but not a wage leader, within<br />
the relevant labor markets, while at the same time reflecting <strong>Hydro</strong>'s international focus.<br />
<strong>Hydro</strong> attaches importance to transparency and to ensuring that remuneration arrangements are developed and implemented<br />
in accordance with principles for good corporate governance.<br />
The total remuneration of the CEO and other members of the Corporate Management Board will consist of a fixed package of<br />
salary and benefits supplemented by performance-based bonuses, share-based long-term incentive plans, employee share plans,<br />
pension and insurance arrangements and severance pay.
FINANCIAL STATEMENTS<br />
Note 10 Board of Directors' statement on Management remuneration F29<br />
Fixed remuneration The fixed remuneration provided to members of the Corporate Management Board includes a base salary<br />
(which is the main element of remuneration) and benefits in kind such as a company car or car allowance, a telephone,<br />
newspapers and other similar benefits. The base salaries of individual members of the Corporate Management Board are<br />
evaluated annually in light of the complexity and responsibility of the relevant employee's role and his or her contribution,<br />
qualifications and experience, together with conditions in the labor market and general salary trends.<br />
Bonus The annual bonus shall reflect achievements in relation to pre-defined financial targets, key performance indicators<br />
(KPIs) and compliance with and the promotion of <strong>Hydro</strong>'s core values ("The <strong>Hydro</strong> Way"). The bonus parameters, which are<br />
both balanced and ambitious, relate to financial and operational business targets, as well as to individual leadership<br />
expectations. Bonus payments to the CEO and the other members of the Corporate Management Board are dependent on<br />
<strong>Hydro</strong>'s posting of positive underlying earnings before interest and tax (EBIT), together with delivery of operational goals<br />
within pre-defined budgetary frameworks. The Board of Directors is concerned to ensure that bonus parameters are balanced<br />
and reflect the varied nature of <strong>Hydro</strong>'s operations. Bonus parameters will typically relate to organizational and operational<br />
targets and improvements, as well as health, safety and environment (HSE) and corporate social responsibility (CSR). The<br />
targets are established as part of the annual business-planning process. The maximum annual performance-based bonus payable<br />
to the CEO is equal to 50 percent of his or her annual base salary. The maximum annual performance-based bonus payable to<br />
any other member of the Corporate Management Board is equal to 40 percent of his or her annual base salary. Bonus payments<br />
are not taken into account when determining the basis for pensionable salary.<br />
Long Term IncentiveThe long-term incentive (LTI) consists of 30 percent or 25 percent of annual base salary payable,<br />
respectively, to the CEO and other members of the Corporate Management Board. LTI payments are dependent on <strong>Hydro</strong>'s<br />
posting of positive underlying earnings before interest and tax (EBIT) for the previous financial year. Recipients of LTI<br />
payments are required to invest the net amount received after tax in <strong>Hydro</strong> shares. Any such shares must be held for three years.<br />
Any holder of such shares who voluntarily terminates his or her employment during such three-year period must pay to the<br />
company an amount equal to the after-tax value of the shares at the date of such termination. The LTI arrangement is reevaluated<br />
annually. LTI payments are not taken into account when determining the basis for pensionable salary.<br />
Other share-based bonuses The CEO and other members of the Corporate Management Board are eligible to participate fully<br />
in <strong>Hydro</strong>'s discounted employee share purchase plan on the same terms as all other eligible employees (as described below in<br />
note 11 Employee and management remuneration).<br />
No share-based remuneration plans in the form of share options, or share appreciation rights (SARs), will be implemented.<br />
Pensions During 2010 <strong>Hydro</strong> executed an internal pension reform through a transition in Norway to a defined contribution<br />
pension plan, whereby the existing defined benefit pension plan was closed to externally recruited new employees with effect<br />
from March 1, 2010. In connection with the establishment of the new pension system, approximately 20 percent of existing<br />
employees transferred to the defined contribution plan. The plan also involves the allocation of 20 percent of the basic salary in<br />
excess of 12G (where "G" is the National Insurance basic amount) as a vested right. This defined contribution company<br />
pension plan for salaries in excess of 12G will be continued.<br />
The CEO and other members of the Corporate Management Board are members of <strong>Hydro</strong>'s defined benefit pension plan. The<br />
CEO is entitled to retire on a pension after reaching the age of 62. The Board of Directors may also require the CEO to do so.<br />
Full pension entitlement is earned after 30 years' employment at <strong>Hydro</strong>. From the age of 62, defined pension benefits consist<br />
of 60 percent of the pensionable salary. After age 65, the rate of pension is 65 percent of the pensionable salary. A ceiling has<br />
been established regarding the CEO's pensionable earnings. Future salary increases will increase the CEO's pension basis up to a<br />
ceiling of NOK 5.5 million (such amount to be adjusted annually from the date in 2009 on which the CEO took up his<br />
appointment in accordance with the annual percentage changes in the National Insurance basic amount, "G").<br />
Corresponding pension arrangements were put in place during 2010 in respect of the other Norwegian members of the<br />
Corporate Management Board. These arrangements have the effect that future salary increases will only increase the pension<br />
basis up to a ceiling equivalent to NOK 3.5 million on January 1, 2010 (such amount to be adjusted annually in line with the<br />
annual percentage changes in the National Insurance basic amount, "G"). These pensions also make the receipt of 60 percent<br />
of the pensionable salary between the ages of 62 and 65 dependent on at least five years' membership in the Corporate<br />
Management Board between the ages of 50 and 60. The established pension plan does not apply to persons who are entitled to
F30<br />
FINANCIAL STATEMENTS<br />
Note 10 Board of Directors' statement on Management remuneration<br />
retire before reaching the age of 62 under a previous agreement. During 2012 the company will consider whether to make<br />
changes to the current early retirement arrangements.<br />
Insurance The CEO and other members of the Corporate Management Board are covered by insurance arrangements<br />
applicable to all <strong>Hydro</strong> employees with a rank of vice president or higher.<br />
Termination agreement In the event the CEO's employment is terminated involuntarily before age 62 either unilaterally by<br />
<strong>Hydro</strong> or as the result of mutual agreement, the CEO has a contractual right to a notice period of six months, plus severance<br />
pay and other remuneration (excluding bonus and LTI payments) for a period of 12 months. If the CEO earns other income<br />
during such 12-month period, <strong>Hydro</strong> may under certain conditions reduce the CEO's severance pay. In the event of the<br />
CEO's voluntary resignation, the ordinary rules of the Norwegian Working Environment Act regarding termination of<br />
employment will apply.<br />
During 2010 corresponding arrangements were put in place regarding the other members of the Corporate Management<br />
Board, with the exception of one member who in accordance with a prior arrangement is already entitled to transfer to a less<br />
demanding role on reaching the age of 59 and to retire on reaching the age of 62.<br />
In respect of future appointments to the Corporate Management Board, the company will endeavor to enter into advance<br />
agreements to the effect that severance pay will be paid for a period of six months following a six-month notice period.<br />
Members of the Corporate Management Board outside Norway Oliver Bell and Hans-Joachim Kock are employed by a<br />
foreign subsidiary. Their base salaries and other conditions of employment are determined in accordance with <strong>Hydro</strong>'s global<br />
human resources policy and local industry standards. Certain special conditions apply with regards to Johnny Undeli's<br />
responsibilities in Brazil, but his remuneration generally accords with those of other members of the Corporate Management<br />
Board. Undeli, Bell and Kock are covered by the LTI plan (described above) on the same terms as the other members of the<br />
Corporate Management Board.<br />
Key principles for determining remuneration during the previous financial year<br />
The remuneration of the CEO and the members of the Corporate Management Board for the financial year 2011 was based in<br />
essence on the same guidelines as those described above.<br />
In June 2011, the Board of Directors decided to increase the CEO's base salary by 3.5 percent, from NOK 5.15 million to<br />
NOK 5.33 million, with effect from January 1, 2011. In connection with the completion of the Vale transaction, the board<br />
further increased the CEO's base salary by 3.3 percent to NOK 5.5 million with effect from March 1, 2011 in order to reflect<br />
the increased complexity and responsibility of his position. For the same reason the base salary for the CFO and EVP<br />
Corporate staffs was adjusted by 5.6 percent and 6.8 percent, respectively from the same date.<br />
The base salary of the other members of the Corporate Management Board (excluding CEO) increased in the annual salary<br />
adjustment by between 3.0 percent and 4.0 percent in 2011, with an average increase of 3.6 percent.<br />
Bonus payments for 2010 were determined and paid in 2011 on the basis of the principles described above (see also note 11<br />
Employee and management remuneration).<br />
Bonus payments for 2011 will be determined and paid in 2012 on the basis of the principles described above.<br />
Note 11 - Employee and management remuneration<br />
Corporate Management Board remuneration<br />
Corporate management board members' salaries, remuneration in kind, bonus for 2010 paid in 2011, share based long term<br />
incentive for 2010 settled in 2011, and the estimated increase in the value of their pension benefits for 2011, as well as any<br />
loans outstanding and <strong>Hydro</strong> share ownership as of December 31, 2011 are shown in the table below. <strong>Hydro</strong> did not have any<br />
guarantees made on the behalf of any of the corporate management board members during 2011.
Name<br />
Base<br />
salary<br />
1) 2)<br />
Maximum<br />
bonus<br />
potential<br />
1) 2)<br />
Salary<br />
1) 3)<br />
Remuneration paid in 2011<br />
In kind<br />
1) 3)<br />
Bonus<br />
1) 3)<br />
Longterm<br />
incentive<br />
plan (LTI)<br />
1) 3)<br />
Pension<br />
benefits<br />
1) 4)<br />
Outstanding<br />
loans<br />
1) 5)<br />
LTIshares<br />
allocated<br />
<strong>Hydro</strong><br />
share<br />
ownership 6)<br />
Svein Richard Brandtzæg 5 500 2 750 5 632 225 1 937 1 545 5 667 449 16 454 62 847<br />
Jørgen C. Arentz Rostrup 3 015 1 206 3 075 170 828 725 3 541 7 564 22 902<br />
Johnny Undeli 6 040 1 236 6 136 215 876 750 2 117 8 150 13 132<br />
Hilde Aasheim 2 870 1 148 2 962 230 835 690 2 451 7 048 11 112<br />
Kjetil Ebbesberg 2 560 1 024 2 643 184 766 618 1 534 6 979 8 033<br />
Oliver Bell 3 962 1 585 3 980 166 1 307 988 1 509 11 415 14 415<br />
HansJoachim Kock 4 880 1 357 5 008 1 457 1 211 497 1 359 5 825 13 325<br />
Arvid Moss 2 665 1 066 2 705 209 764 644 3 042 7 136 75 957<br />
Tom Røtjer 2 668 1 067 2 808 178 730 648 3 177 6 896 29 846<br />
Wenche Agerup 2 570 1 028 2 603 182 645 489 2 785 230 5 100 20 637<br />
1) Amounts in NOK thousand. Amounts paid by subsidiaries outside Norway have been translated to NOK at average exchange rates for 2011.<br />
2) Base salary is per December 31, 2011. Maximum bonus potential is for 2011. Bonus, if any, will be paid in 2012.<br />
FINANCIAL STATEMENTS<br />
Note 11 - Employee and management remuneration F31<br />
3) Salary is the amount paid to the individual during 2011, and includes vacation pay. Remuneration-in-kind is the total of all non-cash related benefits<br />
received by the individual during 2011 and includes such items as the taxable portion of insurance premiums, car and mileage allowances and electronic<br />
communication items. Bonus is the amount paid in 2011 based on performance achieved and bonus potential for 2010, including bonus earned before the<br />
individuals joined the Corporate Management Board. The LTI plan benefit reflects gross (pre-tax) amounts. For corporate management board members on<br />
net salary employment contracts, benefits have been converted to the gross (pre-tax) amounts.<br />
4) The estimated change in the value of pension benefits reflects both the effect of earning an additional year's pension benefit and the adjustment to present<br />
value of previously earned pension rights. It is calculated as the increase in Projected Benefit Obligations (PBO) calculated with stable assumptions. As such,<br />
the number includes both the annual accrual of pension benefits and the interest element related to the total accrued pension benefit. For all individuals listed<br />
in the table, this is the estimated change from January 1, 2011 to December 31, 2011.<br />
5) The loans to corporate management board members, including close familiy members, were extended under an employee benefit scheme applicable to all<br />
employees in Norway. The loans to Svein Richard Brandtzæg have interest rates of 3.75 and 3.9 percent and repayment periods of six and eight years. The<br />
loan to Wenche Agerup has an interest rate of 7.25 percent and a repayment period of two years. Payments have been made in a timely fashion and the<br />
loans are not in default.<br />
6) <strong>Hydro</strong> share ownership is the number of shares held directly by the corporate management board member and any shares held by close family members<br />
and controlled entities. <strong>Hydro</strong> share ownership for all corporate management board members is as of December 31, 2011.<br />
Under the long term incentive for 2010 settled in 2011, former corporate management board members Ola Sæter and Odd<br />
Ivar Biller received 3,741 and 2,222 shares with a gross (pre-tax) value of NOK 338 thousand and NOK 196 thousand,<br />
respectively.<br />
Effective March 30, 2009, Eivind Reiten stepped down as President and CEO, and left <strong>Hydro</strong>. He has a termination<br />
agreement with right to certain benefits (excluding bonus) for a three-year period, beginning March 30, 2009. In 2011, Reiten<br />
received a total remuneration of NOK 6,404 thousand. The estimated change in value of his pension benefits increased by<br />
NOK 3,392 thousand.<br />
United Kingdom employee share-based compensation<br />
In 1988, <strong>Hydro</strong> established a stock option share purchase program for employees in the United Kingdom. The stock option<br />
purchase program is organized in an independent trust. The trust acquired shares in the market at the time the options were<br />
granted. The last options were granted in July 2002 and the program will be operational until July 2012, when the last<br />
remaining options expire. No further options will be granted.<br />
Each year the employees were given the option to acquire a limited number of shares at a fixed price during a period from the<br />
third to the tenth year from the grant date. The exercise price of the options originally equaled the share price at the time the<br />
options were granted. On October 1, 2007, in connection with the demerger of <strong>Hydro</strong>'s oil and gas business to Statoil, the<br />
value of the options was reduced. The options remain options over <strong>Hydro</strong> shares only and do not give an option to purchase<br />
the Statoil shares which were issued for each <strong>Hydro</strong> share to the trust.<br />
At January 1, 2010, 19,813 options were outstanding and the trust's balance of shares was 407,908 <strong>Hydro</strong> shares and 271,768<br />
Statoil shares. During 2010 no options were exercised and 3,860 options expired. As of December 31, 2010 the trust's balance<br />
of <strong>Hydro</strong> shares was 423,813 and of Statoil shares was 271,687. There were 15,953 options outstanding as of December 31,<br />
2010, with an average strike price equivalent to NOK 56.34 per share.
F32<br />
FINANCIAL STATEMENTS<br />
Note 11 - Employee and management remuneration<br />
During 2011 no options were exercised and 4,060 options expired. As of December 31, 2011 the trust's balance of <strong>Hydro</strong><br />
shares was 423,813 and 271,687 Statoil shares. There were 11,893 options outstanding as of December 31, 2011, with an<br />
average strike price equivalent to NOK 58.89 per share.<br />
Employee share purchase plan<br />
<strong>Hydro</strong> has established a share purchase plan for employees in Norway. The plan payout is based on share price performance,<br />
and whether the share price (adjusted for dividend paid) increases with at least 12 percent or not during the performance<br />
period. Under the plan offered in 2011, eligible <strong>Hydro</strong> employees received a NOK 2,500 share-purchase rebate to purchase<br />
NOK 10,000 of shares of Norsk <strong>Hydro</strong> ASA, which corresponds to a 25 percent discount from the market price, as<br />
shareholder return did not exceed 12 percent in the period from January 1 to December 31, 2010 (the performance<br />
measurement period).<br />
In the performance period January 1 to December 31, 2011 shareholder return did not exceed 12 percent. Therefore, under<br />
the plan to be offered in 2012, employees will receive a rebate of NOK 2,500 on their purchase of NOK 10,000 of Norsk<br />
<strong>Hydro</strong> ASA shares. The rebate of NOK 2,500 corresponds to a 25 percent discount from the market price.<br />
Employees are eligible to receive an offer to purchase shares under this plan if they were 1) employed by Norsk <strong>Hydro</strong> ASA or a<br />
more than 90 percent owned Norwegian subsidiary, and 2) employed as of December 31 through the final acceptance date of<br />
the share purchase offer.<br />
Compensation expense related to the 2010 performance measurement period was accrued and recognized over the service<br />
period of December 31, 2010 through April 1, 2011, the final acceptance date of the offer. In 2011 and 2010 the participation<br />
rates of eligible employees in the employee share purchase plan were 82 and 88 percent, respectively. Details related to the<br />
employee share purchase plan are given in the table below.<br />
Employee share purchase plan<br />
Performance measurement period 2011 2010 2009<br />
Total shareholder return performance target achieved
Note 12 - Depreciation and amortization expense<br />
Specification of depreciation and amortization by asset category<br />
FINANCIAL STATEMENTS<br />
Note 12 - Depreciation and amortization expense F33<br />
Amounts in NOK million 2011 2010<br />
Buildings 686 429<br />
Machinery and equipment 4 077 2 393<br />
Intangible assets 164 131<br />
Depreciation and amortization expense 4 928 2 952<br />
Note 13 - Impairment of non-current assets<br />
Amounts in NOK million 2011 2010<br />
Classification by asset category<br />
Impairment losses<br />
Property, plant and equipment 1 153 32<br />
Intangible assets 78 <br />
Total impairment of noncurrent assets 1 231 32<br />
Classification by segment<br />
Impairment losses<br />
Primary Metal 970 3<br />
Extruded Products 235 29<br />
Energy 21 <br />
Other activities 5 <br />
Total impairment of noncurrent assets 1 231 32<br />
All Cash Generating Units (CGUs) or fixed assets that are not part of a CGU are reviewed for impairment indicators at each<br />
balance sheet date. Tests for impairment have been performed for the CGUs where impairment indicators have been identified.<br />
The recoverable amount for these units have been determined estimating the Value in Use (VIU) of the asset and if appropriate<br />
its fair value less cost to sell (FV), and comparing the highest of the two against the carrying value of the CGUs. The<br />
calculation of VIU has been based on management's best estimate, reflecting the business planning process. Impairment losses<br />
have been recognized where the recoverable amount is less than the carrying value.<br />
In Primary Metal all plants have been assessed for impairment indicators following the decline in aluminium prices and lower<br />
economic activity. Impairment indicators were identified for two CGUs in 2011. Key assumptions in testing for impairment<br />
included aluminium prices, energy prices, fixed and variable costs and currency exchange rates. Prices were estimated based on<br />
existing contracts, observed markets prices, together with <strong>Hydro</strong>'s best estimate of future economic conditions covering the<br />
remaining useful life of the assets. Test results are highly sensitive to these assumptions. The VIU for <strong>Hydro</strong>'s Kurri Kurri plant<br />
in Australia was estimated using a pre-tax discount rate of 11 percent. The plant was written down by NOK 970 million. The<br />
recoverable amount of the other plant tested was above its carrying value.<br />
Weak markets in particular in Building Systems in southern Europe were considered impairment indicators for five CGUs in<br />
Extruded Products. Two CGUs, the building systems operations in Spain and Italy, were concluded to be impaired and written<br />
down by in total NOK 235 million. The volumes and margins have declined significantly over the later years, and are now on<br />
historic low levels. The impairment tests for these CGUs assume continued low levels for the first two years, then a slight<br />
increase in volumes and margins, however, not reaching pre crisis levels.
F34<br />
FINANCIAL STATEMENTS<br />
Note 13 - Impairment of non-current assets<br />
For Metal Markets and Rolled Products impairment indicators were noted for two small CGUs with weak performance. The<br />
test results concluded with recoverable amounts marginally higher than carrying value.<br />
Goodwill and intangible assets with indefinite life are required to be tested annually, in addition to any tests required when<br />
impairment indicators are determined to be present. <strong>Hydro</strong> has elected to do the annual impairment test of goodwill in the<br />
fourth quarter.<br />
Goodwill is allocated to CGUs or groups of CGUs as shown in the following table:<br />
Amounts in NOK million 2011 2010<br />
Alumina production Brazil (Bauxite & Alumina) 3 310 <br />
Remelters sector (Metal Markets) 244 238<br />
Extrusion Eurasia sector 326 325<br />
Building Systems sector 230 228<br />
Extrusion North America sector 79 77<br />
Extrusion South America sector 74 78<br />
Precision Tubing sector 38 39<br />
Total Extruded Products 747 747<br />
Total goodwill 4 301 985<br />
For Metal Markets and Extruded Products, impairment tests on goodwill have been based on approved business plan for the<br />
next year, managements best estimate of cash flows for the following four years and extrapolated to a 15 years cash flow<br />
estimate. See note 4 Critical accounting judgment and key sources of estimation uncertainty for additional information about<br />
impairment testing. Goodwill in Bauxite and Alumina Brazil was recognized as part of the acquisition of Vale Aluminium in<br />
2011, see note 5 Acquisitions.<br />
Note 14 - Research and development<br />
Total expensed research and development cost was NOK 508 million in 2011 and NOK 543 million in 2010. Research and<br />
development activities are intended to make production of aluminium more efficient including further improving the<br />
operational and environmental performance of <strong>Hydro</strong>'s electrolysis technology. A significant proportion of the means are also<br />
used for further developing the production processes and products within casting and alloy development, extrusion, precision<br />
tubing, building systems as well as rolled products.<br />
To the extent development costs are directly contributing to the construction of a fixed asset, the development costs are<br />
capitalized as part of the asset provided all criteria for capitalizing the cost are met. Costs incurred during the preliminary<br />
project stage, as well as maintenance costs, are expensed as incurred.<br />
Note 15 - Operating leases<br />
Future minimum lease payments due under non-cancellable operating leases are as follows:<br />
Less than<br />
Amounts in NOK million 1 year 15 years Thereafter Total<br />
Operating lease obligation 2011 513 1 644 3 724 5 881<br />
Operating lease obligation 2010 437 1 202 1 365 3 003<br />
Operating lease expense for office space, machinery and equipment amounts to NOK 552 million for 2011 and NOK 552<br />
million for 2010.
Note 16 - Financial income and expense<br />
FINANCIAL STATEMENTS<br />
Note 16 - Financial income and expense F35<br />
Amounts in NOK million 2011 2010<br />
Interest income 263 201<br />
Net gain (loss) on securities (60) 121<br />
Dividends received 7 23<br />
Financial income 209 346<br />
Interest expense (367) (253)<br />
Capitalized interest 1 5<br />
Net foreign exchange gain (loss) (971) 513<br />
Accretion expense (176) (35)<br />
Other 15 (54)<br />
Financial expense (1 498) 176<br />
Financial income (expense), net (1 288) 522<br />
Note 17 - Income tax expense<br />
Amounts in NOK million 2011 2010<br />
Income (loss) before taxes<br />
Norway 4 107 1 803<br />
Other countries 4 432 1 902<br />
Total 8 539 3 706<br />
Current taxes<br />
Norway 1 256 1 198<br />
Other countries 637 455<br />
Current income tax expense 1 892 1 652<br />
Deferred taxes<br />
Norway 385 (264)<br />
Other countries (488) 199<br />
Deferred tax expense (benefit) (103) (64)<br />
Total income tax expense (benefit) 1 790 1 588<br />
Components of deferred taxes<br />
Origination and reversal of temporary differences (416) (78)<br />
Benefit tax loss carryforwards (187) (28)<br />
Net change in unrecognized deferred tax assets 632 2<br />
Tax expense (benefit) allocated to Other components of equity (132) 39<br />
Deferred tax expense (benefit) (103) (64)
F36<br />
FINANCIAL STATEMENTS<br />
Note 17 - Income tax expense<br />
Reconciliation of Norwegian nominal statutory tax rate to effective tax rate<br />
Amounts in NOK million 2011 2010<br />
Expected income taxes at statutory tax rate 1)<br />
2 391 1 038<br />
<strong>Hydro</strong>electric power surtax 2)<br />
584 447<br />
Equity accounted investments 73 170<br />
Foreign tax rate differences (389) (41)<br />
Tax free income (1 622) (135)<br />
Losses, other tax benefits and deductions with no tax benefits, net 753 110<br />
Income tax expense (benefit) 1 790 1 588<br />
Effective tax rate 21.0% 42.9%<br />
1) Norwegian nominal statutory tax rate is 28 percent.<br />
2) A surtax of 30 percent is applied to taxable income, with certain adjustments, for Norwegian hydro-electric power plants. The surtax comes in addition to<br />
the normal corporate taxation.<br />
Note 18 - Short-term investments<br />
Amounts in NOK million 2011 2010<br />
Equity securities 845 860<br />
Debt securities 456 462<br />
Other 479 <br />
Total shortterm investments 1 780 1 321<br />
Note 19 - Accounts receivable<br />
Amounts in NOK million 2011 2010<br />
Trade receivables 10 749 10 663<br />
Allowance for credit losses (392) (452)<br />
VAT receivables 880 825<br />
Other receivables 1 980 1 747<br />
Accounts receivable 13 217 12 783<br />
Note 20 - Inventories<br />
Amounts in NOK million 2011 2010<br />
Raw materials 6 103 4 097<br />
Work in progress 3 002 2 307<br />
Finished goods 5 052 4 567<br />
Inventories 14 157 10 971<br />
Raw materials include spare parts with a minor amount. All amounts are net of any write-downs. The total of write-downs<br />
included is NOK 273 million in 2011 and NOK 121 million in 2010.
Note 21 - Other non-current assets<br />
FINANCIAL STATEMENTS<br />
Note 21 - Other non-current assets F37<br />
Amounts in NOK million 2011 2010<br />
Nonmarketable equity securities 1 052 1 509<br />
Employee loans 222 237<br />
Currency derivative instruments 28 60<br />
Commodity derivative instruments 422 386<br />
Prepaid taxes 4 090 <br />
Other financial assets 1 535 1 199<br />
Other noncurrent assets 7 348 3 391<br />
Note 22 - Property, plant and equipment<br />
Amounts in NOK million Land Buildings<br />
Machinery<br />
and Plant under<br />
equipment construction<br />
Total<br />
Cost<br />
December 31, 2009 982 15 633 42 269 1 092 59 975<br />
Additions 1 155 1 234 956 2 345<br />
Disposals (4) (48) (781) (2) (835)<br />
Transfers 272 782 (1 054) <br />
Foreign currency translation effect (46) (141) (537) (8) (731)<br />
December 31, 2010 933 15 871 42 968 984 60 754<br />
Acquisitions through business combinations 36 6 374 35 207 1 823 43 439<br />
Other additions 148 1 262 2 733 4 144<br />
Disposals (1) (169) (660) (831)<br />
Transfers 9 199 1 096 (1 305) <br />
Foreign currency translation effect (5) (313) (1 760) (148) (2 226)<br />
December 31, 2011 971 22 109 78 114 4 087 105 280<br />
Accumulated depreciation and impairment<br />
December 31, 2009 (1) (7 930) (26 393) (4) (34 328)<br />
Depreciation for the year (429) (2 393) (2 821)<br />
Impairment losses (2) (28) (3) (32)<br />
Disposals 47 725 772<br />
Transfers (30) 30 <br />
Foreign currency translation effect 85 418 1 505<br />
December 31, 2010 (1) (8 258) (27 641) (5) (35 905)<br />
Depreciation for the year (686) (4 077) (4 763)<br />
Impairment losses (48) (272) (758) (75) (1 153)<br />
Disposals 140 602 743<br />
Transfers (7) 7 <br />
Foreign currency translation effect (6) 4 (7) (10)<br />
December 31, 2011 (49) (9 090) (31 862) (88) (41 088)<br />
Carrying value<br />
December 31, 2010 932 7 612 15 327 978 24 849<br />
December 31, 2011 922 13 019 46 252 3 999 64 192
F38<br />
FINANCIAL STATEMENTS<br />
Note 23 - Intangible assets<br />
Note 23 - Intangible assets<br />
Amounts in NOK million<br />
Intangible<br />
assets under<br />
development<br />
Capitalized<br />
software<br />
systems<br />
Mineral<br />
rights<br />
Other<br />
intangible<br />
assets Total<br />
Cost<br />
December 31, 2009 158 1 029 1 485 2 672<br />
Additions 121 19 88 229<br />
Disposals (3) (73) (77)<br />
Transfers (222) 222 <br />
Foreign currency translation effect (1) (39) (49) (89)<br />
December 31, 2010 55 1 228 1 451 2 735<br />
Acquisitions through business combinations 74 1 113 1 855 3 043<br />
Other additions 33 46 94 173<br />
Disposals (8) (39) (47)<br />
Transfers (5) 5 <br />
Foreign currency translation effect (7) (46) (119) (172)<br />
December 31, 2011 84 1 334 1 067 3 247 5 731<br />
Accumulated amortization and impairment<br />
December 31, 2009 (766) (1 018) (1 784)<br />
Amortization for the year (72) (59) (131)<br />
Disposals 8 40 48<br />
Foreign currency translation effect 33 34 67<br />
December 31, 2010 (797) (1 003) (1 800)<br />
Amortization for the year 1)<br />
(108) (139) (247)<br />
Impairment loss (77) (78)<br />
Disposals 7 5 12<br />
Foreign currency translation effect 4 8 12<br />
December 31, 2011 (895) (1 207) (2 102)<br />
Carrying value<br />
December 31, 2010 55 431 448 934<br />
December 31, 2011 84 438 1 067 2 040 3 629<br />
1) Amortization of a sourcing contract is reported as Raw material and energy expense in the income statement.
Note 24 - Goodwill<br />
Bauxite & Metal Extruded<br />
Amounts in NOK million Alumina Markets Products Total<br />
Cost<br />
December 31, 2009 236 756 992<br />
Foreign currency translation effect 2 (8) (7)<br />
December 31, 2010 238 747 985<br />
Additions 3 499 3 499<br />
Foreign currency translation effect (189) 6 (183)<br />
December 31, 2011 3 310 244 747 4 301<br />
Carrying value<br />
FINANCIAL STATEMENTS<br />
Note 24 - Goodwill F39<br />
December 31, 2010 238 747 985<br />
December 31, 2011 3 310 244 747 4 301<br />
See note 13 Impairment of non-current assets for information about the impairment testing of goodwill on an annual basis.<br />
Note 25 - Investments in associates<br />
Amounts in NOK million Alunorte Aluchemie<br />
SKS Produksjon<br />
NorSun<br />
Ascent<br />
Solar Other Total<br />
December 31, 2009 6 276 573 345 180 174 209 7 757<br />
Investments (sale), net 37 7 50 94<br />
Change in longterm advances, net 30 (6) 24<br />
<strong>Hydro</strong>'s share of net income (loss) 206 13 36 (39) (52) 7 171<br />
Amortization (19) (16) (5) (3) (3) (47)<br />
Impairment losses (58) (58)<br />
Dividends and other payments received by <strong>Hydro</strong> (69) (24) (93)<br />
Foreign currency translation and other 329 (34) (13) 9 8 298<br />
December 31, 2010 6 724 565 338 120 135 265 8 148<br />
Investments <br />
Change in longterm advances, net 10 (10) <br />
<strong>Hydro</strong>'s share of net income (loss) 21 14 20 (4) (44) 10 18<br />
Amortization (3) (16) (3) (3) (25)<br />
Impairment losses (116) (56) (172)<br />
Dividends and other payments received by <strong>Hydro</strong> (43) (35) (3) (81)<br />
Derecognized investments (6 482) (340) (122) (6 944)<br />
Foreign currency translation and other (217) (4) 20 (7) (4) (211)<br />
December 31, 2011 569 29 133 732<br />
Change in elimination of internal profit in inventory on goods sold from associates to <strong>Hydro</strong> amounted to a loss of NOK 13<br />
million and NOK 1 million in 2011 and 2010, respectively.
F40<br />
FINANCIAL STATEMENTS<br />
Note 25 - Investments in associates<br />
Specification of associates<br />
Percentage<br />
owned by<br />
<strong>Hydro</strong> at<br />
year end<br />
Investments in and<br />
advances to<br />
associates<br />
<strong>Hydro</strong>'s current trade<br />
receivable (payable),<br />
net with associates<br />
Amounts in NOK million, except ownership 2011 2011 2010 2011 2010<br />
Alunorte 6 724 (370)<br />
Aluchemie 36.2 % 569 565 <br />
SKS Produksjon 338 <br />
NorSun 17.4 % 120 <br />
Ascent Solar 20.5 % 29 135 <br />
Others 133 265 <br />
Total 732 8 148 (370)<br />
A description of significant associates' business, majority owners, and the nature of related party transactions with <strong>Hydro</strong><br />
including amounts if material follows:<br />
Alumina do Norte do Brasil S.A. (Alunorte) is an alumina refinery located in Brazil. Before <strong>Hydro</strong>'s acquisition of Vale<br />
Aluminium on February 28, 2011, <strong>Hydro</strong>'s ownership share was 34 percent. Vale S.A. owned 57 percent of the shares in<br />
Alunorte increasing <strong>Hydro</strong>'s ownership interest to 91 percent following the acquisition, see note 5 Acquisitions.<br />
Aluminium & Chemie Rotterdam B.V. (Aluchemie) is an anode producer located in the Netherlands. <strong>Hydro</strong> owns 36.2<br />
percent and has 21.2 percent of the voting rights. Other shareholders are Rio Tinto Alcan (53.3 percent) and Søral (10.5<br />
percent). <strong>Hydro</strong> purchased anodes from Aluchemie amounting to NOK 824 million in 2011 and NOK 580 million in 2010<br />
based on a cost plus formula. Sales of anode butts and coke from <strong>Hydro</strong> to Aluchemie amounted to NOK 120 million in 2011<br />
and NOK 77 million in 2010. <strong>Hydro</strong> is committed to purchase a share of produced anodes based on it's ownership interest.<br />
For certain product lines the right and obligation to purchase is higher, as agreed between the shareholders. Aluchemie is part<br />
of Primary Metal.<br />
SKS Produksjon AS (SKS Produksjon) is a power producer located in Northern Norway. SKS Produksjon AS was sold in<br />
2011.<br />
NorSun AS (NorSun) is produces mono crystalline wafers for the photovoltaic industry. <strong>Hydro</strong>'s owns 17.4 percent of<br />
NorSun. Significant influence is obtained through representation in the board of directors as agreed in the shareholders'<br />
agreement. Other major shareholders are Scatec (19 percent) and Good Energies (22 percent). In 2011 and 2010 the<br />
investment in NorSun was tested for impairment, resulting in an impairment loss of NOK 116 million in 2011 and 58 million<br />
in 2010. NorSun is part of Other.<br />
Ascent Solar Technologies Inc. (Ascent) develops thin-film photovoltaic modules and is located in Denver, Colorado in the<br />
US. In 2011 <strong>Hydro</strong> agreed to divest its stake in Ascent for a cash consideration of about NOK 24 million. The transaction is<br />
expected to be completed in the first quarter of 2012. Ascent is part of Other.<br />
The income statement and balance sheet information included in the table below is based on reported figures from associates,<br />
which could differ from <strong>Hydro</strong>'s assessment of the underlying values.
Amounts in NOK million (unaudited) 2011 2010<br />
Income statement data 1)<br />
Revenues 4 882 12 525<br />
Earnings before financial items and tax (428) 955<br />
Income before tax (513) 1 048<br />
Net income (688) 504<br />
Balance sheet data<br />
Current assets 1 257 4 748<br />
Noncurrent assets 3 623 25 014<br />
Assets 4 880 29 762<br />
Current liabilites 973 3 337<br />
Noncurrent liabilities 1 513 5 986<br />
Equity 2 394 20 439<br />
Liabilites and equity 4 880 29 762<br />
1) Income statement data for Alumina do Norte do Brasil S.A. and SKS Produksjon AS is included for the period until derecognition.<br />
Note 26 - Investments in jointly controlled entities<br />
FINANCIAL STATEMENTS<br />
Note 25 - Investments in associates F41<br />
Amounts in NOK million Alunorf Søral Qatalum Alpart Other Total<br />
December 31, 2009 1 410 584 5 879 (65) 156 7 964<br />
Investments (sale), net 4 060 7 (5) 4 062<br />
Change in longterm advances, net (14) (531) (545)<br />
<strong>Hydro</strong>'s share of net income (loss) (12) 63 (628) (2) (28) (606)<br />
Amortization (56) 1 (55)<br />
Impairment losses (7) (8) (15)<br />
Dividends and other payments received by <strong>Hydro</strong> (6) (9) (15)<br />
Foreign currency translation and other (80) (206) (1) (2) (289)<br />
December 31, 2010 1 241 647 8 574 (68) 106 10 501<br />
Investments (sale), net 599 77 (1) 675<br />
Change in longterm advances, net (13) (293) (306)<br />
<strong>Hydro</strong>'s share of net income (loss) (6) (16) 30 (2) 5 11<br />
Amortization (54) (54)<br />
Impairment losses (10) 1 (9)<br />
Dividends and other payments received by <strong>Hydro</strong> (8) (9) (17)<br />
Foreign currency translation and other (8) (98) 3 (103)<br />
December 31, 2011 1 152 631 8 812 102 10 697<br />
Change in elimination of internal profit in inventory on goods sold from jointly controlled entities to <strong>Hydro</strong> amounted to a<br />
loss of NOK 15 million in 2011 and a gain of NOK 5 million in 2010. Negative value of investments in jointly controlled<br />
entities of NOK 13 million as of December 31, 2011 is included in Other liabilities.
F42<br />
FINANCIAL STATEMENTS<br />
Note 26 - Investments in jointly controlled entities<br />
Specification of jointly controlled entities<br />
Percentage<br />
owned by<br />
<strong>Hydro</strong> at<br />
year end<br />
Investments in and<br />
advances to investees<br />
<strong>Hydro</strong>'s current trade<br />
receivable (payable), net<br />
with investees<br />
Amounts in NOK million, except ownership 2011 2011 2010 2011 2010<br />
Alunorf 50.0% 1 152 1 241 (306) (224)<br />
Søral 49.9% 631 647 (92) (89)<br />
Qatalum 50.0% 8 812 8 574 (664) (267)<br />
Alpart (68) <br />
Others 102 106 (4) <br />
Total 10 697 10 501 (1 066) (580)<br />
Below is a description of significant jointly controlled entities' business operation, ownership and the nature of related party<br />
transactions with <strong>Hydro</strong> including amounts if material. Contractual and capital commitments, contingent liabilities and<br />
guarantees reported by the jointly controlled entity is included where applicable.<br />
Aluminium Norf GmbH (Alunorf) located in Germany is the world's largest rolling mill and is owned by <strong>Hydro</strong> and<br />
Hindalco Industries (50 percent each). Alunorf produces flat rolled products from raw material from the partners based on a<br />
tolling arrangement. Sales from Alunorf to <strong>Hydro</strong> amounted to NOK 1,475 million in 2011 and NOK 1,423 million in 2010.<br />
<strong>Hydro</strong>'s capital and financing commitments are regulated in the Joint Venture agreement. <strong>Hydro</strong>'s financing commitment to<br />
Alunorf was NOK 159 million as of December 31, 2011. Alunorf is part of Rolled Products.<br />
Sør-Norge Aluminium AS (Søral) is the fourth largest primary aluminium manufacturer in Norway located in Husnes,<br />
Hordaland. <strong>Hydro</strong> owns 49.9 percent and Rio Tinto Alcan 50 percent. Each partner purchases its proportional share of<br />
production at current market prices. <strong>Hydro</strong>'s purchases from Søral amounted to NOK 956 million in 2011 and NOK 942<br />
million in 2010. Sale of alumina and metal from <strong>Hydro</strong> to Søral amounted to NOK 458 million in 2011 and NOK 604<br />
million in 2010. Søral is part of Primary Metal.<br />
Qatar Aluminium Ltd. (Qatalum) is a primary aluminium smelter with a dedicated power plant located in Qatar. Qatalum<br />
has an annual production capacity of about 600,000 mt of liquid metal. Qatalum is owned by <strong>Hydro</strong> and Qatar Petroleum<br />
Ltd., (50 percent each).<br />
<strong>Hydro</strong> is committed to sell fixed quantities of alumina and purchase all products from Qatalum at market based prices.<br />
Purchases of metal from Qatalum amounted to NOK 6,358 million in 2011 and NOK 2,025 million in 2010. Sales from<br />
<strong>Hydro</strong> to Qatalum amounted to NOK 1,192 million in 2011 and NOK 695 million in 2010. Qatalum is part of Primary<br />
Metal.<br />
Alumina Partners of Jamaica (Alpart) is an alumina refinery located in Jamaica. <strong>Hydro</strong> divested its 35 percent interest in 2011.<br />
The income statement and balance sheet information included in the table below is based on reported figures from the joint<br />
ventures, which could differ from <strong>Hydro</strong>'s assessment of the underlying values.
Amounts in NOK million (unaudited) 2011 2010<br />
Income statement data<br />
Revenues 12 160 7 705<br />
Earnings before financial items and tax 213 (1 164)<br />
Income before tax 39 (1 178)<br />
Net income 3 (1 207)<br />
Balance sheet data<br />
FINANCIAL STATEMENTS<br />
Note 26 - Investments in jointly controlled entities F43<br />
Current assets 7 405 6 225<br />
Noncurrent assets 34 044 34 503<br />
Assets 41 449 40 728<br />
Current liabilites 1 792 3 017<br />
Noncurrent liabilities 18 516 17 706<br />
Equity 21 140 20 005<br />
Liabilites and equity 41 449 40 728<br />
Note 27 - Jointly owned assets<br />
<strong>Hydro</strong> is invested in certain assets where the legal ownership takes various forms of undivided direct ownership in the assets,<br />
and where operational and strategic decisions are made by supermajority among the owners. These arrangements are not joint<br />
ventures as defined by IFRS. <strong>Hydro</strong> accounts for its relative share of assets, liabilities, expenses and, where relevant, revenues<br />
related to these arrangements. Assets, liabilities, revenues and expenses are classified with other items of the same nature<br />
incurred as part of <strong>Hydro</strong>'s controlled operations.<br />
The most significant of these arrangements are <strong>Hydro</strong>'s 20 percent ownership in the Alouette plant in Canada, and the 12.4<br />
percent ownership in the Tomago plant in Australia. Both plants produce primary aluminium. <strong>Hydro</strong> provides alumina relative<br />
to its share of the metal production, and receives produced metal for further processing or sale. Other costs of operations,<br />
including power consumption and labor, are incurred on a joint basis by the owners. Unrealized losses or gains relating to<br />
embedded derivatives and operational hedges associated with the physical supply of power to the plants are also incurred or<br />
earned on a joint basis by the owners.<br />
The following key figures show the main impact of these two arrangements:<br />
Amounts in NOK million 2011 2010<br />
Property, plant and equipment 2 362 2 388<br />
Share of expenses 1 173 1 097<br />
Depreciation and amortization 230 263<br />
Produced volume (kmt) 183 178
F44<br />
FINANCIAL STATEMENTS<br />
Note 28 - Bank loans and other interest-bearing short-term debt<br />
Note 28 - Bank loans and other interest-bearing short-term debt<br />
Amounts in NOK million 2011 2010<br />
Bank loans and overdraft facilities 2 779 418<br />
Other interestbearing shortterm debt 416 440<br />
Current portion of longterm debt 1 053 82<br />
Bank loans and other interestbearing shortterm debt 4 248 940<br />
Note 29 - Trade and other payables<br />
Amounts in NOK million 2011 2010<br />
Accounts payable 8 736 7 088<br />
Payroll and value added taxes 2 023 1 676<br />
Accrued liabilities and other payables 1 556 1 157<br />
Trade and other payables 12 316 9 920<br />
Note 30 - Long-term debt<br />
Longterm debt payable in various currencies<br />
Amounts in NOK million 2011 2010<br />
USD 4 340 289<br />
Other 4 55<br />
Total unsecured bank loans 4 344 344<br />
Other longterm debt 898 66<br />
Outstanding debt 5 242 410<br />
Less: Current portion (1 052) (82)<br />
Total longterm debt 4 190 328<br />
Repayments of longterm debt including interest<br />
Amounts in NOK million Bank loans Other Interest Total<br />
2012 1 029 24 82 1 134<br />
2013 1 029 824 67 1 920<br />
2014 406 18 38 462<br />
2015 440 17 31 487<br />
2016 473 10 22 505<br />
Thereafter 968 5 28 1 001<br />
Total 4 344 898 268 5 510<br />
Norsk <strong>Hydro</strong> ASA has a USD 1,700 million, seven-year revolving multi-currency credit facility with a syndicate of<br />
international banks, maturing in July 2014. A commitment fee on undrawn amounts is calculated as a percentage of the loan<br />
margin under the facility. Any borrowing under the facility will be unsecured, and the debt agreement contains no financial<br />
ratio covenants and no provisions connected to the value of underlying assets. The facility is for general corporate purposes,<br />
and provide readily available and flexible long-term funding. There was no borrowing under the facility as of December 31,<br />
2011.
Note 31 - Provisions<br />
2011 2010<br />
Amounts in NOK million Shortterm Longterm Total Shortterm Longterm Total<br />
Warranties 53 1 54 80 5 84<br />
Exit and disposal activities 153 1 154 123 34 157<br />
Environmental cleanup and asset retirement obligations (ARO) 134 1 699 1 833 162 927 1 090<br />
Medical and other employee benefits 337 452 790 376 468 845<br />
Social security costs on pension 644 644 644 644<br />
Insurance 575 575 902 902<br />
Other 117 532 650 115 26 141<br />
Total provisions 1 369 3 331 4 700 1 758 2 104 3 862<br />
The following table includes a specification of changes to provisions for the year ending December 31, 2011 and the expected<br />
timing of cash outflows relating to the provisions:<br />
Amounts in NOK million<br />
Warranties<br />
Exit and<br />
disposal<br />
Environmental<br />
cleanup<br />
and ARO<br />
Medical<br />
and other<br />
employee<br />
benefits<br />
FINANCIAL STATEMENTS<br />
Note 31 - Provisions F45<br />
Social<br />
security<br />
costs<br />
pension<br />
Insurance<br />
Other Total<br />
Specification of change in provisions<br />
December 31, 2010 84 157 1 090 845 644 902 141 3 862<br />
Additions through business combinations 675 543 1 218<br />
Other additions 77 127 44 473 49 108 877<br />
Used during the year (62) (121) (74) (409) (48) (319) (66) (1 098)<br />
Reversal of unused provisions (45) (9) (12) (117) (1) (9) (53) (245)<br />
Accretion expense and effect of change in<br />
discount rate 119 119<br />
Foreign currency translation (8) (2) (24) (34)<br />
December 31, 2011 54 154 1 833 790 644 575 650 4 700<br />
Timing of cash outflows<br />
2012 53 153 134 340 49 575 117 1 421<br />
20132016 1 1 963 165 190 13 1 333<br />
Thereafter 737 285 405 519 1 946<br />
December 31, 2011 54 154 1 833 790 644 575 650 4 700<br />
Provisions for exit and disposal activities relate to labor force reductions, demolition costs and certain other costs.<br />
Provisions for environmental clean-up relate to production facilities currently in operation and facilities that are closed. Asset<br />
retirement obligations relate to restoration or rehabilitation of industrial or mining sites, disposal of contaminated material and<br />
certain liabilities related to Norwegian power plant concessions to be reverted to the Norwegian government. See note 4<br />
Critical accounting judgment and key sources of estimation uncertainty for additional information about environmental<br />
liabilities.<br />
Provisions for medical benefits primarily relate to post-retirement medical benefits for employees in North America. Provisions<br />
for other employee benefits relate to expected short-term performance bonus payments and short and long-term provisions for<br />
expected bonus payments that are based on the number of years of service, primarily for our European operations. Such<br />
bonuses are expected to be paid in periods between 10 to 50 years of service, or upon termination of employment.<br />
Provisions for social security costs on pension relate primarily to operations in Europe having defined benefit pension plans.<br />
See note 32 Employee retirement plans for additional information.<br />
Insurance provisions relate to insurance contracts issued by <strong>Hydro</strong>'s captive insurance company, Industriforsikring AS, to<br />
external parties including associates and jointly controlled entities. Related reinsurance receivables included in Accounts<br />
receivables amounted to NOK 328 million and NOK 633 million as of December 31, 2011 and 2010, respectively.
F46<br />
FINANCIAL STATEMENTS<br />
Note 32 - Employee retirement plans<br />
Note 32 - Employee retirement plans<br />
Pension Benefits<br />
Norsk <strong>Hydro</strong> ASA and some of its subsidiaries have defined benefit retirement plans that cover the majority of their employees.<br />
These plan benefits are generally based on years of service and final salary levels. Other companies, including the newly<br />
acquired Brazilian business, have defined contribution or multiemployer plans. In Norway, <strong>Hydro</strong> closed its main defined<br />
benefit plans as from March 1, 2010 for new employees who became members of the new defined contribution retirement<br />
plans. Employees who were members of the defined benefit plans were given a choice to change to the new defined<br />
contribution plans as from June 1, 2010, of which approximately 20 percent chose the new plans. A settlement gain was<br />
recognized in the accounts in 2010.<br />
Amounts in NOK million 2011 2010<br />
Net periodic pension cost<br />
Defined benefit plans<br />
Benefits earned during the year, net of participants' contributions 342 343<br />
Interest cost on prior period benefit obligation 740 818<br />
Expected return on plan assets (641) (679)<br />
Recognized (gain) loss 7 (83)<br />
Past service cost 10 14<br />
Curtailment/settlement (gain) loss (129)<br />
Net periodic pension cost 457 285<br />
Defined contribution plans 79 44<br />
Multiemployer plans 35 50<br />
Termination benefits and other 89 207<br />
Total net periodic pension cost 660 586<br />
Change in projected benefit obligation (PBO)<br />
Projected benefit obligation at beginning of year (18 356) (17 922)<br />
Benefits earned during the year (347) (348)<br />
Interest cost on prior period benefit obligation (740) (818)<br />
Actuarial gain (loss) (1 817) (1 003)<br />
Plan amendments (5) (21)<br />
Benefits paid 844 845<br />
Curtailment/settlement gain (loss) 630<br />
Special termination benefits (43) (1)<br />
Divestments 7<br />
Foreign currency translation (22) 275<br />
Projected benefit obligation at end of year (20 486) (18 356)
Change in pension plan assets<br />
Amounts in NOK million 2011 2010<br />
Fair value of plan assets at beginning of year 12 536 12 234<br />
Actual return on plan assets 349 1 045<br />
Company contributions 166 132<br />
Plan participants' contributions 5 5<br />
Benefits paid (525) (525)<br />
Settlements (308)<br />
Divestments (5)<br />
Foreign currency translation 51 (41)<br />
Fair value of plan assets at end of year 12 582 12 536<br />
Status of pension plans reconciled to balance sheet<br />
Defined benefit plans<br />
Funded status of the plans at end of year (7 904) (5 820)<br />
Unrecognized net (gain) loss 864 (1 191)<br />
Unrecognized past service cost 6 11<br />
Net accrued pension recognized (7 033) (7 000)<br />
Termination benefits and other (470) (607)<br />
Total net accrued pension recognized (7 503) (7 607)<br />
Amounts recognized in the balance sheet consist of<br />
Prepaid pension 1 596 1 481<br />
Accrued pension liabilities (9 099) (9 088)<br />
Net amount recognized (7 503) (7 607)<br />
Weightedaverage assumptions used to determine net periodic pension cost<br />
Discount rate 4.1% 4.8%<br />
Expected return on plan assets 5.3% 6.0%<br />
Rate of compensation increase 2.7% 3.0%<br />
Weightedaverage assumptions used to determine pension obligation at end of year<br />
Discount rate 3.2% 4.1%<br />
Rate of compensation increase 2.5% 2.7%<br />
Analysis of projected benefit obligation (PBO)<br />
PBO arising from plans that are wholly or partly funded (12 983) (11 407)<br />
PBO arising from plans that are unfunded (7 503) (6 949)<br />
Total PBO (20 486) (18 356)<br />
Weightedaverage investment profile plan assets at end of year 1) allocation 2011 2010<br />
Asset category<br />
Equity securities 2231% 27% 31%<br />
Debt securities 3456% 38% 34%<br />
Real estate 21% 21% 21%<br />
Other 714% 14% 14%<br />
Total 100% 100%<br />
1) Property used by <strong>Hydro</strong> represents 20 percent of total plan assets at the end of 2011 and 2010.<br />
FINANCIAL STATEMENTS<br />
Note 32 - Employee retirement plans F47
F48<br />
FINANCIAL STATEMENTS<br />
Note 32 - Employee retirement plans<br />
Management of plan assets must comply with applicable laws and regulations in the countries where <strong>Hydro</strong> provides funded<br />
defined benefit plans. Within constraints imposed by laws and regulations, and given the assumed pension obligations and<br />
future contribution rates, the majority of assets are managed actively to obtain a long-term rate of return that at least reflects<br />
the chosen investment risk.<br />
Based on the current portfolio of plan assets the expected rate of return on plan assets is determined to be up to three<br />
percentage points above the yield on a portfolio of long-term high-quality debt instruments that receive one of the two highest<br />
ratings given by a recognized rating agency.<br />
In Norway, <strong>Hydro</strong> participates in a pension plan that entitles the majority of its Norwegian employees life-long benefits in<br />
addition to other plans, starting at the employees choice between the age of 62 and 75 years. The benefits are financed through a<br />
pooled arrangement by private sector employers ("avtalefestet pensjon, AFP") where also The Norwegian state contributes. The<br />
plan, which came into effect from January 1, 2011, is a defined benefit plan with limited funding and where plan assets are not<br />
segregated. The information required to calculate a proportional share of the plan and account for the plan as a defined benefit<br />
plan is not available from the plan administrator. <strong>Hydro</strong> therefore accounts for the plan as if it were a defined contribution<br />
plan. The employer contributions are included in Multiemployer plans. A previous plan providing early retirement benefits<br />
from the age of 62 until the age of 67 years for the same group of employees was closed as of December 31, 2010. Estimated<br />
remaining employer contributions to cover the plan deficit have been provided for.<br />
Social security tax imposed on pensions has been recognized and accrued for where applicable, together with social security tax<br />
imposed on other personnel benefits, and has not been treated as pensions.<br />
Other retirement benefits<br />
<strong>Hydro</strong> has unfunded retiree medical and life insurance plans for certain of its employees outside Norway. Related net periodic<br />
post retirement cost was NOK 0.3 million in 2011. The post retirement liability as of December 31, 2011 was NOK 73<br />
million and NOK 83 million in 2010.<br />
Note 33 - Deferred tax<br />
The tax effects of temporary differences and tax loss carryforwards giving rise to deferred tax assets and liabilities were as follows<br />
as of December 31, 2011 and December 31, 2010:<br />
Assets Liabilities Assets Liabilities<br />
Amounts in NOK million 2011 2011 2010 2010<br />
Marketable securities 1 2 <br />
Inventory valuation 166 (355) 125 (321)<br />
Accrued expenses 1 151 (1 256) 1 277 (1 426)<br />
Unrealized exchange (gains) losses 2 (272) 20 (264)<br />
Property, plant and equipment 3 640 (8 826) 3 091 (3 879)<br />
Ground rent surtax 115 137 <br />
Capitalized interest (51) (57)<br />
Other noncurrent assets 1 096 (857) 239 (316)<br />
Pensions 1 692 (445) 1 698 (466)<br />
Deferred (gains) losses on sales 19 (58) 8 (55)<br />
Derivatives 485 (50) 669 (102)<br />
Cash flow hedges (29) (8)<br />
Other 351 (264) 266 (265)<br />
Tax loss carryforwards 2 071 1 695<br />
Subtotal 10 789 (12 463) 9 227 (7 159)<br />
Of which not recognized as tax asset (1 791) (1 495)<br />
Gross deferred tax assets (liabilities) 8 998 (12 463) 7 732 (7 159)<br />
Recognition of deferred tax asset is based on expected taxable income in the near future.
At the end of 2011, <strong>Hydro</strong> had tax loss carryforwards of NOK 6,651 million, primarily in Brazil, the United States, Spain and<br />
Italy. Carry forward amounts expire as follows:<br />
Amounts in NOK million<br />
FINANCIAL STATEMENTS<br />
Note 33 - Deferred tax F49<br />
2012 53<br />
2013 31<br />
2014 22<br />
2015 121<br />
2016 30<br />
After 2016 2 248<br />
Without expiration 4 146<br />
Total tax loss carryforwards 6 651<br />
Note 34 - Shareholders' equity<br />
Share capital<br />
Number of shares<br />
Ordinary shares<br />
issued Treasury shares<br />
Ordinary shares<br />
outstanding<br />
December 31, 2009 1 240 110 211 (35 324 266) 1 204 785 945<br />
Treasury shares reissued to employees 1 937 196 1 937 196<br />
Shares issued 381 053 600 381 053 600<br />
December 31, 2010 1 621 163 811 (33 387 070) 1 587 776 741<br />
Treasury shares reissued to employees 847 813 847 813<br />
Shares issued 447 834 465 447 834 465<br />
December 31, 2011 2 068 998 276 (32 539 257) 2 036 459 019<br />
The share capital of Norsk <strong>Hydro</strong> ASA as of December 31, 2011 was NOK 2,271,760,107.04 consisting of 2,068,998,276<br />
ordinary shares at NOK 1.098 per share. The share capital as of December 31, 2010 was NOK 1,780,037,864.48 and the<br />
number of ordinary shares was 1,621,163,811.<br />
An extraordinary General Meeting on June 21, 2010 authorized the Board of Directors to issue new shares to Vale Austria<br />
Holdings as part of the consideration for the acquisition of Vale Aluminium. At completion of the transaction February 28,<br />
2011 shares representing 22 percent of the outstanding shares of Norsk <strong>Hydro</strong> ASA were issued to Vale Austria Holdings. In<br />
addition the extraordinary General Meeting on June 21, 2010 authorized a share capital increase of NOK 418,396,852.80 by<br />
issuance of 381,053,600 new shares at a price of NOK 26.30 in a rights issue completed on July 16, 2010. Gross proceeds<br />
from the rights issue was NOK 10,021,709,680. Share issue cost amounted to NOK 109 million after tax. A significant part of<br />
the proceeds were used as remaining part of the consideration for the acquisition of Vale Aluminium. See note 5 Acquisitions<br />
for further information.<br />
Treasury shares<br />
The number of treasury shares on December 31, 2011 was 32,539,257. The treasury shares may, pursuant to the decision of<br />
the General Meeting at the time these shares were acquired, be used as consideration in connection with commercial<br />
transactions or share schemes for the employees and representatives of the Corporate Assembly and the Board of Directors.<br />
The treasury shares amount per December 31, 2011 of NOK 1,084 million was comprised of NOK 36 million share capital<br />
and NOK 1,048 million retained earnings.<br />
Earnings per share<br />
Earnings per share is computed using net income attributable to <strong>Hydro</strong> shareholders and the weighted average number of<br />
outstanding shares in each year. The weighted average number of outstanding shares used for calculating basic and diluted<br />
earnings per share was 1,965,039,601 for the year 2011 and 1,419,052,116 for 2010.
F50<br />
FINANCIAL STATEMENTS<br />
Note 34 - Shareholders' equity<br />
The number of shares for the year 2010 until the rights issue was completed on July 16, 2010 and all previous presented<br />
periods were adjusted for the implicit rebate in the subscription price compared to the theoretical ex-rights price at closing on<br />
June 24, 2010, i.e. immediately before trading of the subscription rights. The adjustment represented a factor of 1.055 to the<br />
number of outstanding shares for all periods.<br />
<strong>Hydro</strong>'s outstanding founder certificates and subscription certificates entitle the holders to participate in any share capital<br />
increase, provided that the capital increase is not made in order to allot shares to third parties as compensation for their transfer<br />
of assets to <strong>Hydro</strong>. These certificates represent dilutive elements for the earnings per share computation.<br />
Change in Other components of equity<br />
The table below specifies the changes in Other components of equity for 2011 and 2010.<br />
Amounts in NOK million 2011 2010<br />
Currency translation differences<br />
January 1 (708) 223<br />
Currency translation differences during the year (2 408) (928)<br />
Reclassified to Net income on sale of foreign operations (856) (3)<br />
December 31 (3 972) (708)<br />
Unrealized gain (loss) on securities<br />
January 1 304 282<br />
Unrealized gain (loss) on availableforsale securities (411) 175<br />
Reclassified to Net income on sale or impairment of availableforsale securities (90)<br />
Tax benefit (expense) 151 (63)<br />
December 31 45 304<br />
Cash flow hedges See note 41 Derivative instruments and hedge accounting<br />
January 1 15 73<br />
Period gain (loss) recognized in Other comprehensive income 185 (69)<br />
Reclassification of hedging gain (loss) to Net income (107) (12)<br />
Tax benefit (expense) (20) 23<br />
December 31 74 15<br />
Other components of equity in equity accounted investments<br />
January 1 (170) 64<br />
Period gain (loss) recognized in Other comprehensive income (291) (225)<br />
Reclassified to Net income 2 (9)<br />
December 31 (459) (170)<br />
Total other components of equity attributable to <strong>Hydro</strong> shareholders as of December 31 (3 856) (418)<br />
Total other components of equity attributable to minority interests as of December 31 (456) (140)<br />
Note 35 - Capital management<br />
<strong>Hydro</strong>'s capital management policy is to maximize value creation over time, while maintaining a strong financial position and<br />
an investment grade credit rating.<br />
Credit rating<br />
To secure access to capital markets at attractive terms and remain financially solid, <strong>Hydro</strong> aims to maintain an investment<br />
grade credit rating from the leading agencies, Standard & Poor's (current rating BBB) and Moody's (current rating Baa2).<br />
<strong>Hydro</strong> targets, over the business cycle, a ratio of Adjusted funds from operations of at least 40 percent of Adjusted net interestbearing<br />
debt, and an Adjusted net interest-bearing debt to Adjusted equity ratio below 55 percent.
FINANCIAL STATEMENTS<br />
Note 35 - Capital management F51<br />
Liquidity management and funding<br />
<strong>Hydro</strong> manages its funding requirements centrally to cover group operating requirements and long-term capital needs. During<br />
2011 net cash provided by operations was sufficient to cover operating requirements and capital expenditures excluding<br />
acquisitions. Funds raised in the Norwegian commercial paper market and from short-term bank facilities were used to cover<br />
short term requirements throughout the year.<br />
<strong>Hydro</strong> has an ambition to access national and international capital markets as primary sources for external long-term funding.<br />
In 2010, <strong>Hydro</strong> raised NOK 10 billion in a rights issue in connection with the Vale Aluminium acquisition, contributing to<br />
liquidity holdings sufficient to cover a related cash payment amounting to USD 1.1 billion in February 2011. <strong>Hydro</strong> also<br />
issued new shares to Vale at closing, representing 22 percent of outstanding shares and assumed US dollar debt as part of the<br />
transaction.<br />
Funding of subsidiaries, associates and jointly controlled entities<br />
Normally the parent company, Norsk <strong>Hydro</strong> ASA, incurs debt and extends loans or equity to wholly-owned subsidiaries to<br />
fund capital requirements. <strong>Hydro</strong>'s policy is to finance part-owned subsidiaries and investments in associates and jointly<br />
controlled entities according to its ownership share, on equal terms with the other owners. All financing is executed on an<br />
arm's-length basis. Project financing is used for certain funding requirements mainly to mitigate risk while also considering<br />
partnership and other relevant factors.<br />
Shareholder return<br />
Shareholder return consists of dividends and share price development. <strong>Hydro</strong> aims to provide its shareholders with a<br />
competitive return compared with alternative investments in similar companies. Our policy is to distribute an average of 30<br />
percent of net income in the form of ordinary dividends over the business cycle. Dividends for a particular year are based on<br />
expected future earnings and cash flow, future investment opportunities, the outlook for world markets and <strong>Hydro</strong>'s current<br />
financial position. Share buybacks or extraordinary dividends may be used to supplement ordinary dividends during periods of<br />
strong financial results after considering the status of the business cycle and capital requirements for future growth.<br />
<strong>Hydro</strong>'s capital management measures<br />
<strong>Hydro</strong>'s management uses the Adjusted net interest-bearing debt to Adjusted equity ratio to assess the group's financial<br />
standing and outlook. Net interest-bearing debt is defined as <strong>Hydro</strong>'s short- and long-term interest-bearing debt adjusted for<br />
<strong>Hydro</strong>'s liquidity positions. Adjusted net interest-bearing debt is adjusted for liquidity positions regarded unavailable for<br />
servicing debt; other obligations which are considered debt-like in nature; and adjustments for the indebtedness of <strong>Hydro</strong>'s<br />
equity accounted investments. The adjustments are considered relevant because they affect <strong>Hydro</strong>'s ability to service existing<br />
debt and to incur additional debt. See table below for additional information related to the definition and measurement of this<br />
ratio.<br />
The ability to generate cash compared to financial liabilities is an important measure of risk exposure and financial stability.<br />
<strong>Hydro</strong>'s management uses Adjusted funds from operations and a ratio of Adjusted funds from operations to Adjusted net<br />
interest-bearing debt as capital management measures. Adjusted funds from operations is defined as Net income adjusted for<br />
non-cash items such as depreciation, amortization and impairments, and deferred taxes. Adjustments are also made for <strong>Hydro</strong>'s<br />
share of depreciation, amortization and impairments in its equity accounted investments as well as for unrealized effects on<br />
derivative contracts and certain other non-cash items.<br />
Adjusted net interest-bearing debt, Adjusted equity and Adjusted net interest-bearing debt to Adjusted equity ratio are<br />
presented in the following table.
F52<br />
FINANCIAL STATEMENTS<br />
Note 35 - Capital management<br />
Adjusted net interestbearing debt to equity<br />
Amounts in NOK million, except ratio 2011 2010<br />
Cash and cash equivalents 8 365 10 929<br />
Shortterm investments 1 780 1 321<br />
Bank loans and other interestbearing shortterm debt (4 248) (940)<br />
Longterm debt (4 190) (328)<br />
Net interestbearing debt 1 708 10 983<br />
Cash and cash equivalents and shortterm investments in captive insurance company 1)<br />
(1 329) (1 377)<br />
Net pension obligation at fair value, net of expected income tax benefit 2)<br />
(6 916) (5 607)<br />
Operating lease commitments, net of expected income tax benefit 3)<br />
(3 102) (1 746)<br />
Net interestbearing debt equity accounted investments 4)<br />
(7 388) (7 807)<br />
Short and longterm provisions net of expected income tax benefit, and other liabilites 5)<br />
(2 867) (872)<br />
Adjusted net interestbearing debt (19 895) (6 427)<br />
Total equity 85 168 57 443<br />
Net pension liability (asset) not recognized (871) 1 180<br />
Expected income tax liability (benefit) 261 (354)<br />
Adjusted equity 84 558 58 269<br />
Adjusted net interestbearing debt / Adjusted equity ratio 0.24 0.11<br />
1) Cash and cash equivalents and short-term investments in <strong>Hydro</strong>'s captive insurance company Industriforsikring AS are assumed to not be available to<br />
service or repay future <strong>Hydro</strong> debt, and are therefore excluded from the measure Adjusted net interest-bearing debt.<br />
2) Net pension liability at fair value is the total of both the recognized and unrecognized pension liability. The expected income tax benefit related to the net<br />
pension liability is defined as the total of the net deferred tax asset related to pensions as of December 31 and 30 percent of the unrecognized net pension<br />
liability as of December 31 and is NOK 1 508 million and NOK 878 million, respectively, for 2011 and 2010. The figure also includes the long-term provision<br />
for postretirement medical benefits of NOK 73 million, net of an estimated 30 percent expected tax benefit.<br />
3) Operating lease commitments are discounted using a rate of 3.4 percent and 3.8 percent for 2011 and 2010, respectively. The expected tax benefit on<br />
operating lease commitments is estimated at 30 percent.<br />
4) Net interest-bearing debt equity accounted investments is defined as the total of <strong>Hydro</strong>'s relative ownership percentage of each equity accounted<br />
investment's short and long-term interest-bearing debt less their cash positions, reduced by total outstanding loans from <strong>Hydro</strong> to the equity accounted<br />
investment. Net interest-bearing debt per individual equity accounted investment is limited to a floor of zero. Currently, the major part of the adjustment is<br />
related to Qatalum.<br />
5) Consists of <strong>Hydro</strong>'s short and long-term provisions related to exit and disposal activities, environmental clean-up, asset retirement obligations, net of an<br />
expected tax benefit estimated at 30 percent, and other non-current financial liabilities.<br />
Note 36 - Dividends<br />
<strong>Hydro</strong>'s Board of Directors normally proposes a dividend per share in connection with the fourth quarter results that are<br />
published in February each year. The <strong>Annual</strong> General Meeting considers this proposal, normally in May, and the approved<br />
dividend is then paid to the shareholders. Dividends are paid once each calendar year; generally occurring in May. For non-<br />
Norwegian shareholders, Norwegian withholding tax will be deducted at source in accordance with the applicable Norwegian<br />
tax regulations. For additional information related to <strong>Hydro</strong>'s dividend and shareholder policy see note 35 Capital<br />
management.<br />
For fiscal year 2011 the Board of Directors has proposed a dividend of NOK 0.75 per share to be paid in May 2012. The<br />
<strong>Annual</strong> General Meeting, scheduled to be held May 8, 2012, will consider this dividend proposal. If approved, this would be a<br />
total dividend of approximately NOK 1,527 million. In accordance with IFRS, the fiscal year 2011 proposed dividend is not<br />
recognized as a liability in the 2011 financial statements.
Dividends declared and paid in 2011 and 2010 for the prior fiscal year, respectively, are as follows:<br />
FINANCIAL STATEMENTS<br />
Note 36 - Dividends F53<br />
Paid in 2011 for fiscal<br />
year 2010<br />
Paid in 2010 for fiscal<br />
year 2009<br />
Dividend per share paid, NOK 0.75 0.50<br />
Total dividends paid, NOK million 1 527 603<br />
Date proposed February 16, 2011 February 17, 2010<br />
Date approved May 5, 2011 May 4, 2010<br />
Dividend payment date May 18, 2011 May 18, 2010<br />
Dividends paid to minority shareholders in <strong>Hydro</strong>'s subsidiaries are reported as dividends paid in Consolidated statements of<br />
changes in equity.<br />
Note 37 - Guarantees<br />
Amounts in NOK million 2011 2010<br />
Guarantees related to jointly controlled entities 7 708 7 668<br />
Sales guarantees 3 024 4 135<br />
Other guarantees 98 107<br />
Total guarantees not recognized 10 830 11 910<br />
Guarantees related to jointly controlled entities primarily relates to Qatalum. Qatar Petroleum and <strong>Hydro</strong> have issued a<br />
completion guarantee in favor of the lenders on a pro rata but not joint basis. The guarantee covers due and punctual payment<br />
of interest and repayments. The guarantee terminates when a set of objective criteria related to the completion of the project<br />
has been fulfilled.<br />
Guarantees in connection with the sale of companies, referred to as sales guarantees in the table above, reflect the maximum<br />
contractual amount that <strong>Hydro</strong> could be liable for in the event of certain defaults or the realization of specific uncertainties. In<br />
addition, <strong>Hydro</strong> has certain guarantees relating to sales of companies that are unspecified in amount and unlimited in time. No<br />
amounts relating to such guarantees are included in the table above. <strong>Hydro</strong> believes that the likelihood of any material liability<br />
arising from guarantees relating to sales of companies is remote. Historically, <strong>Hydro</strong> has not made any significant<br />
indemnification payments under such guarantees and no amount has been accrued in the consolidated financial statements.<br />
<strong>Hydro</strong> estimates that the fair value of guarantees related to sale of companies is immaterial.<br />
Note 38 - Contingent liabilities and contingent assets<br />
<strong>Hydro</strong> is involved in or threatened with various legal and tax matters arising in the ordinary course of business. <strong>Hydro</strong> is of the<br />
opinion that resulting liabilities, if any, will not have a material adverse effect on its consolidated results of operations, liquidity<br />
or financial position. See note 4 Critical accounting judgment and key sources of estimation uncertainty for additional<br />
information.<br />
<strong>Hydro</strong> has certain joint liabilities under Norwegian statutory regulations following from demergers. Under the Norwegian<br />
public limited companies act section 14-11, Norsk <strong>Hydro</strong> ASA and Statoil ASA are jointly liable for liabilities of Norsk <strong>Hydro</strong><br />
ASA and Norsk <strong>Hydro</strong> Produksjon AS accrued before the demerger date of October 1, 2007. This statutory liability is<br />
unlimited in time, but is limited in amount to the net value allocated to the non-defaulting party in the demerger. Similarly,<br />
Norsk <strong>Hydro</strong> ASA and Yara International ASA are jointly liable for liabilities accrued before the demerger date of March 24,<br />
2004 on the same conditions.<br />
In connection with the merger of <strong>Hydro</strong>'s petroleum activities with Statoil, Statoil assumed a share of 70 percent of the liability<br />
for any obligations related to activities that on the time of the demerger were no longer a part of <strong>Hydro</strong>, including among other<br />
things environmental obligations related to the former fertilizer and magnesium activities.
F54<br />
FINANCIAL STATEMENTS<br />
Note 39 - Contractual commitments and other commitments for future investments<br />
Note 39 - Contractual commitments and other commitments for future investments<br />
Additional authorized future investments include projects formally approved for development by the Board of Directors or<br />
management. General investment budgets are excluded from these amounts.<br />
Amounts in NOK million 2012<br />
Investments<br />
thereafter Total<br />
Contract commitments for investments in property, plant and equipment 379 285 663<br />
Additional authorized future investments in property, plant and equipment 947 41 988<br />
Contract commitments for other future investments 2 2<br />
Total 1 328 326 1 654<br />
<strong>Hydro</strong> has long-term contractual commitments for the purchase of aluminium, raw materials, electricity, and transportation in<br />
addition to long-term sales commitments. The future non-cancellable fixed and determinable obligation under these<br />
commitments as of December 31, 2011 is as follows:<br />
Amounts in NOK million<br />
Bauxite,<br />
alumina<br />
and<br />
aluminium<br />
Energy<br />
related Other<br />
Sales<br />
commitments<br />
2012 3 665 7 485 925 (11 588)<br />
2013 3 543 7 212 802 (7 991)<br />
2014 2 739 5 544 680 (6 400)<br />
2015 2 629 5 321 630 (4 997)<br />
2016 2 353 5 177 506 (3 318)<br />
Thereafter 27 737 29 820 3 579 (12 181)<br />
Total 42 666 60 558 7 121 (46 475)<br />
Amounts relating to contracts which are wholly or partly linked to market prices such as LME, are based on the spot price as of<br />
the balance sheet date.<br />
Long-term sales commitments mainly relate to alumina, aluminium and electricity. Amounts include commitments for the<br />
delivery of electricity from power stations that will revert to the Norwegian government amounting to 547 GWh in 2012 and<br />
15.4 TWh in total. Commitments relating to concession power from stations that are not subject to reversion amount to 249<br />
GWh annually.<br />
<strong>Hydro</strong> also has contractual commitments for the sales and purchase of products from part-owned entities. These commitments<br />
are excluded from the table above.<br />
<strong>Hydro</strong> also has other long-term purchase and sales commitments which include variable elements which are not included in the<br />
table above.
Note 40 - Financial instruments<br />
Financial instruments, and contracts accounted for as such, are in the balance sheet included in several line items and classified<br />
in categories for accounting treatment. Below a reconciliation of the financial instruments in <strong>Hydro</strong> is presented:<br />
Financial<br />
instruments Derivatives<br />
at fair value identified as Availablefor Other Nonfinancial<br />
through profit hedging Loans and sale financial financial assets and<br />
Amounts in NOK million or loss instruments receivables assets 1)<br />
liabilities liabilities Total<br />
2011<br />
Assets current<br />
Cash and cash equivalents 8 365 8 365<br />
Shortterm investments 1 780 1 780<br />
Accounts receivable 11 583 1 634 13 217<br />
Other current financial assets 666 666<br />
Assets noncurrent<br />
Investments accounted for using the<br />
equity method 219 11 223 11 442<br />
Other noncurrent assets 450 1 222 1 587 4 090 7 348<br />
Liabilities current<br />
Bank loans and other interestbearing<br />
shortterm debt 4 248 4 248<br />
Trade and other payables 7 376 4 939 12 316<br />
Other current financial liabilities 779 779<br />
Liabilities noncurrent<br />
Longterm debt 4 190 4 190<br />
Other noncurrent financial liabilities 1 467 1 476 2 943<br />
2010<br />
Assets current<br />
Cash and cash equivalents 10 929 10 929<br />
Shortterm investments 1 321 1 321<br />
Accounts receivable 11 569 1 214 12 783<br />
Other current financial assets 792 21 814<br />
Assets noncurrent<br />
Investments accounted for using the<br />
equity method 1 552 17 097 18 649<br />
Other noncurrent assets 446 1 436 1 509 3 391<br />
Liabilities current<br />
Bank loans and other interestbearing<br />
shortterm debt 940 940<br />
Trade and other payables 5 975 3 945 9 920<br />
Other current financial liabilities 1 217 75 1 292<br />
Liabilities noncurrent<br />
Longterm debt 328 328<br />
Other noncurrent financial liabilities 1 895 1 895<br />
1) Includes the investment in the independent pension trust Norsk <strong>Hydro</strong>s Pensjonskasse, carried at cost.<br />
The above specification relates to financial statement line items containing financial instruments.<br />
FINANCIAL STATEMENTS<br />
Note 40 - Financial instruments F55
F56<br />
Financial assets, classified as current and non-current, represent the maximum exposure <strong>Hydro</strong> has towards credit risk as at the<br />
reporting date.<br />
Realized and unrealized gains and losses from financial instruments and contracts accounted for as financial instruments are in<br />
the income statement included in several line items. Below is a reconciliation of the effects from <strong>Hydro</strong>'s financial instruments<br />
in the income statements:<br />
Financial<br />
instruments Derivatives<br />
at fair value identified as Availablefor Other Nonfinancial<br />
through profit hedging Loans and sale financial financial assets and<br />
Amounts in NOK million or loss instruments receivables assets liabilities liabilities Total 1)<br />
2011<br />
Income statement line item<br />
Revenue (752) (102) (854)<br />
Raw material and energy expense (238) (238)<br />
Financial income 43 13 2)<br />
56<br />
Financial expense 18 18<br />
Gain/loss directly in Other comprehensive income<br />
Recognized directly in Other<br />
comprehensive income (before tax) 411<br />
Removed from Other components of<br />
equity and recognized in the income<br />
statement <br />
2010<br />
FINANCIAL STATEMENTS<br />
Note 40 - Financial instruments<br />
Income statement line item<br />
Revenue (308) (11) (319)<br />
Raw material and energy expense 686 686<br />
Financial income (20) (123) 2)<br />
(143)<br />
Financial expense 5 5<br />
Gain/loss directly in Other comprehensive income<br />
Recognized directly in Other<br />
comprehensive income (before tax) (175)<br />
Removed from Other components of<br />
equity and recognized in the income<br />
statement 90<br />
1) Amount indicates the total gains and losses to financial instruments for each specific income statement line item.<br />
2) Includes dividends, realization of shares, and impairments from equity instruments classified as available-for-sale.<br />
Currency effects, with the exception of currency derivatives, are not included above. Negative amounts indicate a gain.<br />
The following is an overview of fair value measurements categorized on the basis of observability of significant measurement<br />
inputs. Certain items are valued on the basis of quoted prices in active markets for identical assets or liabilities (level 1 inputs),<br />
others are valued on the basis of inputs that are derived from observable prices (level 2 inputs), while certain positions are<br />
valued on the basis of judgmental assumptions that are to a limited degree or not at all based on observable market data (level 3<br />
inputs). The level in this fair value hierarchy within which measurements are categorized is determined on the basis of the<br />
lowest level input that is significant to the fair value measurement.
Amounts in NOK million 2011 Level 1 Level 2 Level 3 2010 Level 1 Level 2 Level 3<br />
Assets<br />
Commodity derivatives 1 067 556 124 387 1 166 840 169 156<br />
Currency derivatives 49 49 73 7 66 <br />
Cash flow hedges 21 21 <br />
Securities held for trading 1 301 425 855 22 1 321 391 905 25<br />
Available for sale financial assets 1 052 1 052 1 509 1 509<br />
Total 3 469 981 1 028 1 461 4 090 1 259 1 141 1 690<br />
Liabilities<br />
Commodity derivatives (2 224) (337) (123) (1 764) (3 051) (248) (606) (2 197)<br />
Currency derivatives (22) (22) (61) (61) <br />
Cash flow hedges (75) (75) <br />
Total (2 246) (337) (145) (1 764) (3 188) (323) (667) (2 197)<br />
The following is an overview in which changes in level 3 measurements are specified:<br />
Amounts in NOK million Assets Liabilities<br />
Securities<br />
held for<br />
trading<br />
Available for<br />
sale<br />
financial<br />
assets<br />
December 31, 2009 7 (1 765) 51 1 483<br />
Total gains (losses)<br />
in income statement 149 (847) (24) 101<br />
in Other comprehensive income 85<br />
Purchases 9<br />
Settlements 149 (3) (138)<br />
Currency translation difference (4) (32)<br />
December 31, 2010 156 (2 468) 25 1 509<br />
Change in accounting policy 271<br />
December 31, 2010 restated 156 (2 197) 25 1 509<br />
Total gains (losses)<br />
in income statement (206) 202 (7) (13)<br />
in Other comprehensive income (411)<br />
Acquisition through business combination 482 <br />
Purchases 7 1<br />
Issues (8) <br />
Settlements (37) 240 (2) <br />
Currency translation difference (8) (34)<br />
December 31, 2011 387 (1 764) 22 1 052<br />
Total gains (losses) for the period<br />
Total gains (losses) for the period included in the income<br />
statement for assets held at the end of the reporting period<br />
FINANCIAL STATEMENTS<br />
Note 40 - Financial instruments F57<br />
Commodity derivatives Investments<br />
(206) 202 (7) (13)<br />
(244) 441 (7) (12)<br />
Gains or losses relating to level 3 commodity derivatives appearing in the above are included in the income statement in Raw<br />
material and energy expense. Changes in fair value for embedded derivatives are reported as gains or losses for the period.<br />
Losses relating to available for sale assets are included in Financial income.<br />
Certain measurements classified as level 3 are highly sensitive to changes in assumptions, the effects of which would be<br />
material. Sensitivities relating to commodity derivatives are based on models utilized in the calculation of position balance as of<br />
December 31, adjusted for alternate assumptions. Please see note 6 Financial and commercial risk management for more detail<br />
on valuation methodology and limitations inherent in the analysis. The following is an overview of such sensitivity:
F58<br />
FINANCIAL STATEMENTS<br />
Note 40 - Financial instruments<br />
Amounts in NOK million USD Aluminium<br />
Gain (loss) from 10 percent increase in Gain (loss) from 10 percent decrease in<br />
Other<br />
commodity<br />
Interest<br />
rates USD Aluminium<br />
Other<br />
commodity<br />
Interest<br />
rates<br />
Commodity derivatives (510) (83) (287) (13) 510 119 287 20<br />
Available for sale financial assets 421 231 (42) 183 (231) 45<br />
Note 41 - Derivative instruments and hedge accounting<br />
Derivative instruments, whether physically or financially settled, are accounted for under IAS 39. All derivative instruments are<br />
accounted for on the balance sheet at fair value with changes in the fair value of derivative instruments recognized in the<br />
income statement, unless specific hedge criteria are met. Some of <strong>Hydro</strong>'s commodity contracts are deemed to be derivatives<br />
under IFRS. For further explanation on which physical commodity contracts that are accounted for as derivatives, and which<br />
are considered own use, see note 1 Significant accounting policies and reporting entity.<br />
Commodity derivatives<br />
The following types of commodity derivatives were recorded at fair value on the balance sheet as of December 31, 2011 and<br />
December 31, 2010. Contracts that are designated as hedging instruments in cash flow hedges are not included. The<br />
presentation of fair values for electricity and aluminium contracts shown in the table below include the fair value of traditional<br />
derivative instruments such as futures, forwards and swaps, in conjunction with the physical contracts accounted for at fair<br />
value.<br />
Amounts in NOK million 2011 2010<br />
Assets<br />
Electricity contracts 127 265<br />
Aluminium futures, forwards and options 940 901<br />
Total 1 067 1 166<br />
Liabilities<br />
Electricity contracts (77) (314)<br />
Coal forwards (1 803) (1 698)<br />
Aluminium futures, forwards and options (474) (961)<br />
Other 129 (77)<br />
Total (2 224) (3 051)<br />
The underlying commodities for bifurcated embedded derivatives are included.<br />
Changes in the fair value of commodity derivatives are included in operating revenues or cost of goods sold.<br />
Currency derivatives<br />
The following types of financial derivatives were recorded at fair value on the balance sheet as of December 31, 2011 and<br />
December 31, 2010.<br />
Amounts in NOK million 2011 2010<br />
Assets<br />
Embedded currency derivatives 49 66<br />
Equity warrants 7<br />
Total 49 73<br />
Liabilities<br />
Currency forwards and swaps (45)<br />
Embedded currency derivatives (22) (16)<br />
Total (22) (61)
FINANCIAL STATEMENTS<br />
Note 41 - Derivative instruments and hedge accounting F59<br />
Unless used in connection with hedge accounting, changes in the fair value of currency derivatives are included in Financial<br />
expense, net, in the income statement.<br />
Embedded derivatives<br />
Some contracts contain pricing links that affect cash flows in a manner different than the underlying commodity or financial<br />
instrument in the contract. For accounting purposes, these embedded derivatives are in some circumstances separated from the<br />
host contract and recognized at fair value. <strong>Hydro</strong> has separated and recognized at fair value embedded derivatives related to<br />
aluminium, inflation and coal links, in addition to currency forwards, from the underlying contracts.<br />
Cash flow hedges<br />
<strong>Hydro</strong> has periodically entered into hedge programs to secure the price of aluminium and alumina to be sold. Aluminium<br />
futures, options and swaps on the London Metal Exchange and with external banks have been used for this purpose. Certain of<br />
these hedge programs have been accounted for as cash flow hedges, where gains and losses on the hedge derivatives are<br />
recognized in Other Comprehensive Income, and accumulated in the hedging reserve in equity and will be reclassified into<br />
operating revenues when the corresponding forecasted sale of aluminium or alumina is recognized.<br />
In anticipation of the Vale transaction, <strong>Hydro</strong> entered into forward and option instruments in 2010 relating to sales of alumina<br />
and aluminium to be produced in the Vale Aluminium entities Alunorte and Albras acquired February 28, 2011, see note 5<br />
Acquisitions. Hedge accounting was applied for these instruments from July 1, 2011. At the end of 2011, this cash flow hedge<br />
program had expired. No new cash flow hedges were entered into during 2011.<br />
Ineffectiveness amounting to NOK 21 million was recognized in the income statement in 2010. No ineffectiveness was<br />
recognized in 2011 in connection with cash flow hedges.<br />
The table below gives aggregated numbers related to the aluminium cash flow hedges for the period 2010 to 2011.<br />
2012 2011 2010<br />
Aluminium sold forward with hedge accounting (kmt) 1)<br />
1 593<br />
of which open at yearend (kmt) 2)<br />
1 593<br />
Average prices achieved in hedges in USD (per mt) 3)<br />
2 445<br />
Expected to be reclassified to the income statement during the year (NOK million) 5 (54) 4<br />
Reclassified to the income statement from Other components of equity (NOK million) 4)<br />
77 8<br />
1) Remaining volume sold forward at inception of hedge programs. There are no remaining volumes at the end of 2011.<br />
2) Including closed out positions / repurchases of hedge derivatives.<br />
3) Weighted average of remaining volume sold forward at inception of hedge program.<br />
4) Deviates from expected reclassifications due to changes in market prices throughout the year. Negative amounts indicate a loss.<br />
<strong>Hydro</strong> hedged the foreign currency exposure between US and Canadian dollar in connection with an expansion at the Alouette<br />
plant in Canada over the period March 2003 to March 2006. An annual gain NOK 5 million, corresponding to NOK 3<br />
million after tax, has been reclassified each year, including 2011 and 2010, and is expected to be reclassified in future years<br />
until 2014.<br />
As of December 31, 2010 an asset of NOK 21 million and a liability of NOK 75 million were recognized on the balance sheet<br />
as fair value of hedging instruments. No such hedging instruments were recognized as of December 31, 2011.<br />
<strong>Hydro</strong> performs trading operations to reduce currency exposures on commodity positions. The effect of such operations is<br />
recognized as a part of Financial expense in the income statement.<br />
For the after tax movement in <strong>Hydro</strong> equity relating to cash-flow hedges for 2011 and 2010, please see note 34 Shareholders'<br />
equity.
F60<br />
FINANCIAL STATEMENTS<br />
Note 41 - Derivative instruments and hedge accounting<br />
Fair Value of Derivative Instruments<br />
The fair market value of derivative financial instruments such as currency forwards and swaps is based on quoted market prices.<br />
The fair market value of aluminium and electricity futures/forwards and option contracts is based on quoted market prices<br />
obtained from the London Metals Exchange and NASDAQ OMX Commodities Europe (formerly Nord Pool)/EEX<br />
(European Energy Exchange) respectively. The fair value of other commodity over-the-counter contracts and swaps is based on<br />
quoted market prices, estimates obtained from brokers and other appropriate valuation techniques. Where long-term physical<br />
delivery commodity contracts are recognized at fair value in accordance with IAS 39, such fair market values are based on<br />
quoted forward prices in the market and assumptions of forward prices and margins where market prices are not available.<br />
<strong>Hydro</strong> takes credit-spread into consideration when valuating positions when necessary.<br />
For further information on fair values, see note 3 Basis of presentation and measurement of fair value. See note 40 Financial<br />
instruments for a specification of the classification of derivative positions according to a fair value hierarchy.<br />
Note 42 - Cash flow information<br />
Reconciliation of cash and cash equivalents<br />
Amounts in NOK million 2011 2010<br />
Cash and cash equivalents 8 365 10 929<br />
Bank overdraft (21) (194)<br />
Cash, cash equivalents and bank overdraft 8 344 10 735<br />
Cash disbursements and receipts included in cash from operations<br />
Amounts in NOK million 2011 2010<br />
Income taxes paid 1 654 787<br />
Interest paid 317 246<br />
Interest received 263 201<br />
Other dividends received 7 23<br />
Note 43 - Auditor remuneration<br />
KPMG AS is the Group auditor of Norsk <strong>Hydro</strong> ASA. KPMG succeeded Deloitte AS as the Group auditor with effect from<br />
the fiscal year 2010.<br />
The following table shows fees to KPMG for 2011 and fees to KPMG and Deloitte for 2010. For all categories the reported fee<br />
is the recognized expense for the year. Fees to KPMG for 2011 and 2010 include fee related to the share issues, recognized<br />
directly in equity.
Amounts in NOK million Audit<br />
Audit<br />
related<br />
FINANCIAL STATEMENTS<br />
Note 43 - Auditor remuneration F61<br />
Other<br />
services<br />
Tax<br />
related Total<br />
KPMG 2011<br />
Norway 10 1 1 12<br />
Outside Norway 14 1 15<br />
Total 24 2 1 28<br />
KPMG 2010<br />
Norway 5 5<br />
Outside Norway 9 1 10<br />
Total 14 1 15<br />
Deloitte 2010<br />
Norway 4 3 1 1 8<br />
Outside Norway 9 1 11<br />
Total 13 3 1 1 18<br />
Note 44 - Board of Directors and Corporate Assembly<br />
Board of Directors' remuneration and share ownership<br />
Normally, the remuneration to the Board of Directors consists of the payment of fees. In addition, board members receive a<br />
gift when leaving the board. Board members do not have any incentive or share-based compensation. <strong>Hydro</strong> has not made any<br />
guarantees on behalf of any of the board members. The only board members with loans are the employee-elected members of<br />
the board.<br />
Fees are based on the position of the board members and board committee assignments. <strong>Annual</strong> fees for 2011 for the<br />
chairperson of the board, deputy chairperson and directors are NOK 550,000 (2010: NOK 530,000), NOK 345,000 (2010:<br />
NOK 330,000) and NOK 300,000 (2010: NOK 290,000), respectively. The chairperson of the audit committee and the<br />
chairperson of the compensation committee receive an additional NOK 175,000 (2010: NOK 170,000) and NOK 31,000<br />
(2010: NOK 30,000) annually in fees, respectively, and audit and compensation committee members receive NOK 113,500<br />
(2010: NOK 110,000) and NOK 26,000 (2010: NOK 25,000) annually, respectively, for their participation on these<br />
committees.<br />
Total board fees and individual board member fees for 2011, and outstanding loans and board member share ownership as of<br />
December 31, 2011, are presented in the tables below. Board fees for extraordinary meetings held during 2008 were paid in<br />
2010.<br />
Board of Directors' fees<br />
Amounts in NOK thousand 2011 2010<br />
Fees and other remuneration paid to board members during the year 3 824 3 956<br />
Fees paid in prior year for service rendered in current year 24 <br />
Fees paid during the year for service rendered in other years (16) (579)<br />
Fees related to board service during the year not yet paid 7<br />
Total fees for board services provided to <strong>Hydro</strong> during the year 3 832 3 384<br />
Fees and other remuneration normal board activities 3 245 2 841<br />
Fees compensation committee 109 80<br />
Fees audit committee 478 463<br />
Total fees for board services provided to <strong>Hydro</strong> during the year 3 832 3 384
F62<br />
FINANCIAL STATEMENTS<br />
Note 44 - Board of Directors and Corporate Assembly<br />
Board member Board fees 1)<br />
Board members as of December 31, 2011<br />
Terje Vareberg 4)<br />
Bente Rathe 5)<br />
Finn Jebsen 6)<br />
Inge K. Hansen 7)<br />
Eva Persson 8)<br />
Liv Monica Stubholt 6)<br />
Tito Martins 9)<br />
10) 11)<br />
Billy Fredagsvik<br />
6) 10)<br />
Sten Roar Martinsen<br />
10) 12)<br />
Ove Ellefsen<br />
Outstanding<br />
loans<br />
1) 2)<br />
Number of<br />
shares 3)<br />
581 18 391<br />
459 29 000<br />
326 53 406<br />
475 12 000<br />
389 <br />
326 <br />
250 <br />
338 96 2 159<br />
326 3 215<br />
175 2 544<br />
10) 13)<br />
Jørn B. Lilleby 172 33 2 074<br />
Heidi M. Petersen 14)<br />
Board members during 2011 and 2010, not on the board as of December 31, 2011<br />
7 10 000<br />
Total 3 824 129 132 789<br />
1) Amounts in NOK thousand.<br />
2) Loans are extended to board members who are also <strong>Hydro</strong> employees under an employee benefit scheme available to all employees in Norway. The loans<br />
to Billy Fredagsvik have an interest rate of 3.9-7.25 percent and a repayment period of 1-7 years. The loan to Jørn Lilleby has an interest rate of 3.9 percent<br />
and a repayment period of 2 years. All payments have been made in a timely fashion and in accordance with the agreed payment schedule. Loans have not<br />
been extended to related parties.<br />
3) Number of shares owned as of December 31, 2011 for board members as of December 31, 2011; otherwise it is the number of shares owned as of the<br />
date the individual stepped down from the Board of Directors. Shareholdings disclosed include shares held by close members of family and controlled<br />
entities, in addition to shares held directly by the board member/former board member.<br />
4) Chairperson of the board and chairperson of the board compensation committee.<br />
5) Deputy chairperson of the board and member of the board audit committee.<br />
6) Member of the board compensation committee.<br />
7) Chairperson of the board audit committee.<br />
8) Member of the board audit committee.<br />
9) Member of the board as of February 28, 2011.<br />
10) Employee representative on the board elected by the employees in accordance with Norwegian Company Law. As such, these individuals also are paid<br />
regular salary, remuneration in kind and pension benefits that are not included in the table above.<br />
11) Member of the board audit committee as of October 1, 2011.<br />
12) Member of the board as of May 13, 2011.<br />
13) Member of the board and member of the board audit committee until May 13, 2011.<br />
14) Member of the board and member of the board compensation committee in 2010.<br />
Corporate Assembly<br />
Corporate Assembly members owned 284,769 shares as of December 31, 2011. Loans to Corporate Assembly members were<br />
extended under an employee benefit scheme that is available to all employees in Norway. Loans outstanding to Corporate<br />
Assembly members who are also <strong>Hydro</strong> employees totaled NOK 762 thousand as of December 31, 2011. The interest rate on<br />
these loans is between 3.90 and 7.25 percent and the repayment period is between two and 22 years.<br />
Note 45 - Related party information<br />
As of December 31, 2011, The Norwegian state owned 39.1 percent of the total shares outstanding (2010: 50.9 percent). This<br />
comprises the combined holdings of the Ministry of Trade and Industry and the holdings of Folketrygdfondet, which manages<br />
the Government Pension Fund - Norway. There are no preferential voting rights associated with the ordinary shares held by<br />
the Norwegian State. <strong>Hydro</strong> has concluded that the Norwegian state's shareholding represents significant interest in <strong>Hydro</strong>,<br />
and that the State thus is a related party.<br />
As of December 31, 2011, Vale Austria Holdings GmbH, a wholly owned subsidiary of Vale S.A. owned 22 percent of the<br />
outstanding shares in Norsk <strong>Hydro</strong> ASA. The shares were issued as consideration for <strong>Hydro</strong>'s acquisition of Vale Aluminium,<br />
see note 5 Acquisitions. <strong>Hydro</strong> has concluded that the Vale's shareholding represents significant influence in <strong>Hydro</strong>, and that<br />
Vale thus is a related party.
Long-term purchase contracts for bauxite with Vale were entered into as part of the acquisition. The contracts provides <strong>Hydro</strong><br />
right and obligation to purchase bauxite from Vale at a price formula consisting of a fixed element and a variable element<br />
linked to the price of aluminium and alumina. In addition, some service and supply arrangements for the newly acquired<br />
entities with Vale S.A and its subsidiaries exists. The majority of these arrangements are of a transitional nature.<br />
The Norwegian state has ownership interests in a substantial number of companies. The ownership interests in 52 companies<br />
are managed by the ministries and covered by public information from the Ministry of Trade and Industry 1). For the purpose<br />
of this disclosure we have not assessed which of these companies that are controlled by the State. <strong>Hydro</strong> has business<br />
transactions with a number of these companies, including purchase of power from Statkraft SF. Generally, transactions are<br />
agreed independent of the common control exercised by the State.<br />
<strong>Hydro</strong> completed a rights issue in July 2010. The Ministry of Trade and Industry participated in the rights issue for its relative<br />
share. Folketrygdfondet subscribed and underwrote for its pro rata share of the rights issue. Both shareholders participated at<br />
the same price as other shareholders.<br />
A significant share of <strong>Hydro</strong>'s defined benefit post-employment plans is managed by the independent pension trust, Norsk<br />
<strong>Hydro</strong> Pensjonskasse. This trust owns some of the office buildings rented by <strong>Hydro</strong>. The rental arrangements are based on<br />
market price benchmarks and has a remaining life of around 9 years. <strong>Hydro</strong> has paid a total rental of NOK 192 million and<br />
NOK 189 million for 2011 and 2010, respectively. In addition, <strong>Hydro</strong> is involved with pension trusts in Great Britain and<br />
some other countries. There are no similar arrangements with those trusts.<br />
The members of <strong>Hydro</strong>'s board of directors during 2011 and 2010 are stated in note 44 Board of Directors and Corporate<br />
Assembly, where their remuneration and share ownership is outlined. Some of the board members or their close members of<br />
family serve as board members or executive directors in other companies. In addition, some members of <strong>Hydro</strong>'s corporate<br />
management board or their close members of family serve as board members in other companies. <strong>Hydro</strong> has not identified any<br />
transactions where the relationship is known to have influenced the transaction. Some close family members of members of<br />
<strong>Hydro</strong>'s management are employed in non-executive positions in <strong>Hydro</strong>.<br />
<strong>Hydro</strong>'s significant associated companies and transactions with those companies are described in note 25 Investments in<br />
associates. <strong>Hydro</strong>'s significant jointly controlled entities and transactions with those entities are described in note 26<br />
Investments in jointly controlled entities. <strong>Hydro</strong> has joint venture arrangements with a number of other companies. Generally,<br />
the relationships are limited to a combined effort within a limited area. <strong>Hydro</strong> considers the joint venture partners as<br />
competitors in other business transactions, and do not see these relationships as related party relationships.<br />
1) According to information on the Government web site www.regjeringen.no, state ownership<br />
FINANCIAL STATEMENTS<br />
Note 45 - Related party information F63
F64<br />
FINANCIAL STATEMENTS<br />
Financial statements Norsk <strong>Hydro</strong> ASA<br />
Financial statements Norsk <strong>Hydro</strong> ASA<br />
Income statements<br />
Amounts in NOK million Notes 2011 2010<br />
Revenue 311 310<br />
Gain (loss) on sale of subsidiaries and associates, net (8) <br />
Total revenue and income 303 310<br />
Employee benefit expense 2, 3 341 473<br />
Depreciation and amortization expense 4, 5 25 19<br />
Impairment of noncurrent assets 5 21 <br />
Other 280 232<br />
Total operating expenses 668 724<br />
Operating loss (365) (414)<br />
Financial income, net 6 3 750 2 794<br />
Income (loss) before tax 3 386 2 380<br />
Income taxes 7 (773) (668)<br />
Net income 2 613 1 712<br />
Appropriation of net income and equity transfers<br />
Dividend proposed (1 527) (1 527)<br />
Retained earnings (1 086) (186)<br />
Total appropriation (2 613) (1 712)<br />
The accompanying notes are an integral part of the financial statements.
Balance sheets<br />
Amounts in NOK million, December 31 Notes 2011 2010<br />
Assets<br />
Deferred tax asset 7 266<br />
Other intangible assets 5 47 56<br />
Intangible assets 47 322<br />
Property, plant and equipment 4 191 205<br />
Shares in subsidiaries 8 56 695 30 451<br />
Intercompany receivables 23 040 18 602<br />
Prepaid pension, investments and other noncurrent assets 2, 9, 10 2 579 2 512<br />
Total financial noncurrent assets 82 314 51 564<br />
Intercompany receivables 6 974 6 141<br />
Prepaid expenses and other current assets 10 163 245<br />
Cash and cash equivalents 6 322 9 556<br />
Total current assets 13 459 15 943<br />
Total assets 96 011 68 035<br />
Equity and liabilities<br />
Paidin capital<br />
Share capital 13 2 272 1 780<br />
Treasury shares 13 (36) (37)<br />
Paidin premium 13 28 987 9 495<br />
Other paidin capital 13 69 58<br />
Retained earnings<br />
Retained earnings 13 29 030 27 945<br />
Treasury shares 13 (1 048) (1 076)<br />
Equity 13 59 274 38 165<br />
Longterm provisions 2 2 420 2 350<br />
Longterm debt 12 2 589 233<br />
Intercompany payables 5 700 319<br />
Other longterm liabilities 8 288 552<br />
Bank loans and other interestbearing shortterm debt 10 590 421<br />
Dividends payable 1 527 1 527<br />
Intercompany payables 22 362 23 396<br />
Other current liabilities 1 549 1 624<br />
Total current liabilities 26 029 26 968<br />
Total equity and liabilities 96 011 68 035<br />
The accompanying notes are an integral part of the financial statements.<br />
FINANCIAL STATEMENTS<br />
Financial statements Norsk <strong>Hydro</strong> ASA F65
F66<br />
FINANCIAL STATEMENTS<br />
Financial statements Norsk <strong>Hydro</strong> ASA<br />
Statements of cash flows<br />
Amounts in NOK million 2011 2010<br />
Net income 2 613 1 712<br />
Depreciation, amortization and impairment 46 19<br />
Gain on sale of noncurrent assets, net (16) (118)<br />
Other adjustments (297) (2 000)<br />
Net cash provided by (used in) operating activities 2 346 (387)<br />
Investments in subsidiaries (26 354) (433)<br />
Sales of subsidiaries 20 114 <br />
Net sales of other investments 31 122<br />
Net cash used in investing activities (6 209) (311)<br />
Dividends paid (1 527) (603)<br />
Proceeds from shares issued 26 9 910<br />
Other financing activities, net 2 220 (634)<br />
Net cash provided by financing activities 719 8 673<br />
Foreign currency effects on cash (90) (111)<br />
Net increase (decrease) in cash and cash equivalents (3 234) 7 864<br />
Cash and cash equivalents at beginning of year 9 556 1 692<br />
Cash and cash equivalents at end of year 6 322 9 556<br />
The accompanying notes are an integral part of the financial statements.
Notes to the financial statements Norsk <strong>Hydro</strong> ASA<br />
FINANCIAL STATEMENTS<br />
Notes to the financial statements Norsk <strong>Hydro</strong> ASA F67<br />
Note 1 - Summary of significant accounting policies<br />
The financial statements of Norsk <strong>Hydro</strong> ASA are prepared in accordance with the Norwegian accounting act and accounting<br />
principles generally accepted in Norway (N GAAP). Financial statement preparation requires management to make estimates<br />
and assumptions that affect the reported amounts of assets, liabilities, revenues and expenses as well as disclosures of<br />
contingencies. Actual results may differ from estimates. Interest rates used when performing any net present value analysis, or<br />
measurement of post retirement obligations, are rounded to the nearest 25 basis points. As a result of rounding adjustments,<br />
the figures in one or more columns included in the financial statements may not add up to the total of that column.<br />
Shares in subsidiaries, associates and jointly controlled entities<br />
Shares in subsidiaries, associates and jointly controlled entities are presented according to the cost method. Group relief<br />
received is included in dividends from subsidiaries. Dividends from subsidiaries is recognized in the year for which it is<br />
proposed by the subsidiary to the extent Norsk <strong>Hydro</strong> ASA can control the decision of the subsidiary through its share<br />
holdings. Shares in subsidiaries, associates and jointly controlled entities are reviewed for impairment whenever events or<br />
changes in circumstances indicate that the carrying amount may exceed the fair value of the investment. An impairment loss is<br />
reversed if the impairment situation is deemed to no longer exist.<br />
Employee retirement plans<br />
Norsk <strong>Hydro</strong> ASA has adopted the alternative treatment allowed in NRS 6 whereby employee retirement plans are measured as<br />
required by IAS 19, see note 1 Significant accounting policies and reporting entity to the consolidated financial statements for<br />
additional information.<br />
Foreign currency transactions<br />
Realized and unrealized currency gains or losses on transactions are included in Financial income, net. Similarly, unrealized<br />
currency gains or losses on assets and liabilities denominated in a currency other than the Norwegian kroner are also included<br />
in Financial income, net. This is in accordance with NRS' preliminary standard on transactions and accounts in foreign<br />
currency.<br />
Cash and cash equivalents<br />
Cash and cash equivalents includes cash, bank deposits and all other monetary instruments with a maturity of less than three<br />
months at the date of purchase.<br />
Short-term investments<br />
Short-term investments includes bank deposits and all other monetary instruments with a maturity between three and twelve<br />
months at the date of purchase and current marketable equity and debt securities. Such securities are considered trading<br />
securities and are valued at fair value. The resulting unrealized holding gains and losses are included in Financial income, net.<br />
Investment income is recognized when earned.<br />
Property, plant and equipment<br />
Property, plant and equipment is carried at historical cost less accumulated depreciation and impairment losses. According to<br />
NRS' preliminary standard regarding impairment of non-current assets such assets are reviewed for impairment whenever<br />
events or changes in circumstances indicate that the carrying amount may not be recoverable. The impairment of long-lived<br />
assets is recognized when the recoverable amount determined as the higher of fair value less cost to sell or value in use of the<br />
asset or group of assets is less than the carrying value. The amount of the impairment is the difference between the carrying<br />
value and the recoverable amount. An impairment loss is reversed if the impairment situation is deemed to no longer exist.<br />
Intangible assets<br />
Intangible assets acquired individually or as a group are recognized at fair value when acquired, in accordance with NRS'<br />
preliminary standard on intangible assets. Intangible assets are amortized on a straight-line basis over their useful life and tested<br />
for impairment whenever indications of impairment are present.<br />
Norsk <strong>Hydro</strong> ASA accounts for CO 2 emission allowances at cost as an intangible asset. The emission rights are not amortized,<br />
impairment testing is done on an annual basis. Sale of CO 2 emission rights is recognized at the time of sale at the transaction<br />
price.
F68<br />
FINANCIAL STATEMENTS<br />
Note 1 - Summary of significant accounting policies<br />
Research and development<br />
Research costs are expensed as incurred. Development costs are capitalized as an intangible asset at cost if, and only if, (a) it is<br />
probable that the future economic benefit that is attributable to the asset will flow to the enterprise; and (b) the cost of the asset<br />
can be measured reliably. To the extent development costs are directly contributing to the construction of a fixed asset, the<br />
development costs are capitalized as part of the asset provided all criteria for capitalization are met.<br />
Derivative instruments<br />
Forward currency contracts and currency options are recognized in the financial statements and measured at fair value at each<br />
balance sheet date with the resulting unrealized gain or loss recorded in Financial income, net.<br />
Contingencies and guarantees<br />
Norsk <strong>Hydro</strong> ASA recognizes a liability for the fair value of obligations it has undertaken in issuing guarantees. Contingencies<br />
are recognized in the financial statements when probable of occurrence and can be estimated reliably.<br />
Share-based compensation<br />
Norsk <strong>Hydro</strong> ASA accounts for share-based payment in accordance with NRS 15A Share-Based Payment. NRS requires sharebased<br />
payments to be accounted for as required by IFRS 2 Share-based Payment, see note 1 Significant accounting policies and<br />
reporting entity to the consolidated accounts for additional information.<br />
Risk management<br />
For information about risk management in Norsk <strong>Hydro</strong> ASA see note 6 Financial and commercial risk management to the<br />
consolidated financial statements.<br />
Income taxes<br />
Deferred income tax expense is calculated using the liability method in accordance with the NRS's preliminary standard on<br />
Income Taxes. Under the liability method, deferred tax assets and liabilities are measured based on the differences between the<br />
carrying values of assets and liabilities for financial reporting and their tax basis which are considered temporary in nature.<br />
Deferred income tax expense represents the change in deferred tax assets and liability balances during the year. Changes<br />
resulting from amendments and revisions in tax laws and tax rates are recognized when the new tax laws or rates become<br />
effective.<br />
The tax effect of equity transactions, such as group contribution given, is recognized as a part of the equity transaction and do<br />
not affect the income tax expense.<br />
Note 2 - Employee retirement plans<br />
Norsk <strong>Hydro</strong> ASA is affiliated with the <strong>Hydro</strong> Group's Norwegian pension plans. The defined benefit plans are administered<br />
by Norsk <strong>Hydro</strong>'s independent pension trust. The defined benefit plans were closed as of March 1, 2010 for new employees<br />
who became members of the new defined contribution plans. Employees who were members of the defined benefit plans were<br />
given a choice to change to the defined contribution plans as of June 1, 2010, of which approximately 25 percent chose the<br />
new plans. A settlement gain was recognized in the accounts in 2010. The defined contribution plans are administered by the<br />
external Norwegian pension provider Storebrand. Norsk <strong>Hydro</strong> ASA's defined benefit plans covered 5,001 participants as of<br />
December 31, 2011 and 5,212 participants as of December 31, 2010, while the defined contribution plans covered 179<br />
participants as of December 31, 2011 and 202 participants as of December 31, 2010. The plans comply with minimum<br />
requirements for pension plans in Norway.<br />
Norsk <strong>Hydro</strong> ASA participates in a pension plan that entitles its employees life-long benefits in addition to other plans, starting<br />
at the employees choice between the age of 62 and 75 years. The benefits are financed through a pooled arrangement by private<br />
sector employers ("avtalefestet pensjon, AFP") where also The Norwegian state contributes. The plan, which came into effect<br />
from January 1, 2011, is a defined benefit plan with limited funding and where plan assets are not segregated. The information<br />
required to calculate a proportional share of the plan and account for the plan as a defined benefit plan is not available from the<br />
plan administrator. <strong>Hydro</strong> therefore accounts for the plan as if it were a defined contribution plan. The employer contributions<br />
are included in Multiemployer plans. A previous plan providing early retirement benefits from the age of 62 until the age of 67<br />
years for the same group of employees was closed as of December 31, 2010. Estimated remaining employer contributions to<br />
cover the plan deficit have been provided for.
Net periodic pension cost<br />
Amounts in NOK million 2011 2010<br />
Defined benefit plans<br />
Benefits earned during the year 89 94<br />
Interest cost on prior period benefit obligation 211 248<br />
Expected return on plan assets (278) (300)<br />
Recognized (gain) loss <br />
Past service cost 6 8<br />
Curtailment/settlement (gain) loss (16)<br />
Net periodic pension cost 27 35<br />
Defined contribution plans 7 4<br />
Multiemployer plans 6 6<br />
Termination benefits and other 20 46<br />
Total net periodic pension cost 61 92<br />
Change in projected benefit obligation (PBO)<br />
Amounts in NOK million 2011 2010<br />
Projected benefit obligation at beginning of year (5 778) (5 738)<br />
Benefits earned during the year (89) (94)<br />
Interest cost on prior period benefit obligation (211) (248)<br />
Actuarial gain (loss) (627) (179)<br />
Plan amendments (1) (16)<br />
Benefits paid 324 325<br />
Curtailment/settlement gain (loss) 173<br />
Special termination benefits (18) (1)<br />
Projected benefit obligation at end of year (6 400) (5 778)<br />
Change in pension plan assets<br />
FINANCIAL STATEMENTS<br />
Note 2 - Employee retirement plans F69<br />
Amounts in NOK million 2011 2010<br />
Fair value of plan assets at beginning of year 5 499 5 300<br />
Actual return on plan assets 120 484<br />
Company contributions 51<br />
Benefits paid (249) (255)<br />
Settlements (81)<br />
Fair value of plan assets at end of year 5 370 5 499
F70<br />
FINANCIAL STATEMENTS<br />
Note 2 - Employee retirement plans<br />
Status of pension plans reconciled to balance sheet<br />
Amounts in NOK million 2011 2010<br />
Defined benefit plans<br />
Funded status of the plans at end of year (1 030) (279)<br />
Unrecognized net (gain) loss 444 (294)<br />
Unrecognized past service cost 6 11<br />
Net accrued pension recognized (580) (562)<br />
Termination benefits and other (56) (91)<br />
Total net accrued pension recognized (636) (653)<br />
Amounts recognized in the balance sheet consist of<br />
Prepaid pension 1 466 1 372<br />
Accrued pension liabilities (2 101) (2 024)<br />
Net amount recognized (636) (653)<br />
Assumptions used to determine net periodic pension cost<br />
2011 2010<br />
Discount rate 3.75% 4.50%<br />
Expected return on plan assets 5.25% 6.00%<br />
Expected salary increase 3.75% 4.00%<br />
Expected pension increase 2.00% 2.25%<br />
Assumptions used to determine pension obligation at end of year<br />
2011 2010<br />
Discount rate 2.50% 3.75%<br />
Expected salary increase 3.25% 3.75%<br />
Expected pension increase 1.75% 2.00%<br />
Investment profile plan assets at end of year<br />
2011 2010<br />
Asset category<br />
Equity securities 26% 29%<br />
Debt securities 34% 31%<br />
Real estate 24% 24%<br />
Other 17% 16%<br />
Total 100% 100%<br />
See note 32 Employee retirement plans in notes to the consolidated financial statements for further information.
Note 3 - Management remuneration, employee costs and auditor fees<br />
See note 11 Employee and management remuneration in the notes to the consolidated financial statements for information and<br />
details related to the Corporate Management Board remuneration. Costs for corporate management board members employed<br />
by subsidiaries are charged to Norsk <strong>Hydro</strong> ASA for services rendered as members of the Corporate Management Board.<br />
See note 44 Board of Directors and Corporate Assembly in the notes to the consolidated financial statements for information<br />
and details related to the Board of Directors' remuneration.<br />
Partners and employees of <strong>Hydro</strong>'s appointed auditors, KPMG, own no shares in Norsk <strong>Hydro</strong> ASA or any of its subsidiaries.<br />
At the <strong>Annual</strong> General Meeting May 4, 2010, KPMG AS was elected as new auditor of Norsk <strong>Hydro</strong> ASA with effect for the<br />
fiscal year 2010. KPMG succeeded Deloitte AS as the company's auditor. The following table shows fees to the elected auditor<br />
for 2011 and 2010.<br />
Amounts in NOK million Audit<br />
FINANCIAL STATEMENTS<br />
Note 3 - Management remuneration, employee costs and auditor fees F71<br />
Audit<br />
related<br />
Other<br />
services<br />
Tax<br />
related Total<br />
2011<br />
Fees to KPMG 6 1 1 8<br />
2010<br />
Fees to KPMG 3 3<br />
Fees to Deloitte 2 1 1 4<br />
The average number of employees in Norsk <strong>Hydro</strong> ASA was 571 in 2011 as compared to 655 in 2010. As of year end 2011<br />
and 2010 Norsk <strong>Hydro</strong> ASA employed 549 and 592 employees, respectively.<br />
Total loans given by Norsk <strong>Hydro</strong> ASA to Norwegian employees as of December 31, 2011 were NOK 207 million. Loans to<br />
employees consist of NOK 135 million secured loans (home and car loans) with the remainder unsecured. The unsecured loan<br />
balance as of December 31, 2011 related to the employee share purchase plan was NOK 6 million.<br />
A substantial number of employees in Norsk <strong>Hydro</strong> ASA are engaged in activities for other Group companies. The cost for<br />
these employees is accounted for on a net basis, reducing Payroll and related costs. Employee related payroll expenses, on a net<br />
basis, are given in the table below.<br />
Amounts in NOK million 2011 2010<br />
Payroll and related costs:<br />
Salaries 677 728<br />
Social security costs 114 136<br />
Social benefits (4) 1<br />
Net periodic pension cost (note 2) 61 92<br />
Internal invoicing of payroll related costs (506) (484)<br />
Total 341 473<br />
Note 4 - Property, plant and equipment<br />
Operating lease expense amounted to NOK 197 million in 2011 and NOK 199 million in 2010. The company has the<br />
following future operating lease commitments under non-cancellable leases: 2012: NOK 195 million, 2013: NOK 195<br />
million, 2014: NOK 195 million, 2015: NOK 195 million, 2016: NOK 195 million and thereafter: NOK 811 million.
F72<br />
FINANCIAL STATEMENTS<br />
Note 4 - Property, plant and equipment<br />
Amounts in NOK million Land Buildings<br />
Machinery,<br />
etc<br />
Plant under<br />
construction Total<br />
Cost December 31, 2010 6 102 219 327<br />
Additions at cost 5 5 11<br />
Retirements (5) (5) (10)<br />
Transfers 1 (1) <br />
Accumulated depreciation December 31, 2011 (40) (97) (136)<br />
Carrying value December 31, 2011 6 58 122 4 191<br />
Depreciation in 2011 (1) (18) (19)<br />
Note 5 - Intangible assets<br />
Amounts in NOK million<br />
Balance December 31, 2010 61 (5) 56<br />
Additions at cost 18 18<br />
Amortization for the year (6) (6)<br />
Impairment loss (21) (21)<br />
Balance December 31, 2011 79 (32) 47<br />
Note 6 - Financial income and expense<br />
Cost<br />
Accumulated<br />
amortization<br />
Carrying<br />
value<br />
Amounts in NOK million 2011 2010<br />
Dividends from subsidiaries 1 926 1 720<br />
Gain on sale of shares, tax free 122<br />
Interest from group companies 1 912 814<br />
Other interest income 71 86<br />
Interest paid to group companies (908) (220)<br />
Other interest expense (158) (169)<br />
Net foreign exchange gain 630 558<br />
Other, net 278 (117)<br />
Financial income, net 3 750 2 794<br />
Note 7 - Income taxes<br />
The tax effect of temporary differences resulting in deferred tax assets (liabilities) are:<br />
Temporary differences<br />
Tax effect<br />
Amounts in NOK million 2011 2010<br />
Shortterm items 1 140<br />
Pensions 178 183<br />
Other longterm items (182) (57)<br />
Deferred tax asset (3) 266<br />
In accordance with the preliminary accounting standard for tax, taxable temporary differences and deductible temporary<br />
differences, which reverse or may reverse in the same period, can be netted.
Reconciliation of nominal statutory tax rate to effective tax rate<br />
Amounts in NOK million 2011 2010<br />
Income (loss) before taxes 3 386 2 380<br />
Expected income taxes at statutory tax rate 948 666<br />
Permanent differences and other, net (175) 2<br />
Income taxes 773 668<br />
Effective tax rate 22.82% 28.06%<br />
Components of income tax<br />
FINANCIAL STATEMENTS<br />
Note 7 - Income taxes F73<br />
Current income tax 504 584<br />
Change in deferred tax 269 84<br />
Income tax 773 668<br />
See note 17 Income tax expense and note 33 Deferred tax in the consolidated financial statements for further information.<br />
Tax effect of share issue costs of NOK 1 million and NOK 42 million, were credited directly to equity in 2011 and 2010,<br />
respectively.<br />
Taxes payable as of December 31, 2011 and 2010 were NOK 1,100 million and NOK 1,153 million, respectively.<br />
Note 8 - Shares in subsidiaries<br />
Company name Currency<br />
Percentage of<br />
shares owned by<br />
Norsk <strong>Hydro</strong> ASA<br />
Total share<br />
capital of the<br />
company<br />
(1,000’s)<br />
Book value<br />
(NOK million)<br />
<strong>Hydro</strong> Aluminium AS NOK 100.00 14 472 252 50 826<br />
Norsk <strong>Hydro</strong> Produksjon AS NOK 100.00 880 000 5 603<br />
Grenland Industriutvikling AS NOK 100.00 26 750 111<br />
<strong>Hydro</strong> Aluminium Deutschland GmbH 1)<br />
EUR 25.04 73 894 92<br />
Norsk <strong>Hydro</strong> Plastic Pipe AS NOK 100.00 10 000 39<br />
Industriforsikring AS NOK 100.00 20 000 20<br />
<strong>Hydro</strong> Kapitalforvaltning AS NOK 100.00 2 500 4<br />
Norsk <strong>Hydro</strong> Kraft OY EUR 100.00 34 <br />
Total 56 695<br />
1) The company is owned 74.96 percent by Norsk <strong>Hydro</strong> Deutschland GmbH & Co. KG, which is a subsidiary of <strong>Hydro</strong> Aluminium AS, and 25.04 percent by<br />
Norsk <strong>Hydro</strong> ASA.<br />
Percentage of shares owned equals percentage of voting shares owned. The location of subsidiaries is indicated by the currency<br />
code used in the table or by the name of the subsidiary. Several of the above-mentioned companies also own shares in other<br />
companies.<br />
Note 9 - Related party information<br />
See note 45 Related party information in the notes to the consolidated financial statements for identification of related parties<br />
and primary relationships with those parties.<br />
The Norwegian state and Vale S.A are related parties to Norsk <strong>Hydro</strong> ASA. Both shareholdings represent significant influence<br />
in Norsk <strong>Hydro</strong> ASA. Following the acquisition of Vale Aluminium Norsk <strong>Hydro</strong> ASA received share holdings in certain<br />
subsidiaries as contribution for the shares issued to Vale. These share holdings were immediately sold to subsidiaries of Norsk<br />
<strong>Hydro</strong> ASA in 2011 for an amount of NOK 20.1 billion. In addition, Norsk <strong>Hydro</strong> ASA made a NOK 26.4 billion capital<br />
contribution to <strong>Hydro</strong> Aluminium AS in 2011 to finance investments mainly related to the Vale Aluminium acquisition.
F74<br />
FINANCIAL STATEMENTS<br />
Note 9 - Related party information<br />
Norsk <strong>Hydro</strong> ASA operates the cash pooling arrangements in <strong>Hydro</strong>. Further, Norsk <strong>Hydro</strong> ASA extends loans to subsidiaries,<br />
associates and jointly controlled entities at terms and conditions reflecting prevailing markets conditions for corresponding<br />
services, allowing for a margin to cover administration and risk. See note 6 Financial income and expense for information on<br />
interest paid to and received from group companies.<br />
Norsk <strong>Hydro</strong> ASA allocates cost for corporate staff services and shared services to subsidiaries. The total amount allocated in<br />
2011 was NOK 226 million.<br />
Transactions with associates and jointly controlled entities consist mainly of loans to such entities owned by subsidiaries of<br />
Norsk <strong>Hydro</strong> ASA.<br />
For information on transactions with employees and management, see note 3 Management remuneration, employee costs and<br />
audit fees and note 11 Employee and management remuneration in the notes to the consolidated financial statements. For<br />
information on transactions with Board of Directors and Corporate Assembly see note 44 Board of Directors and Corporate<br />
Assembly in the notes to the consolidated financial statements.<br />
Note 10 - Specification of balance sheet items<br />
Amounts in NOK million 2011 2010<br />
Securities 536 536<br />
Prepaid pension 1 466 1 372<br />
Associates and jointly controlled entites 22 28<br />
Other noncurrent assets 557 577<br />
Total prepaid pension, investments and other noncurrent assets 2 579 2 512<br />
Prepaid expenses 61 166<br />
Trade receivables 68 48<br />
Other current assets 35 31<br />
Total prepaid expenses and other current assets 163 245<br />
Employee deposits 381 404<br />
Other interestbearing debt 209 17<br />
Total bank loans and other interestbearing shortterm debt 590 421<br />
Note 11 - Guarantees<br />
Norsk <strong>Hydro</strong> ASA provides guarantees arising in the ordinary course of business including stand-by letters of credit,<br />
performance bonds and various payment or financial guarantees. Guarantees in connection with the sale of companies, referred<br />
to as sales guarantees in the table below, reflect the maximum contractual amount that <strong>Hydro</strong> could be liable for in the event of<br />
certain defaults or the realization of specific uncertainties. Guarantees related to jointly controlled entities primarily relate to<br />
Qatalum. See note 37 Guarantees in the consolidated financial statements for additional information.<br />
Amounts in NOK million 2011 2010<br />
Guarantees related to jointly controlled entities 7 696 7 656<br />
Sales guarantees 600 1 695<br />
Commercial guarantees 4 607 4 188<br />
Total guarantees not recognized 12 903 13 539
FINANCIAL STATEMENTS<br />
Note 12 - Long-term debt F75<br />
Note 12 - Long-term debt<br />
As of December 31, 2011, long-term debt amounted to NOK 2,589 million, of which NOK 867 million fall due after 2016.<br />
As of December 31, 2010, long-term debt amounted to NOK 233 million. See note 30 Long-term debt in notes to the<br />
consolidated financial statements for further information.<br />
Note 13 - Number of shares outstanding, shareholders and equity reconciliation<br />
The share capital of Norsk <strong>Hydro</strong> ASA as of December 31, 2011 was NOK 2,271,760,107.04 consisting of 2,068,998,276<br />
ordinary shares at NOK 1.098 per share. As of December 31, 2011 Norsk <strong>Hydro</strong> ASA had purchased 32,539,257 treasury<br />
shares at a cost of NOK 1,084 million. See Consolidated statements of changes in equity and note 34 Shareholders' equity for<br />
additional information.<br />
The table shows shareholders holding one percent or more of the total 2,036,459,019 shares outstanding as of December 31,<br />
2011, according to information in the Norwegian securities' registry system (Verdipapirsentralen).<br />
Navn Antall aksjer<br />
Nærings og handelsdepartementet 708 865 253<br />
Vale Austria Holdings GmbH 447 834 465<br />
Folketrygdfondet 87 699 011<br />
State Street Bank and Trust Co. 2)<br />
61 999 810<br />
Clearstream Banking S.A. 2)<br />
43 458 327<br />
Rasmussengruppen AS 34 700 000<br />
The Northern Trust Co. 2)<br />
29 490 307<br />
Bnym As Emea Asia 25 Omnibus 2)<br />
13 200 250<br />
State Street Bank and Trust Co. 2)<br />
12 153 976<br />
Bank of New York Mellon 2)<br />
11 589 575<br />
State Street Bank and Trust Co. 2)<br />
11 332 579<br />
JPMorgan Chase Bank, NA 1)<br />
10 390 127<br />
1) Representing American Depositary Shares.<br />
2) Nominee accounts.<br />
Changes in equity<br />
Amounts in NOK million Paidin capital<br />
Retained<br />
earnings Total equity<br />
December 31, 2010 11 296 26 869 38 165<br />
Net income 2 613 2 613<br />
Dividend proposed (1 527) (1 527)<br />
Shares issued 19 985 19 985<br />
Treasury shares 12 27 39<br />
December 31, 2011 31 292 27 981 59 274
F76<br />
FINANCIAL STATEMENTS<br />
Responsibility Statement<br />
Responsibility Statement<br />
We confirm to the best of our knowledge that the consolidated financial statements for 2011 have been prepared in accordance<br />
with IFRS as adopted by the European Union, as well as additional information requirements in accordance with the<br />
Norwegian Accounting Act, that the financial statements for the parent company for 2011 have been prepared in accordance<br />
with the Norwegian Accounting Act and generally accepted accounting practice in Norway, and that the information presented<br />
in the financial statements gives a true and fair view of the assets, liabilities, financial position and result of Norsk <strong>Hydro</strong> ASA<br />
and the <strong>Hydro</strong> Group for the period. We also confirm to the best of our knowledge that the Board of Directors' <strong>Report</strong><br />
includes a true and fair review of the development, performance and financial position of Norsk <strong>Hydro</strong> ASA and the <strong>Hydro</strong><br />
Group, together with a description of the principal risks and uncertainties that they face.<br />
Oslo, March 20, 2012<br />
Terje Vareberg<br />
Chair<br />
Finn Jebsen<br />
Board member<br />
Sten Roar Martinsen<br />
Board member<br />
Tito Martins<br />
Board member<br />
Bente Rathe<br />
Deputy chair<br />
Inge K. Hansen<br />
Board member<br />
Liv Monica Bargem Stubholt<br />
Board member<br />
Billy Fredagsvik<br />
Board member<br />
Ove Ellefsen<br />
Board member<br />
Eva Persson<br />
Board member<br />
Svein Richard Brandtzæg<br />
President and CEO
Auditor's report<br />
To the <strong>Annual</strong> Shareholders' Meeting of Norsk <strong>Hydro</strong> ASA<br />
INDEPENDENT AUDITOR'S REPORT<br />
FINANCIAL STATEMENTS<br />
Auditor's report F77<br />
<strong>Report</strong> on the Financial Statements<br />
We have audited the accompanying financial statements of Norsk <strong>Hydro</strong> ASA, which comprise the financial statements of the<br />
parent company Norsk <strong>Hydro</strong> ASA and the consolidated financial statements of Norsk <strong>Hydro</strong> ASA and its subsidiaries. The<br />
parent company's financial statements comprise the balance sheet as at 31 December 2011, the income statement and cash flow<br />
statement for the year then ended, and a summary of significant accounting policies and other explanatory information. The<br />
consolidated financial statements comprise the balance sheet as at 31 December 2011, and the income statement and the<br />
statement of comprehensive income, statement of changes in equity and cash flow statement for the year then ended, and a<br />
summary of significant accounting policies and other explanatory information.<br />
The Board of Directors and the Managing Director's Responsibility for the Financial Statements<br />
The Board of Directors and the Managing Director are responsible for the preparation and fair presentation of the parent<br />
company financial statements in accordance with the Norwegian Accounting Act and generally accepted accounting standards<br />
and practices in Norway and for the consolidated financial statements in accordance with International Financial <strong>Report</strong>ing<br />
Standards as adopted by the EU, and for such internal control as the Board of Directors and the Managing Director determine<br />
is necessary to enable the preparation of financial statements that are free from material misstatement, whether due to fraud or<br />
error.<br />
Auditor's Responsibility<br />
Our responsibility is to express an opinion on these financial statements based on our audit. We conducted our audit in<br />
accordance with laws, regulations, and auditing standards and practices generally accepted in Norway, including International<br />
Standards on Auditing. Those standards require that we comply with ethical requirements and plan and perform the audit to<br />
obtain reasonable assurance about whether the financial statements are free from material misstatement.<br />
An audit involves performing procedures to obtain audit evidence about the amounts and disclosures in the financial<br />
statements. The procedures selected depend on the auditor's judgment, including the assessment of the risks of material<br />
misstatement of the financial statements, whether due to fraud or error. In making those risk assessments, the auditor considers<br />
internal control relevant to the entity's preparation and fair presentation of the financial statements in order to design audit<br />
procedures that are appropriate in the circumstances, but not for the purpose of expressing an opinion on the effectiveness of<br />
the entity's internal control. An audit also includes evaluating the appropriateness of accounting policies used and the<br />
reasonableness of accounting estimates made by management, as well as evaluating the overall presentation of the financial<br />
statements.<br />
We believe that the audit evidence we have obtained is sufficient and appropriate to provide a basis for our audit opinion.<br />
Opinion on the separate financial statement<br />
In our opinion, the parent company's financial statements are prepared in accordance with the laws and regulations and give a<br />
true and fair view of the financial position of Norsk <strong>Hydro</strong> ASA as at 31 December 2011, and of its financial performance and<br />
its cash flows for the year then ended in accordance with the Norwegian Accounting Act and accounting standards and<br />
practices generally accepted in Norway.<br />
Opinion on the consolidated financial statements<br />
In our opinion, the consolidated financial statements are prepared in accordance with the laws and regulations and give a true<br />
and fair view of the financial position of Norsk <strong>Hydro</strong> ASA and its subsidiaries as at 31 December 2011, and of its financial<br />
performance and its cash flows for the year then ended in accordance with International Financial <strong>Report</strong>ing Standards as<br />
adopted by the EU.
F78<br />
FINANCIAL STATEMENTS<br />
Auditor's report<br />
<strong>Report</strong> on Other Legal and Regulatory Requirements<br />
Opinion on the Board of Directors' report and <strong>Report</strong> on Corporate Governance<br />
Based on our audit of the financial statements as described above, it is our opinion that the information presented in the Board<br />
of Directors' report and report on Corporate Governance concerning the financial statements, the going concern assumption,<br />
and the proposal for the allocation of the profit is consistent with the financial statements and complies with the law and<br />
regulations.<br />
Opinion on Accounting Registration and Documentation<br />
Based on our audit of the financial statements as described above, and control procedures we have considered necessary in<br />
accordance with the International Standard on Assurance Engagements (ISAE) 3000, «Assurance Engagements Other than<br />
Audits or Reviews of Historical Financial Information», it is our opinion that the management has fulfilled its duty to produce<br />
proper and clearly set out registration and documentation of the company's accounting information in accordance with the law<br />
and bookkeeping standards and practices generally accepted in Norway<br />
Oslo, 20 March 2012<br />
KPMG AS<br />
Arne Frogner<br />
State Authorized Public Accountant<br />
[Translation has been made for information purposes only]
Statement of the corporate assembly to the <strong>Annual</strong> general meeting of<br />
Norsk <strong>Hydro</strong> ASA<br />
The board of directors' proposal for the financial statements for the financial year 2011 and the Auditors' report have been<br />
submitted to the corporate assembly.<br />
The corporate assembly recommends that the directors' proposal regarding the financial statements for 2011 for the parent<br />
company, Norsk <strong>Hydro</strong> ASA, and for Norsk <strong>Hydro</strong> ASA and its subsidiaries be approved by the annual general meeting, and<br />
that the net income for 2011 of Norsk <strong>Hydro</strong> ASA be appropriated as recommended by the directors.<br />
Oslo, March 20, 2012<br />
Siri Teigum<br />
FINANCIAL STATEMENTS<br />
Statement of the corporate assembly to the <strong>Annual</strong> general meeting of Norsk <strong>Hydro</strong> ASA F79
PENDIX<br />
A2<br />
Appendix A1<br />
APPENDIX<br />
Terms and definitions<br />
Appendix<br />
Terms and definitions<br />
ADRs TWh Terawatt American hour Depositary (one billion Receipts, kilowatt evidencing hours) a specified number of ADSs<br />
ADSs US GAAP Generally American Depositary accepted accounting Shares, each principles ADS representing in the United one States deposited ordinary share<br />
AluNorf VAW Aluminium VAW Aluminium Norf GmbH AG<br />
Articles VPS or VPS of Association System The articles Norwegian of association Central Securities of the Company, Depository, as amended Verdipapirsentralen and currently in effect<br />
Audit WTO Committee The World audit Trade committee Organization of the Company's Board of Directors<br />
BAT Yara "Best Yara International Available Techniques" ASA for pollution prevention and control<br />
Code The U.S. Internal Revenue Code of 1986, as amended<br />
APPENDIX<br />
Appendix A1<br />
Nomination Committee The nomination committee provided for in the Company's Articles of Association and operating<br />
under a charter established by the shareholders' representatives in the Corporate Assembly<br />
OSE Oslo Stock Exchange<br />
tonne, mt One metric tonne (approximately 1,000 kilograms or 2,205 pounds)<br />
ASA and itsCompany<br />
Norsk <strong>Hydro</strong> ASA, a Norwegian public company limited by shares, or Norsk <strong>Hydro</strong> ASA and its<br />
Cautionary note in consolidated relation subsidiaries, to certain as the context forward-looking requires statements<br />
Certain statements included within this <strong>Annual</strong> <strong>Report</strong> contain forward-looking information, including, without limitation,<br />
those<br />
Compensation<br />
relating to (a) forecasts,<br />
The<br />
projections<br />
compensation<br />
and estimates,<br />
committee<br />
including<br />
of the Company's<br />
about overall<br />
Board<br />
economic<br />
of Directors<br />
developments, (b) various<br />
expectations<br />
Committee<br />
about future developments in <strong>Hydro</strong>'s markets, particularly prices, supply and demand and competition, (c)<br />
report to statements Consolidated of management's Financial The plans, consolidated objectives and financial strategies statements for <strong>Hydro</strong>, and such notes as included planned in expansions, the Company's integration annual of report acquired to<br />
entities, Statements investments, financing shareholders or other projects, (d) targeted production volumes and costs, capacities or rates, start-up costs,<br />
cost reductions and profit objectives, (e) results of operations, (f) margins, (g) growth rates, (h) risk management, as well as (i)<br />
esponsibility, statements Corporate preceded Assembly by "expected", The corporate "scheduled", assembly, "targeted", a body "planned", contemplated "proposed", by Norwegian "intended", companies' "will" law, or similar with responsibility, statements.<br />
ectors and<br />
among other things, for the election of the members of the Company's Board of Directors and<br />
Although we believe that the nomination expectations of reflected the external in such auditor forward-looking statements are reasonable, these forward-looking<br />
f Executive statements Corporate are Management based on a number The corporate of assumptions management and forecasts board established that, by their by nature, the Company's involve risk President and uncertainty. and Chief Various Executive<br />
factors Board could cause our actual Officer results to to assist differ him materially in discharging from those his responsibilities<br />
projected in a forward-looking statement or affect the<br />
extent to which a particular projection is realized. Factors that could cause these differences include, but are not limited to: the<br />
global CRU supply and demand for CRU aluminium International and aluminium Limited products, including as a result of changes in the economic climate;<br />
ment, which<br />
our<br />
Disclosure<br />
continued<br />
Committee<br />
ability to reposition<br />
The disclosure<br />
and restructure<br />
committee<br />
our<br />
of<br />
upstream<br />
the Company,<br />
and downstream<br />
comprised<br />
aluminium<br />
of members<br />
business;<br />
of senior<br />
changes<br />
management,<br />
in availability<br />
which<br />
and cost of energy and raw materials;<br />
is responsible<br />
our ability<br />
for reviewing<br />
to execute<br />
financial<br />
major<br />
and<br />
projects<br />
related<br />
and<br />
information<br />
successfully<br />
before<br />
integrate<br />
it is<br />
acquired<br />
made public<br />
businesses; our<br />
credit ratings and continued ability to access financing and capital at a reasonable cost; rates of inflation and industrial<br />
production; EEA changes in the relative European value Economic of currencies Area and the value of commodity contracts; trends in <strong>Hydro</strong>'s key markets<br />
and competition; and legislative, regulatory and political factors. For a description of factors that could cause our results to<br />
EEA Agreement The European Economic Area Agreement<br />
differ materially from those expressed or implied by such statements, please refer to the risk factors specified under "Risk review<br />
- EFTA Risk factors" earlier in this European <strong>Annual</strong> <strong>Report</strong>. Free Trade Association<br />
ducts, and<br />
EU European Union<br />
No assurance can be given that such expectations will prove to have been correct. <strong>Hydro</strong> disclaims any obligation to update or<br />
revise HSE any forward-looking statements, Health, safety whether and environment as a result of new information, future events or otherwise.<br />
<strong>Hydro</strong> Norsk <strong>Hydro</strong> ASA and its consolidated subsidiaries<br />
<strong>Hydro</strong> Aluminium The aluminium business of <strong>Hydro</strong>, comprising the sub-segments Metals, Rolled Products, and<br />
Extrusion and Automotive<br />
kWh Kilowatt hour<br />
LME London Metal Exchange<br />
mm Millimeter<br />
NOK Norwegian kroner
A2<br />
APPENDIX<br />
Terms and definitions<br />
Appendix<br />
Nomination Committee The nomination committee provided for in the Company's Articles of Association and operatingNomination<br />
Com<br />
under a charter established by the shareholders' representatives in the Corporate Assembly<br />
OSE Oslo Stock Exchange<br />
Terms and definitions<br />
tonne, mt One metric tonne (approximately 1,000 kilograms or 2,205 pounds)<br />
TWh ADRs American Terawatt hour Depositary (one billion Receipts, kilowatt evidencing hours) a specified number of ADSs<br />
US ADSs GAAP American Generally Depositary accepted accounting Shares, each principles ADS representing in the United one States deposited ordinary share<br />
VAW AluNorf Aluminium VAW Aluminium Norf GmbH AG<br />
VPS Articles or VPS of Association System The articles Norwegian of association Central Securities of the Company, Depository, as amended Verdipapirsentralen and currently in effect<br />
WTO Audit Committee The World audit Trade committee Organization of the Company's Board of Directors<br />
Yara BAT "Best Yara International Available Techniques" ASA for pollution prevention and control<br />
Code The U.S. Internal Revenue Code of 1986, as amended<br />
APPENDIX<br />
Appendix A1 A2<br />
Company Norsk <strong>Hydro</strong> ASA, a Norwegian public company limited by shares, or Norsk <strong>Hydro</strong> ASA and its<br />
Cautionary note in consolidated relation subsidiaries, to certain as the context forward-looking requires statements Cautionary<br />
Certain statements included within this <strong>Annual</strong> <strong>Report</strong> contain forward-looking information, including, without limitation, Certain statemen<br />
those<br />
Compensation<br />
relating to (a) forecasts,<br />
The<br />
projections<br />
compensation<br />
and estimates,<br />
committee<br />
including<br />
of the Company's<br />
about overall<br />
Board<br />
economic<br />
of Directors<br />
developments, (b) various those relating to (<br />
expectations<br />
Committee<br />
about future developments in <strong>Hydro</strong>'s markets, particularly prices, supply and demand and competition, (c) expectations abou<br />
statements Consolidated of management's Financial The plans, consolidated objectives and financial strategies statements for <strong>Hydro</strong>, and such notes as included planned in expansions, the Company's integration annual of report acquired to statements of man<br />
entities, Statements investments, financing shareholders or other projects, (d) targeted production volumes and costs, capacities or rates, start-up costs, entities, investme<br />
cost reductions and profit objectives, (e) results of operations, (f) margins, (g) growth rates, (h) risk management, as well as (i) cost reductions an<br />
statements Corporate preceded Assembly by "expected", The corporate "scheduled", assembly, "targeted", a body "planned", contemplated "proposed", by Norwegian "intended", companies' "will" law, or similar with responsibility, statements. statements preced<br />
among other things, for the election of the members of the Company's Board of Directors and<br />
Although we believe that the nomination expectations of reflected the external in such auditor forward-looking statements are reasonable, these forward-looking Although we beli<br />
statements Corporate are Management based on a number The corporate of assumptions management and forecasts board established that, by their by nature, the Company's involve risk President and uncertainty. and Chief Various Executive statements are ba<br />
factors Board could cause our actual Officer results to to assist differ him materially in discharging from those his responsibilities<br />
projected in a forward-looking statement or affect the factors could caus<br />
extent to which a particular projection is realized. Factors that could cause these differences include, but are not limited to: the extent to which a<br />
global CRU supply and demand for CRU aluminium International and aluminium Limited products, including as a result of changes in the economic climate; global supply and<br />
our<br />
Disclosure<br />
continued<br />
Committee<br />
ability to reposition<br />
The disclosure<br />
and restructure<br />
committee<br />
our<br />
of<br />
upstream<br />
the Company,<br />
and downstream<br />
comprised<br />
aluminium<br />
of members<br />
business;<br />
of senior<br />
changes<br />
management,<br />
in availability<br />
which<br />
our continued ab<br />
and cost of energy and raw materials;<br />
is responsible<br />
our ability<br />
for reviewing<br />
to execute<br />
financial<br />
major<br />
and<br />
projects<br />
related<br />
and<br />
information<br />
successfully<br />
before<br />
integrate<br />
it is<br />
acquired<br />
made public<br />
businesses; our and cost of energ<br />
credit ratings and continued ability to access financing and capital at a reasonable cost; rates of inflation and industrial credit ratings and<br />
production; EEA changes in the relative European value Economic of currencies Area and the value of commodity contracts; trends in <strong>Hydro</strong>'s key markets production; chan<br />
and competition; and legislative, regulatory and political factors. For a description of factors that could cause our results to and competition;<br />
EEA Agreement The European Economic Area Agreement<br />
differ materially from those expressed or implied by such statements, please refer to the risk factors specified under "Risk review differ materially f<br />
- EFTA Risk factors" earlier in this European <strong>Annual</strong> <strong>Report</strong>. Free Trade Association<br />
- Risk factors" ear<br />
EU European Union<br />
No assurance can be given that such expectations will prove to have been correct. <strong>Hydro</strong> disclaims any obligation to update or No assurance can<br />
revise HSE any forward-looking statements, Health, safety whether and environment as a result of new information, future events or otherwise.<br />
revise any forward<br />
<strong>Hydro</strong> Norsk <strong>Hydro</strong> ASA and its consolidated subsidiaries<br />
<strong>Hydro</strong> Aluminium The aluminium business of <strong>Hydro</strong>, comprising the sub-segments Metals, Rolled Products, and<br />
Extrusion and Automotive<br />
kWh Kilowatt hour<br />
LME London Metal Exchange<br />
mm Millimeter<br />
NOK Norwegian kroner<br />
OSE<br />
tonne, mt<br />
TWh<br />
US GAAP<br />
VAW<br />
VPS or VPS Syst<br />
WTO<br />
Yara<br />
APPENDI<br />
Terms and
<strong>Hydro</strong> is a global supplier of aluminium with<br />
activities throughout the value chain, from<br />
bauxite extraction to the production of rolled<br />
and extruded aluminium products and building<br />
systems. Based in Norway, the company employs<br />
23,000 people in more than 40 countries.<br />
Rooted in a century of experience in renewable<br />
energy production, technology development and<br />
progressive partnerships, <strong>Hydro</strong> is committed to<br />
strengthening the viability of the customers and<br />
communities we serve.<br />
Norsk <strong>Hydro</strong> ASA<br />
NO-0240 Oslo<br />
Norway<br />
Tel: +47 22 53 81 00<br />
fax: +47 22 53 85 53<br />
www.hydro.com<br />
Design and production: <strong>Hydro</strong>, Artbox<br />
Photography: <strong>Hydro</strong>, Scanpix, Helge Hansen, fousid Hassan<br />
Print: follotrykk<br />
The printer holds a Nordic Swan certificate.<br />
© <strong>Hydro</strong> 2012