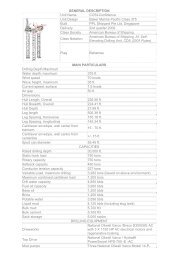
AWO Prospectus - COSL Drilling Europe AS
AWO Prospectus - COSL Drilling Europe AS
AWO Prospectus - COSL Drilling Europe AS

You also want an ePaper? Increase the reach of your titles
YUMPU automatically turns print PDFs into web optimized ePapers that Google loves.
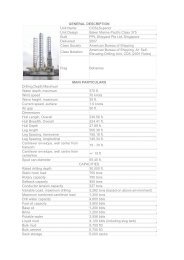
Awilco Offshore <strong>AS</strong>A<br />
As illustrated above the offshore rig market has experienced both booming periods (1995-97) and soft<br />
markets (1998-2000). However, since bottoming out late 2001, demand for jack-ups has increased<br />
steadily and current status is characterized by firm markets in all key regions and segments.<br />
Supply<br />
The current fleet of jack-ups comprises 387 units, including 70 non-competitive units (typically owned<br />
and operated by national oil companies and not actively marketed to others). For the purpose of this<br />
document, the total fleet is referenced if not otherwise noted.<br />
There are currently 28 rigs on order representing 7% of the total fleet. 5 of the new buildings are for<br />
delivery in 2005, while 10 are scheduled for 2006. The current lead time for new buildings is about 26-<br />
30 months, and potential additions of new buildings will not enter the market before 2007. Awilco<br />
Offshore owns three of the new buildings currently in order.<br />
Aging world fleet<br />
The majority of the current operating rigs were constructed in the late 1970’s and early 1980’s, and the<br />
average age of the fleet is 23 years today. Roughly 75% of the current fleet is between 20 and 27 years<br />
old, and only 4% of the current fleet is less than 6 years old. Although the useful lifetime of rigs is<br />
difficult to predict, it is expected that new requirements for drilling deeper and more complex wells will<br />
require replacement of older assets over time. In addition attrition of units due to accidents, conversions<br />
and retirement has been in the range of 2-6 units annually over the last 5 years. The charts below<br />
illustrate the age profile and impact of newbuildings.<br />
No of rigs in world fleet<br />
450<br />
400<br />
350<br />
300<br />
250<br />
200<br />
150<br />
100<br />
50<br />
Cumulative number of rigs in operation today<br />
0<br />
1970 1974 1978 1982 1986 1990 1995 2002<br />
Delivery year<br />
Source: Petrodata / Fearnley Fonds<br />
Number of units<br />
32<br />
12<br />
10<br />
8<br />
6<br />
4<br />
2<br />
0<br />
-2<br />
-4<br />
-6<br />
-8<br />
New building additions<br />
Attrition (actual/5 y<br />
average)<br />
Net supply growth [%]<br />
2004 2005e 2006e 2007e<br />
Current market balance<br />
Total utilization of the worldwide jack-up fleet is around 89 percent today, with most of the individual<br />
drilling markets stable or improving and varying little from that number. Excluding cold stacked rigs<br />
(not actively marketed), the effective utilization is 94%, a level that, in historical context, is very high.<br />
Thus, all worldwide markets are virtually in balance today, with little room for mobilization of units<br />
between regions as no region seems to have available capacity to spare.<br />
Region Demand Total supply Utilisation Cold stacked Eff. utilisation<br />
US GoM 92 114 81% 16 94%<br />
Central America 34 36 94% 0 94%<br />
South America 7 10 70% 2 90%<br />
West Africa 19 19 100% 0 100%<br />
North Sea 30 31 97% 0 97%<br />
Middle East 65 71 92% 1 93%<br />
South East Asia 27 29 91% 1 95%<br />
Other 69 75 91% 3 95%<br />
Sum 342 385 89% 3 94%<br />
Source: Petrodata / Fearnley Fonds<br />
4.5 %<br />
3.5 %<br />
2.5 %<br />
1.5 %<br />
0.5 %<br />
-0.5 %<br />
-1.5 %<br />
-2.5 %<br />
-3.5 %<br />
Fleet growth (%)