Annual Report 2010 Holcim Ltd
Annual Report 2010 Holcim Ltd
Annual Report 2010 Holcim Ltd

Create successful ePaper yourself
Turn your PDF publications into a flip-book with our unique Google optimized e-Paper software.
Financial<br />
Information<br />
1 Net income plus<br />
depreciation,<br />
amortization and<br />
impairment.<br />
2 Net fi nancial debt<br />
divided by total<br />
shareholders’<br />
equity.<br />
3 EPS calculation<br />
based on net<br />
income attributable<br />
to shareholders of<br />
<strong>Holcim</strong> <strong>Ltd</strong><br />
weighted by the<br />
average number of<br />
shares.<br />
4 Proposed by the<br />
Board of Directors<br />
for a payout from<br />
capital contribution<br />
reserves.<br />
5 Statement of<br />
income fi gures<br />
translated at<br />
average rate;<br />
statement of<br />
financial position<br />
figures at year-end<br />
rate.<br />
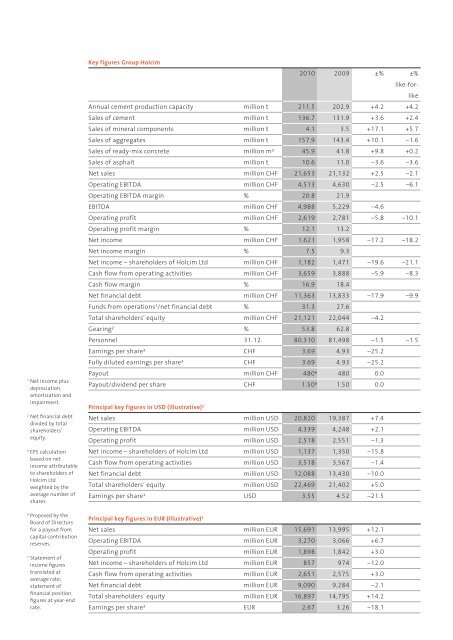
Key figures Group <strong>Holcim</strong><br />
<strong>2010</strong> 2009 ±% ±%<br />
like-forlike<br />
<strong>Annual</strong> cement production capacity million t 211.5 202.9 +4.2 +4.2<br />
Sales of cement million t 136.7 131.9 +3.6 +2.4<br />
Sales of mineral components million t 4.1 3.5 +17.1 +5.7<br />
Sales of aggregates million t 157.9 143.4 +10.1 –1.6<br />
Sales of ready-mix concrete million m3 45.9 41.8 +9.8 +0.2<br />
Sales of asphalt million t 10.6 11.0 –3.6 –3.6<br />
Net sales million CHF 21,653 21,132 +2.5 –2.1<br />
Operating EBITDA million CHF 4,513 4,630 –2.5 –6.1<br />
Operating EBITDA margin % 20.8 21.9<br />
EBITDA million CHF 4,988 5,229 –4.6<br />
Operating profit million CHF 2,619 2,781 –5.8 –10.1<br />
Operating profit margin % 12.1 13.2<br />
Net income million CHF 1,621 1,958 –17.2 –18.2<br />
Net income margin % 7.5 9.3<br />
Net income – shareholders of <strong>Holcim</strong> <strong>Ltd</strong> million CHF 1,182 1,471 –19.6 –21.1<br />
Cash flow from operating activities million CHF 3,659 3,888 –5.9 –8.3<br />
Cash flow margin % 16.9 18.4<br />
Net financial debt million CHF 11,363 13,833 –17.9 –9.9<br />
Funds from operations1 /net financial debt % 31.3 27.6<br />
Total shareholders’ equity million CHF 21,121 22,044 –4.2<br />
Gearing2 % 53.8 62.8<br />
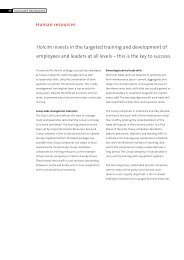
Personnel 31.12. 80,310 81,498 –1.5 –1.5<br />
Earnings per share3 CHF 3.69 4.93 –25.2<br />
Fully diluted earnings per share3 CHF 3.69 4.93 –25.2<br />
Payout million CHF 4804 480 0.0<br />
Payout/dividend per share CHF 1.504 1.50 0.0<br />
Principal key figures in USD (illustrative) 5<br />
Net sales million USD 20,820 19,387 +7.4<br />
Operating EBITDA million USD 4,339 4,248 +2.1<br />
Operating profit million USD 2,518 2,551 –1.3<br />
Net income – shareholders of <strong>Holcim</strong> <strong>Ltd</strong> million USD 1,137 1,350 –15.8<br />
Cash flow from operating activities million USD 3,518 3,567 –1.4<br />
Net financial debt million USD 12,088 13,430 –10.0<br />
Total shareholders’ equity million USD 22,469 21,402 +5.0<br />
Earnings per share3 USD 3.55 4.52 –21.5<br />
Principal key figures in EUR (illustrative) 5<br />
Net sales million EUR 15,691 13,995 +12.1<br />
Operating EBITDA million EUR 3,270 3,066 +6.7<br />
Operating profit million EUR 1,898 1,842 +3.0<br />
Net income – shareholders of <strong>Holcim</strong> <strong>Ltd</strong> million EUR 857 974 –12.0<br />
Cash flow from operating activities million EUR 2,651 2,575 +3.0<br />
Net financial debt million EUR 9,090 9,284 –2.1<br />
Total shareholders’ equity million EUR 16,897 14,795 +14.2<br />
Earnings per share3 EUR 2.67 3.26 –18.1