Pore Pressure Prediction.indd - Ikon Science
Pore Pressure Prediction.indd - Ikon Science
Pore Pressure Prediction.indd - Ikon Science
- No tags were found...

You also want an ePaper? Increase the reach of your titles
YUMPU automatically turns print PDFs into web optimized ePapers that Google loves.
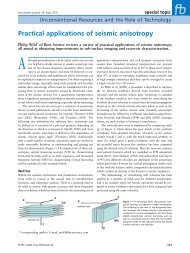
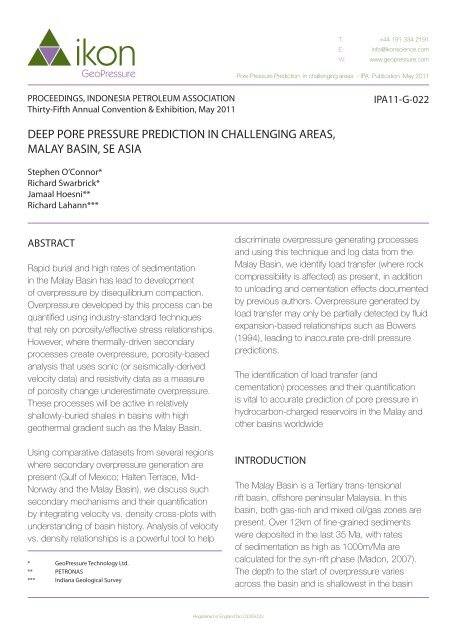
T: +44 191 334 2191E: info@ikonscience.comW: www.geopressure.com<strong>Pore</strong> <strong>Pressure</strong> <strong>Prediction</strong> in challenging areas - IPA Publication May 2011PROCEEDINGS, INDONESIA PETROLEUM ASSOCIATIONThirty-Fifth Annual Convention & Exhibition, May 2011IPA11-G-022DEEP PORE PRESSURE PREDICTION IN CHALLENGING AREAS,MALAY BASIN, SE ASIAStephen O’Connor*Richard Swarbrick*Jamaal Hoesni**Richard Lahann***ABSTRACTRapid burial and high rates of sedimentationin the Malay Basin has lead to developmentof overpressure by disequilibrium compaction.Overpressure developed by this process can bequantifi ed using industry-standard techniquesthat rely on porosity/effective stress relationships.However, where thermally-driven secondaryprocesses create overpressure, porosity-basedanalysis that uses sonic (or seismically-derivedvelocity data) and resistivity data as a measureof porosity change underestimate overpressure.These processes will be active in relativelyshallowly-buried shales in basins with highgeothermal gradient such as the Malay Basin.Using comparative datasets from several regionswhere secondary overpressure generation arepresent (Gulf of Mexico; Halten Terrace, Mid-Norway and the Malay Basin), we discuss suchsecondary mechanisms and their quantifi cationby integrating velocity vs. density cross-plots withunderstanding of basin history. Analysis of velocityvs. density relationships is a powerful tool to help* Geo<strong>Pressure</strong> Technology Ltd.** PETRONAS*** Indiana Geological Surveydiscriminate overpressure generating processesand using this technique and log data from theMalay Basin, we identify load transfer (where rockcompressibility is affected) as present, in additionto unloading and cementation effects documentedby previous authors. Overpressure generated byload transfer may only be partially detected by fl uidexpansion-based relationships such as Bowers(1994), leading to inaccurate pre-drill pressurepredictions.The identifi cation of load transfer (andcementation) processes and their quantifi cationis vital to accurate prediction of pore pressure inhydrocarbon-charged reservoirs in the Malay andother basins worldwideINTRODUCTIONThe Malay Basin is a Tertiary trans-tensionalrift basin, offshore peninsular Malaysia. In thisbasin, both gas-rich and mixed oil/gas zones arepresent. Over 12km of fi ne-grained sedimentswere deposited in the last 35 Ma, with ratesof sedimentation as high as 1000m/Ma arecalculated for the syn-rift phase (Madon, 2007).The depth to the start of overpressure variesacross the basin and is shallowest in the basinRegistered in England No.03359723
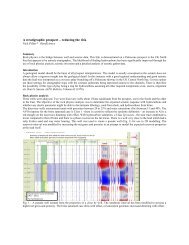
centre, e.g. wells such as Dulang-1 and Tangga-1,1.9-2.0 km TVDss. The Middle Miocene UnitF shale acts as a regional seal (Madon, 2007).All well locations named in this study are shownin Figure 1. A similar observation was made inSingh and Ford (1982) based on analysis of over150 exploration wells. The Middle Miocene unitE represents a pressure transition zone. On thebasin fl anks, overpressure starts deeper, often at3.0 km TVDss e.g. Larut-1. In the SW of the MalayBasin, in the vicinity of wells such as Beranang6F-18.1 and Resak 6F-18.2, anomalously highoverpressure occurs at depths of 2.6 km TVDss,sealed by the on-lapping, transgressive shale ofunit L (Lower Miocene). Shale seals have a stronginfl uence on overpressure distribution, as do ratesof sedimentation and subsidence (Madon, 2007).To-date, current drilling has rarely penetrated thesedeeper, highly overpressured parts of the MalayBasin. Those wells that have drilled deep, suchas the Bergading Deep and Sepat Deep-1 wells,encountered High <strong>Pressure</strong>/High Temperature(HP/HT) conditions, severe mud losses, well kicksand other operational diffi culties such as stuckpipes, hole stability and hole caving while drillingof the well (Mohamad et al., 2006). Prior to 1994,80% of exploration and appraisal wells wereterminated due to overpressure in the Malay Basin(Shariff, 1994).Careful and accurate pore pressure prediction,therefore, will be the key to defi ning thenext exploration phase of the Malay Basin.A major component of this process will bethe understanding of those processes thatcreate overpressure, and the identifi cation ofthese processes in this basin. Disequilibriumcompaction is believed to be the primarycausal mechanism for the overpressure in thebasin (Madon, 2007), however, due to the highgeothermal gradient (51.8oC/km; Halim, 1994),we show evidence in this paper that secondaryoverpressure mechanisms are also important.Secondary mechanisms such as fl uid expansionand cementation have previously been identifi edby Hoesni et al. (2007) in the Malay Basin. In thispaper, we review this work and show evidence ofadditional processes, related to changes in rockcompressibility (load transfer).Conventional porosity-based pore pressureanalysis using sonic/seismic velocity and resistivitydata as a measure of porosity retention, underestimatesthe overpressure effect of thesesecondary overpressure mechanisms. Usingvelocity and density data from a well in the Southand North Malay Basin, Wells A and B (Figure1), we illustrate the methodology to identifyoverpressure generation mechanisms in the MalayBasin by using velocity vs. density cross-plotting,and discuss implications for pre-drill prediction.We also review approaches to allow for thesemechanisms i.e. often empirical fi ts to local data,and results from our work in other basins, wherewe have attempted to quantify these mechanismsby integrating basin history with rock propertiesand temperature data.MECHANISMS OF OVERPRESSUREGENERATIONIn environments such as the Malay Basin,Gulf of Mexico and Nile Delta, where rates ofsedimentation are high, the sediments are youngand with low geothermal gradients, pore pressureprofi les through shale-dominated sequences canbe estimated confi dently using seismic velocity,wireline sonic and resisitivity data. Assumptionsare that the basin is extensional and that the mainmechanism of overpressure generation is under-Registered in England No.03359723
compaction as a result of ineffective dewatering,referred to as disequilibrium compaction (Hubbertand Ruby, 1959). These profi les are typicallyoverburden parallel (Swarbrick et al., 2002), i.e.increasing pressure with increasing depth with (a)constant porosity, implying (b) constant verticaleffective stress (overburden minus pore pressure).Such pore pressure profi les are present in theNorth Malay Basin (Yussof and Swarbrick, 1994;Figure 2). Another example is shown in Figure 2 inMadon (2007). In both these examples, a seriesof thin and/or undrained, thicker sands encasedin shales contain WFT (Wireline Formation Test)data, that acts as a proxy for measuring shalepressures. In both cases, sharp pressure transitionzones are present involving the deep reservoirs,producing overburden-convergent pressureprofi les, and suggesting secondary mechanismsare likely present (Figure 2).As porosity is reduced to low values as a resultof mechanical compaction during burial andthe temperature increases (for instance, above70oC in some basins; Gulf of Mexico, Bruce1984), mineralogical changes occur in the shales.These changes lead to the two main processesof secondary overpressure generation, fl uidexpansion/volume change and load transfer (orframework weakening).Fluid expansion/volume processes includedehydration reactions such as gypsum toanhydrite, and smectite to a more dehydratedform. Smectite to illite transformation produceswater released and silica, which will tend toprecipitate locally. The release of bound water intosediment pores is minor in terms of generatingoverpressure (Swarbrick, and Osborne 1998).Maturation of hydrocarbons, particularly inthe case of gas generation, produces rapidvolume expansion, reducing effective stress andincreasing pore pressure. These fl uid expansionmechanisms such as gas generation anddehydration reactions generate overpressurethat can be calculated using Bowers (1994), arelationship that is based on velocity and changesin effective stress, where porosities are low.Other mechanisms involve changes in rockcompressibility. If the rock compressibilityis increased, there will be an extra loadsuperimposed onto the fl uid phase as a resultof the applied stress. These processes involveweakening of the framework and pore collapsedriven by clay diagenesis and dissolution offramework-supporting grains such as kerogen andK-feldspar (Lahann (2001, 2002) and referred toas load transfer in Swarbrick et al, 2002). Thesereactions only occur where the temperatureexceeds about 80oC, although in youngersediments the temperature at onset is moretypically > 100-120oC.<strong>Pressure</strong>s generated in shales, where porosityis low, temperatures are increasing, and claymineral diagenesis and hydrocarbon generationare ongoing, are transmitted to any associatedsands, particularly sands of restricted extent suchas turbidites. Many pressure depth profi les inshale-dominated facies e.g. Nile Delta, Mann andMacKenzie (1990) show increasing overpressurewith depth, proof of reservoir isolation and closecoupling with the enclosing shales e.g. in theMalay Basin, Figure 2. Thicker, sands that arelaterally extensive have more capacity to allowthe dissipation of these pressures if a leak orexit point is established via continuous reservoiror fault networks to shallower levels. Examplesof reservoirs that have less pressure than thesurrounding shales and are laterally drainingpressures (and fl uids) include the Paleocene fansof the Central North Sea (Dennis et al., 2000,2005), as well as the Egga Sandstone Formation,Registered in England No.03359723
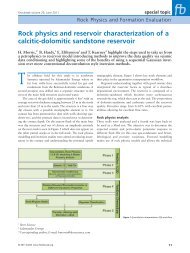
Cementation such by silica will strengthen therock framework, reducing permeability (aidingoverpressure retention) and increasing the velocityof the shales. Density increases may be variable,depending on the types of cement and itsdistribution.Log data is the primary input for these cross-plots,therefore, logs were initially processed, depthmatched and shale data extracted using a cutoffbased on gamma-ray data as an indicator oflithology. Caliper logs were used to remove theeffects of wash-out that affect borehole integrityand can cause inaccurate log responses. Finally,a moving average fi lter can be applied to removespurious values such as high velocity spikes duethe localised cementation.RESULTS FROM THE MALAY BASINEvidence for secondary processes in the MalayBasin is presented in Figures 4 and 5. Bothdensity and sonic data were available for thesewells. In Well A, in the South of the Malay Basin,the top of overpressure is at 1.2km, whereby shalepressures increase parallel to the overburden (aspredicted successfully by the Equivalent DepthMethod, not shown). Below 2.0 km TVDss, shalepressures under-estimate the K and L reservoirpressures by 1500-2000 psi. These reservoirs areun-drained, massive sands, overlain by thick shalesequences (Hoesni, 2004). The estimated porepressure at TD is 7093 psi (15.8 ppg) (Hoesni,2004). Figure 4 displays the velocity/densityrelationship for this well. Deviation is observedfrom the primary compaction curve of Bowers(2001) at temperatures of 120oC, although moresignifi cantly at 160oC. This signature of increasingvelocity and density is identifi ed by Hoesni et al.(2007) as suggestive of chemical compaction/cementation effects.In Well B, sandy lithologies pre-dominate deeperthan in Well A, therefore overpressure commencesat 1.8 km TVDss. Shales dominate belowthis depth, and reservoirs display increasingoverpressures. High mud-weights were used tocontrol the pore pressure in this well, and indeed,shale pressure prediction using the EquivalentDepth Method (not shown) suggest mud-weightsused in the well were signifi cantly below theshale pressures. The well was abandoned, dueto wellbore instability problems attributed to highpore pressures; at 2747m TVDss, mud-weightsused were 17.6 ppg (Hoesni, 2004). Figure 5displays velocity and density for Well B as wellas the estimated borehole temperatures. Thedepth at which the shale pressure interpretationby the Equivalent Depth Method proves to beinaccurate i.e. under-estimates pore pressuresas confi rmed by WFT measurements in thin,encased sands, is approximately 2.4 km TVDss(Hoesni, 2004), corresponding to 124oC using ageothermal gradient of 51.8oC/km (Malay Basin;Halim, 1994). A defl ection to slower velocity andincreased density occurs at this temperature –this trend is similar to that shown in Figure 3. Thetrend is representative of load transfer i.e. thetransformation of kerogen to hydrocarbons (oiland/or gas), porosity as K-feldspar dissolves and/or smectite to illite – all of these processes affectrock compressibility and load the fl uid phase.DISCUSSIONMadon (2007) states that disequilibriumcompaction is the primary source of overpressuregeneration in the Malay Basin centre, caused byhigh sedimentation rates. Modeling results suggestthat overpressure generated early during the synriftphase when sedimentation rates were high(>1000 m Ma). As post-rift rates were lower (
500 m Ma), no overpressure was generated in thisphase, such that current overpressure patternsare due to re-distribution of overpressure via faultsand regional seals (F and L shales). Evidencefrom our analysis suggests that additionaloverpressure mechanisms may exist in the MalayBasin, mechanisms that are not associated witha porosity anomaly and therefore problematical todetect. These mechanisms are identifi ed to be dueto load transfer processes. Hoesni et al (2007)also provide evidence for secondary processesin the Malay Basin via unloading, although typicaltrends of rapid velocity loss (Figure 3) are notvisible on many velocity vs. density cross-plotsdue to the effects of chemical compaction (viacementation) as typifi ed in Figure 4 from Well A.Hoesni et al. (2007) defi ne a model for chemicalcompaction where shale framework collapse withpartial dewatering, followed by sequential fi lling ofpore spaces in shales by cement occurs, in bothstorage (inter-granular) and connecting pores. Thiscementation results in enhanced seal capacity forshales acting as vertical barriers to migration.Analysis of velocity vs. density cross-plotdata from Well B produces deviation fromtypical shale trends characteristic of normalcompaction/disequilibrium compaction (i.e. aprimary compaction curve) (Bowers, 2001). Thedefl ection to higher density and lower velocityis characteristic of load transfer, where rockcompressibility is affected, resulting in a differentcompaction profi le. This type of signature isreported from the Gulf of Mexico by Lahann(2001, 2002), and associated with changesin rock compressibility by smectite to illitetransformation during clay diagenesis at 80oC(Figure 6). However, several factors such as timeand clay type affect the temperature of onset ofthis transformation. Data in Lahann (2002) fromthe Gulf of Mexico suggests that overpressures of1500-3000 psi can be attributed to this process.Typically, 100-120oC is the temperature range atwhich signifi cant overpressure can be generatedby this method. The departure from the primarycompaction trend in Figure 5 occurs at 120oCIt is not possible without further analyses e.g.of shale samples to ascertain compaction andmineralogical state, to determine which processaffecting rock compressibility is present/occurring.Unloading as defi ned by Bowers (1994, 2001),causes reduction in effective stress and velocity,assuming plastic and elastic sediment behaviour.Where processes occur that affect compressibility,this behaviour will be inelastic, and the compactionstate of the rock permanently altered (Katahara,2006). Although the velocity/effective stress modelin Lahann (2002) for the Pathfi nder well resemblesan unloading curve as discussed in Bowers(1994), this method may only offer a partialsolution to pre-drill pore pressure prediction, whereload transfer processes are present, such asthe Malay Basin. In order to model the effects ofchanges in rock compressibility, a post-unloadingcompaction model as discussed in Lahann (2001,2002) could be defi ned (if suffi cient data exists).This model can be applied to data which are toodeep to be accurately modelled by a Bowersstyleunloading curve. The entire well profi le canbe modelled with a primary curve, a Bowersstyleunloading curve, and a deep compactionmodel. Alternatively, the unloading interval maybe interpreted by a mixing function that changeswith depth from the primary model to the deepcompaction model.This study (and Hoesni et al., 2007), wouldpropose that there is also evidence for additionalprocesses that generate overpressure in thisbasin, caused by the high geothermal gradients.An important outcome of this study is, therefore,Registered in England No.03359723
that more complete understanding of the effectsand changes in rock compressibility are neededas these parameters cannot be measured/predicted pre-drill. <strong>Pressure</strong> models based onsonic log or seismic velocity analysis data willnot be accurate if the techniques mentioned inthis paper are used e.g. Equivalent Depth, Eaton(1975) and potentially Bowers (1994). Clearly, inbasins where temperatures are elevated e.g. theMalay Basin, velocity data could prove problematicbelow 2.0 km, therefore using seismic data willsignifi cantly under-estimate pressures by 1000’spsi – a major drilling safety issue.Potential solutions often rely on fi nding empiricalfi ts to existing data and applying locally, or usingrelationships derived in different basins, andapplied worldwide. An example of the former iscited in published analyses by Dolson et al. (2005)from the Nile Delta. In these datasets, seismicinterval velocities are considered too fast for theMiocene section, resulting in inaccurate calculationof pore pressures. Using an Eaton exponent of5.0 in Wells such as Akhen-1, however, providesa match with reservoir data. Geothermal gradientdata of 25oC/km in Manzoni et al (1998) suggestsMiocene shales of the Qantara Formation are likelyaffected by thermal processes, transmitted tothese reservoirs.A more robust approach is to use velocity vs.density cross-plots in conjunction with knowledgeof overpressure mechanisms, rock properties andunderstanding of basin history. For example, theLower Cretaceous deep-water Lange Formationshales provide a continuous cover of fi ne-grainedsediment over the Halten Terrace, Mid-Norway.From analysis of temperature data, the 100oCisotherm is generally shallower than the Langeshales and therefore the shales are in the windowwhere these thermally-driven mechanisms couldbe a factor. Density log data increases with depth,indicative of a primary compaction curve. Thesuggestion is that overpressuring to the currentlevels proceeded independently of porosity lossi.e. there is a signifi cant component of secondaryoverpressure is the Halten Terrace region thatpost-dated compaction and has no associatedporosity anomaly (Hermanrud et al., 1998).A burial curve based on composite log data forWell 6506/11-6 (not shown) demonstrate twoperiods of rapid burial (1) Turonian/ Campanianand (2) Plio-Pleistocene. Work by Skar et al.(1999) suggests that pressures were hydrostaticprior to this latest burial due to pressure bleed-offduring the Tertiary hiatus. The relative contributionsof the rapid loading during the Plio-Pleistocene(1.7 km of sediment; Norgård Bolås et al.,2005) and secondary contribution to the currentLange pore pressure profi le in Well 6406/2-3 areillustrated in Figure 7 (GPT/IHS, 2007). The blueline on the left is the hydrostatic (normal) pressurestarting point at 3 Ma ago. The darker blue line toits right represents the pore pressure profi le afterthe rapid burial event, with a constant contributionto overpressure from rapid loading via ineffectivedewatering. The current Lange pore pressureprofi le (as defi ned by WFT data in encasedintra-formational sands, often four per well, anddefi ning a regional shale gradient) is indicated bypurple line on the right of the fi gure.For the deeply buried rocks such as the Langeshales, already having low permeability, thisadditional overburden will be translated intooverpressure (assuming no signifi cant dewatering)by:1.7 km sediment thickness x (lithostatic gradient of3.28 psi/m - water gradient of 1.45 psi/m) = 2711psiRegistered in England No.03359723
Therefore, at 4.0 km depth in Figure 7, usingthe purple line representing current pressures inthe Lange indicates approximately 4350 psi ofoverpressure (1639 psi greater than recent loadinghistory calculated above could have generated).In such old and hot rocks, seismic-based velocityprediction of pore pressure would be unreliable,as there is no porosity/effective stress link. Thedifference between dark blue and purple linesrepresents our best estimate of the contributionto overpressure from diagenetic changes inthe shales. Velocity vs. density cross-plotanalysis suggests load transfer (smectite toillite transformation, K-feldspar dissolution etc.)processes are active in these shales, with areduction in velocity, and increase in density.CONCLUSIONSIn conclusion, in the Malay Basin, there is astrong correlation between rate of sedimentationand overpressure development by disequilibriumcompaction. However, as wells are drilled deeperinto this Basin (and other basins world-widebelow the 100oC isotherm), thermal processesin shales will result in secondary overpressuregeneration, and, if this overpressure is transmittedto reservoirs, pre-drill predictions of pore pressurewill be inaccurate, compromising safety.Using traditional techniques of pore pressureprediction such as Equivalent Depth and Eaton(1975) will be inadequate. Bowers (1994) offersonly a partial solution. New relationships willneed to be developed based on integrating anunderstanding of basin history, shale behaviour,clay mineral diagenesis, thermal behaviour andgeological time to successfully predict porepressures in this, and other, hot and deep basinsworld-wide.ACKNOWLEDGMENTSThe authors would like to extend their thanks tothe organizing committee for the chance this workat the IPA Conference, 18-20th May, 2011.REFERENCESBowers, G., 1994. <strong>Pore</strong> pressure estimationfrom velocity data: Accounting for overpressuremechanisms besides undercompaction. IADC/SPE 27488, IADC/SPE Drilling Conference, p.515-530.Bowers, G., 2001. Determining an appropriatepore-pressure estimation strategy. OTC 13042,Offshore Technology Conference.Bruce 1984. Smectite dehydration – its relationto structural development and hydrocarbonaccumulation in northern Gulf of Mexico Basin.AAPG Bulletin, v. 68, No.6, p. 673-683.Chopra, S and Huffman, A. 2003. Velocitydetermination for pore-pressure prediction. TheLeading Edge; December 2006; v. 25; no. 12; p.1502-1515Dennis, H, Baillie, J, Torleif, T, Holt, T and Wessel-Berg, D. 2000. Hydrodynamic activity and tiltedoil-water contacts in the North Sea. NorwegianPetroleum Society Special PublicationsVolume 9, 2000, Pages 171-185Registered in England No.03359723
Dennis, H, Bergmo, P and Holt, T. 2005 Tiltedoil–water contacts: modeling the effects of aquiferheterogeneity Petroleum Geology Conferenceseries 2005, v. 6, p. 145-158Dolson, J.C, Boucher, P.J, Siok, J and Heppard,P.D 2005 Key challenges to realizing full potentialin an emerging giant gas province: Nile Delta/Mediterranean, deep-water, Egypt. In: Dore A.Gand Vining, B (eds) Petroleum Geology: North-WestEurope and Global Perspectives – Proceedings ofthe 6th Petroleum Geology Conference, p. 607-624.Eaton, B. 1975. The equation for geopressureprediction from well logs. Society of PetroleumEngineers of AIME, SPE 5544, 11 p.Gardner, G.H.F., Gardner, L.W. and Gregory,A.R. 1974. Formation velocity and density: thediagnostic for stratigraphic traps. Geophysics, 39,770-780.GPT/IHS Mid-Norway <strong>Pressure</strong> Study, 2007. Non-Proprietary study by Geo<strong>Pressure</strong> Technology and IH S Energy.Halim, M, F. 1994 Thermal regimes of Malaysiansedimentary basins Volume: 78:7; Conference:AAPG International Conference and Exhibition,Kuala Lumpur (Malaysia), 21-24 Aug 1994.Hermanrud, C., Wensaas, L., Teige, G.M.G.,Norgård Bolås, H.M., Hansen, S. & Vik, E. 1998.Shale Porosities from Well Logs on Haltenbanken(Offshore Mid-Norway) Show No Infl uence ofOverpressuring, In Law, B.E., Ulmishek, G.F.& Slavin, V.I. (eds.), Abnormal pressures inhydrocarbon environments: AAPG Memoir 70, pp.65-85, The American Association of PetroleumGeologists.Hoesni, M.J., Swarbrick, R.E, and Goulty, N.R2003. The Origins of overpressure in the MalayBasin AAPG Barcelona Conference, Spain.Hoesni, M.J. 2004. The origin of overpressure inthe Malay Basin and its infl uence on petroleumsystems. Unpublished PhD thesis, University ofDurham.Hoesni, M.J., Swarbrick, R.E, and Goulty, N.R2007. The Signifi cance of Chemical Compactionin Modeling the Overpressure in the Malay BasinAAPG Hedberg Conference, The Hague, TheNetherlands.Hubbert, M. K., Ruby, W. W. 1959. The role of porepressure in mechanics of mechanics of overthrustfaulting. Geol. Soc.Am. Bull. 70, 115-166.Kathara, K., 2006, Overpressure and shaleproperties: Stress unloading or smectite-illitetransformation?. 76th annual International Meeting,SEG, Expanded Abstracts, paper PPP 1.2, p.1520-1524.Lahann, R., McCarty, D. & Hsieh, J. 2001. Infl uenceof Clay Diagenesis on Shale Velocities and Fluid<strong>Pressure</strong>. OTC 13046, Offshore TechnologyConference.Lahann, R., 2002. Impact of smectite diagenesison compaction profi les and compaction equilibrium.In AADE Industry Forum on <strong>Pressure</strong> regimes insedimentary basins and their prediction. Del LagoResort, Lake Conroe, Texas. 2-4 September 1998.Madon, M. 2007. Overpressure development in riftbasins: an example from the Malay Basin, offshorePeninsular Malaysia Petroleum Geoscience v. 13;no. 2; p. 169-180Registered in England No.03359723
Mann, D.M., and MacKenzie, A.S., 1990.<strong>Prediction</strong> Of <strong>Pore</strong> <strong>Pressure</strong>s In SedimentaryBasinsMarine and Petroleum Geology, v. 7, no. 1, p. 55– 65Mazzoni, R, Wahdan, T, Bassem, A and Ward,D.C 1998. Real-Time pore and fracture pressureprediction with FEWD in the Nile Delta SPE/IADC37669.Mohamad, H, Jaini, N and Tajuddin, M. R 2006drilling of deep-seated reservoir in high pressureregime in the north of malay basin. PetroleumGeology Conference and Exhibition 2006, 27-28th November, 2006. Kuala Lumpur ConventionCenter, Kuala Lumpur, MalaysiaNorgård Bolås, H.M., Hermanrud, C. & Teige,G.M.G., 2005. The infl uence of stress regimeson hydrocarbon leakage. In: Boult, P. & Kaldi,J. eds. Evaluating fault and cap rock seals,AAPG Hedberg Series, 2, 109-123. AmericanAssociation of Petroleum Geologists.O’Connor, S.A and Swarbrick, R.E, 2008. Wherehas all the pressure gone? Evidence frompressure reversals and hydrodynamic fl ow. FirstBreak, v. 26 September 2008Singh, I and Ford, C.H. 1982. The occurrence,causes and detection of abnormal pressure inthe Malay Basin. Offshore South East Asia Show,9-12 February 1982, SingaporeSkar, T., Van Balen, R.T., Arnesen, L. & Cloetingh,S. 1999. Origin of overpressures on the HaltenTerrace, offshore mid-Norway: the potential roleof mechanical compaction, pressure transfer andstress, In: Aplin, A.C., Fleet A.J. & Macquaker,J.H.S (eds.) Muds and Mudstones: Physical andFluid Flow Properties, Geological Society SpecialPublication no. 158, pp.137-156, GeologicalSociety of London. ISBN 1-86239-030-4.Swarbrick, Richard E., Osborne, Mark J.,and Gareth S. Yardley, 2002. Comparison ofoverpressure magnitude resulting from the maingenerating mechanisms. AAPG Memoir 76, A. R.Huffman and G. L. Bowers, eds.Yusoff, W.I. and Swarbrick, R.E. 1994. Thermaland <strong>Pressure</strong> Histories of the Malay Basin,Offshore Malaysia. AAPG International Conferenceand Exhibition, Kuala Lumpur, Malaysia, August21-24, 1994Osborne, M. J. and Swarbrick, R. E., 1997.Mechanisms which generate overpressure insedimentary basins: a reevaluation. AAPGBulletin, v 81, p 1023-1041.Shariff Bin Kader, M. 1994. Abnormal <strong>Pressure</strong>Study in the Malay and Penyu Basins: A RegionalUnderstanding. Bulletin of the Geological Societyof Malaysia, 36, p. 81-91.Registered in England No.03359723
Figure 1 - Location map for Malay Basin adapted from Madon (2007).Locations of all wells mentioned in the text are displayed.Registered in England No.03359723
Figure 2 -Well LA-3, Malay Basin (Yusoff and Swarbrick (1994). WirelineFormation Test (WFT) data (blue ovals) refi nes an overburdenparallelshale pore pressure profi le, characteristic of overpressuregenerated by disequilibrium compaction (black line). Sharp pressuretransition zone below 100oC suggests additional overpressuregenerated by secondary processes (based on geothermal gradientof 51.8oC/km, Halim (1994). See text for discussion.Registered in England No.03359723
Figure 3 -Typical Velocity vs. Density signatures and their associated, causalmechanisms of overpressure generation (from Hoesni, 2004).Registered in England No.03359723
Figure 4 -Velocity vs. density data plotted for Well A. Estimated boreholetemperatures also plotted. Deviation is observed from the primarycompaction curve of Gardner (red line) and Bowers (2001) (blueline) for shales at temperatures of 120oC, although moresignifi cantly at 160oC. This signature of increasing velocity anddensity is identifi ed by Hoesni et al. (2007) as suggestive ofchemical compaction/cementation effects.Registered in England No.03359723
Figure 5 -Velocity vs. density data plotted for Well B. Deviation is observedfrom the primary compaction curve of Gardner (red line) and Bowers(2001) (blue line) for shales at temperatures of 120oC. Thissignature of increasing velocity and density is identifi ed assuggestive of load transfer effects (refer to Figure 3).Registered in England No.03359723
Figure 6 -An example of velocity/density behavior that requires load transferinterpretation in Gulf of Mexico. Solid blue line represents theprimary compaction curve. In this case, the load transfer (or“unloading” termed by the author) shift (orange squares) occurredwithin the smectite-illite reaction window (Lahann, 2002).Registered in England No.03359723
Figure 7 -Hydrostatic pressure (light blue), contribution to overpressure fromrecent rapid burial (light blue to dark blue) and contribution tooverpressure from load transfer (dark blue to purple) for LangeFormation shales, Halten Terrace, Mid-Norway. Reservoiroverpressures, as measured by WRT data in encased shales in theLange Formation, are substantially higher than could have beencreated by burial-related processes alone.OPTIMISE SUCCESS THROUGH SCIENCERegistered in England No.03359723