Pore Pressure Prediction TLE Nov 2012 Swarbrick - Ikon Science
Pore Pressure Prediction TLE Nov 2012 Swarbrick - Ikon Science
Pore Pressure Prediction TLE Nov 2012 Swarbrick - Ikon Science
- No tags were found...

Create successful ePaper yourself
Turn your PDF publications into a flip-book with our unique Google optimized e-Paper software.
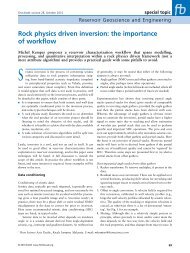
Case Studyvelocity—bulk density point according to a suitabledepth interval (e.g., different color each 500m or 1000 feet for example). Increasing burial inthe shallow section is always toward higher velocityand increase in bulk density. Mild development ofoverpressure has the effect of slowing the rate of velocityincrease and bulk density reduction, whereasrapid changes in overpressure may be observed by“reversals” whereby velocity decreases with increasingdepth/vertical stress (but decreasing vertical effectivestress), and bulk density becomes lower atthe same time. Each point remains on or near the“normal compaction curve,” i.e., on trend A (Figure2).Influence of temperature on fluid propertiesTemperature changes fluid properties, in particularreducing density of water and/or hydrocarbonsas well as changing the state of hydrocarbons fromliquid to gas. Because temperatures increase withdepth (at a rate of approximately 30°C/km ± 10°C/km inmost basin settings), pore water has a tendency toward densityreduction and fluid expansion (the compressibility ofwater has the effect of increasing water density but the effectrarely outweighs the temperature effect of density reduction).Barker (1972) first described the fluid expansion of buriedwater and suggested that there would be a significant reductionin vertical effective stress as overpressure was created inthe host sediment. In fact, later research (e.g., Luo and Vasseur,1992; <strong>Swarbrick</strong> et al., 2002) has shown that the effectis small (< 500 psi even with ultralow-permeability rocks). Interms of volume change, the most significant effect is foundin the generation of methane and other light hydrocarbonmolecules during kerogen maturation (e.g., Meissner, 1976;Ungerer et al., 1983) and during in-situ oil to gas cracking(Barker, 1990).Bowers (1994, 1995) extended the use of velocity-bulkdensity plots to capture the behavior of shale mudrocks during“unloading”—i.e., when effective stress is reduced duringuplift/vertical stress reduction and/or during fluid expansionwhen pore pressures increase from an earlier “maximum”vertical effective stress but without complementary reductionin vertical stress. Because velocity is in part a functionof grain-to-grain contact stress, the effect of vertical effectivestress reduction during fluid expansion is to decrease the shalemudrock velocity. Bulk density, however, will only reduce accordingto the poroelastic behavior of the rock, which is aminor change in porosity. Hence the pathway documentedduring unloading on a velocity-bulk density crossplot is trendB on Figure 2.Figure 2. Velocity-density crossplot illustrating evolutionary pathways withincreasing vertical effective stress (trend A), unloading (trend B), combined porosityreduction/decrease in vertical effective stress (trend C), and chemical compaction(trends D and E).Influence of temperature on rock propertiesBecause traditional pore-pressure prediction relies on predictiverock properties, temperature-driven changes in thegrain-to-grain contact relationship challenge the original assumption,i.e., that porosity attributes can be related to porepressure through the Terzaghi effective stress law. Temperaturecan have a range of effects including:• Precipitation of cements, making the rock stiffer, and/orfilling pore space;• Dissolution of rock grains, ultimately causing collapse ofthe rock structure and reducing pore space;• Weakening of rock grains (more ductile behavior),• Mineral transformation (e.g., smectite to illite; kaoliniteto illite)The full details of chemical diagenesis in shale mudrocksremain poorly known, but reactions such as smectite to illitetransformation (see Lahann, 2001) or kaolinite to illite(Lahann and <strong>Swarbrick</strong>, 2011a) have been documented inrelation to their influence on vertical effective stress. Both ofthese reactions are kinetically controlled, and occurring overtemperatures in the range 80–150°C (Lahann, personal communication)but where recognition is more typically observedaround 100–110°C. A consequence of these transformationreactions to illite (and potentially other reactions) is that therock becomes more compressible and original grain supporthas been lost—a process referred to as “load transfer” (see Lahannand <strong>Swarbrick</strong>, 2011b). Many more chemical pathwaysinvolving common minerals in shale mudrocks are possible,which together with the transformations mentioned abovecreate highly unpredictable compaction behavior.Load transfer has the effect of decreasing shale mudrockporosity as minerals (such as illite) are packed more tightly(illite has a preferred orientation of the grains which permitmore efficient packing but which collapse easily when escapeof water allows compaction). The transfer of load, if not accompaniedby expulsion of pore fluid, results in increase inpore pressure and a decrease in vertical effective stress. Thisbehavior is captured on trend C on Figure 2, where a rangeof possible pathways are illustrated to emphasise the multiplecomplementary reactions and load transfers associated withdifferent transformations.<strong>Nov</strong>ember <strong>2012</strong> The Leading Edge 1289
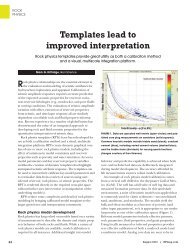
Case StudyFigure 3. Example of data used to determine relationship betweensedimentation rate and fluid retention depth (FRD). In this case,multiple reservoir pressures measurements have revealed a lithostaticgradient-parallel profile of pore pressure, from which the FRD hasbeen determined by intersection with the hydrostatic gradient. Datafrom a wide variety of global basin settings were used to constructFigure 4. Redrawn and modified from Nile Delta data in Mann andMackenzie (1990).Trends in velocity-bulk density have been noted byHoesni (1994) in the Malay Basin in which both velocityand bulk density increase. The interpretation of trend D onFigure 2 is interpreted as chemical compaction of the shalemudrock without reduction of effective stress. It is likely thatthis type of compaction results in pore-filling cements andconcurrent escape of displaced fluids through the connectingpores without development of additional overpressureand simultaneous reduction of vertical effective stress. It isnoted that subsequently, and when bulk densities reach valuesin excess of approximately 2.60–2.65 g/cc, the rate of velocitychange increases, likely reflecting ultralow porosity in theshale mudrock as bulk density approaches rock matrix values(and a minimum porosity). Within this range of densities(i.e., above about 2.60 g/cc) there is no clear discriminationof process (e.g., unloading, load transfer, etc.).<strong>Pore</strong>-pressure prediction at high temperaturesThe above changes in rock and fluid properties impact verticaleffective stress used with porosity attributes such as sonicvelocity and resistivity to predict pore pressures. Bowers(1995) offers a solution when there is fluid expansion andreduction in effective stress, when solving for velocity, withthe following equation:Velocity = Vo + a[σ max(σ/σ max) (1/u) ] bwhere Vo is taken as 5000 ft/s, a and b are empirical and locallyderived constants, σ is vertical effective stress and u isthe elastoplastic term.The previous equation can be used with confidence wherea clear trend B (Figure 2) can be identified on velocity-bulkdensity crossplots of well data. From the author’s experiencea true “unloading” trend of near-constant density and velocitydecrease is rare. Most trends can best be described as oneof the trend C type profiles shown in Figure 2. There are nopublished solutions for pore-pressure prediction for trend C.Tingay et al., (2009) developed a semiregional correctionto the standard Eaton equation, where the modification ofthe exponent of 3.0 (Eaton, 1975) to a value of 6.5 is requiredto provide a close predictive result when using sonic velocityin a subset of the wells from Brunei. Velocity-bulk densitytrends were not included in this study, only velocity-verticaleffective stress to capture velocity reduction with decrease invertical effective stress along a pseudo-unloading trend. Thissolution is locally calibrated for local use but does not providea relationship which can be applied universally for pore-pressureprediction at elevated temperatures in shale mudrocks.The author has experience of sharp transition zones (rapidreduction in vertical effective stress over a narrow depth interval)in shale mudrocks (and intra-formational reservoirs)accompanied by moderate to severe cementation, identifiedby their ultralow porosity (near matrix bulk density values).Examples include deeply buried, old shale mudrocks such asfound in the Triassic of the Central Graben HPHT play, aswell as young, Miocene sediments in southeast Asia. Bothsequences exhibit no relationship between vertical effectivestress (as inferred from direct pressure tests in interbeddedreservoirs) and porosity. In the case of the Miocene rocks (atdepths in region of 4.0 km and temperatures of 130°C), theporosity is low but vertical effective stress is high, the oppositeto a normal relationship for pore-pressure prediction inyoung, rapidly buried sediments. Yet the shales and reservoirshave high overpressure, created in main by rapid burial. Inthese undrained shale mudrocks, aggressive cementation ismasking any usable prediction relationship with porosity. Incases where there is no usable relationship between porosityattributes (sonic, resistivity, etc.) and effective stress, an alternativegeological-model-based solution is required.Solution using geologic pressure modelDisequilibrium compaction during sediment loading isconsidered the most common cause of overpressure in shalemudrocks (<strong>Swarbrick</strong> et al., 2002). At elevated temperaturesadditional causes of overpressure such as gas generation andmineral transformations/load transfer may contribute, addingto the existing overpressure created by disequilibriumcompaction during burial. Under these conditions the relationshipbetween porosity and effective stress is either obscureor nonexistent and an alternative to a Terzaghi-relationshipapproach is therefore required. One logical startingpoint for pore-pressure prediction would therefore be an estimateof overpressure in shale mudrocks from disequilibriumcompaction alone, using a method independent of vertical1290 The Leading Edge <strong>Nov</strong>ember <strong>2012</strong>
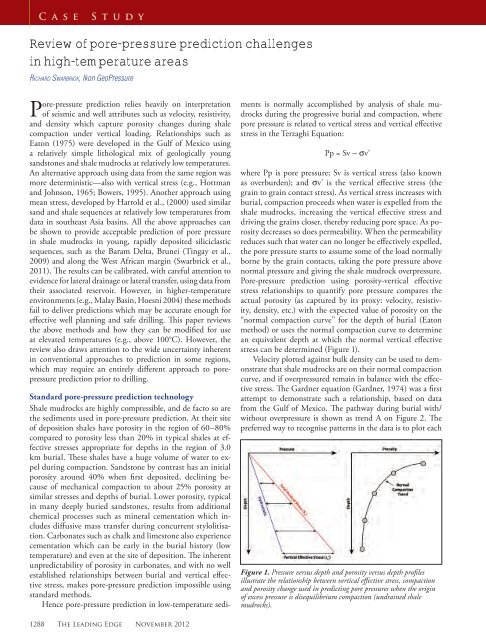
Case StudyFigure 4. Plot of sedimentation rate (log) versus fluid retention depth(for rock column in km) for a set of shale mudrock, silty shales, andsiltstone (updated figure from <strong>Swarbrick</strong> et al., 2002).Figure 5. Schematic plot of a well in basin “X” in which the fluidretention depth method provides a good estimate of overpressure, wherea velocity-based approach underestimates overpressure on account ofchemical compaction at temperatures of about 140°C.effective stress and porosity. <strong>Swarbrick</strong> et al. (2002) demonstrateda broad relationship between the log of sedimentationrate and a “fluid retention depth” (FRD)—a depth below seafloor (when offshore) from which a lithostatic parallel “shalegradient” begins (Figure 3). The original sedimentation rate-FRD relationship from <strong>Swarbrick</strong> et al. (2002) has nowbeen updated with subsets of lithology added for shales, siltyshales, and siltstones from a larger global data set (Figure 4).None of the examples comes from an area in which there arelarge, known tectonic (horizontal compressive) stresses, butrather are known to be areas where rocks are currently consideredat their maximum depth of burial.Sedimentation rate can be derived from depth-convertedseismic data, (where seismic time lines can assigned ages), andcalibrated using age-depth data from associated wells. Theaverage sedimentation rate for the rocks in the top 3.0 km(10,000 feet) was used to determine the majority of valueson Figure 4. Note that the sedimentation rate values plottedon Figure 4 were estimated using current depths of burial(no uplift was evident in any of the examples used in thedata set) and without consideration of back-stripping whichwould estimate the compaction effects during burial. Hencethe same approach should be employed when using the plotfor prediction in new areas—i.e., predictions using these datashould also adopt a simple sedimentation rate calculation approximatingsedimentation rate from depth and age informationalone.As an example of how this prediction method may beshown to work is illustrated using data from a well in theNile Delta (Mann and Mackenzie, 1990) where an averagesedimentation rate is estimated at 810 m/Ma (Figure 3). Applyingthe sedimentation rate of 810 m/Ma and assumingaverage “silty shale” lithology in Figure 4 yields a FRD at adepth 0.8 km. Because RFT data are also reported by Mannand Mackenzie (1990) it is possible to verify this estimate.The RFT data in Figure 3 show a lithostatic-parallel gradientwhen drawing a line through the data over the interval fromapproximately 2.0 to 4.0 km. When this line is extrapolatedto the hydrostatic gradient the intercept occur at approximately0.8 to 0.9 km below mudline, confirming the suitabilityof the earlier prediction of FRD at approximately 0.8 km.Assuming only sedimentation rate is known, then the determinationof FRD provides information about the verticalstress at 0.8 km depth. Assuming the well is located at thecoast (zero water depth) and the FRD is 0.8 km:• The hydrostatic stress at 0.8 km is 8 MPa, assuming anhydrostatic gradient of 10.0 MPa/km.• The total vertical stress is 16.0 MPa, assuming a verticalstress gradient of 20.0 MPa/km as an average from surfaceto 0.8 km.• The vertical effective stress (VES) is therefore 16.0 − 8.0 =8.0 MPa.Because the assumption is for a lithostatic-parallel profileof pressure for the shales, VES remains constant at depth andrepresent the pore-pressure prediction for the shale mudrocks.Hence the pore-pressure prediction for undrained shale mudrocksat 4.0 km will be the vertical stress minus the verticaleffective stress, which is 86.0 − 8.0 = 78 MPa, where the lithostaticstress averages 21.5 MPa/km down to 4.0 km and thevertical effective stress remains at 8.0 MPa.The FRD method described above has now captured thevertical effective stress to define a vertical stress/lithostatic stressparallel shale pressure gradient. The method can be used todetermine the approximate pressure regime of shale mudrocksindependent of any rock property data. In low-temperatureregimes the method provides an independent method to comparewith porosity attribute driven pore-pressure estimates. Inhigh-temperature regimes, the method may be the only oneto offer a useful estimate of overpressures if the porosity-basedmethods are severely influenced by chemical compaction. Areduction in porosity (e.g., because of the load transfer orchemical compaction) leads to pressure predictions which areunderestimates. The shale-pressure-gradient method capturesthe contribution from burial and disequilibrium compaction1292 The Leading Edge <strong>Nov</strong>ember <strong>2012</strong>
Case StudyFigure 6. Workflow suggested for pore-pressure prediction analysis based on lithology, temperature, and overpressure-generating mechanisms. Theworkflow leads to loose definitions of confidence.irrespective of the rock properties. Contributions to overpressurefrom secondary mechanisms will need to be estimated,with varying degrees of uncertainty, and added to the contributionfrom compaction disequilibrium.Case studyBasin “X” is known to have high overpressure in Mioceneshales and associated reservoirs beneath a normally pressured,sand-rich delta-top sequence almost 4.0 km thick. The temperatureat the base of the sandstone-rich sequence is about140°C and the shales at this depth and temperature have densitiesin the region 2.6–2.65 g/cc and velocities in the regionof 4200 m/s. The density values indicate low porosities, on theorder of < 5.0%, which when using rock properties and globalshale normal compaction trends for density predict little tono overpressure. By contrast, the sonic velocities indicate upto 17.0 MPa overpressure in the same zone, estimates usinga normal compaction curve developed from analysis of theshale interbeds in the logged interval within the overburdenand the associated thick, normally pressured reservoirs. Bycontrast the actual overpressure encountered was much higherat 51.5 MPa, at the base of a sharp pressure transition zone.Estimates of overpressure using the FRD method describedabove estimates the overpressure to be on the order of 50.0 to55.0 MPa at the same depth and a much more useful predictionmethod than velocity. The reason for the ultralow porosityis not yet known (but expected to be quartz or other diageneticreaction) and any contribution to overpressure fromelevated temperatures is not known either. However, the measuredoverpressure is close to the estimate from rapid burialbased on sedimentation rate from a Miocene age marker at itscurrent depth of burial, and represents a more useful predictionfor well planning than the use of rock properties whereporosity has been severely impacted by chemical compaction.A schematic representation of the data and results are shownon a pressure-depth plot in Figure 5.The principal warning of this case study is that velocity,even though it is sensitive to effective stress (unlike density—see review by Bowers, 1994), grossly underestimates the overpressureacross this pressure transition zone. In fact, there is agrowing global database of deep drilling in high overpressureareas (including the central North Sea and mid-Norway, forexample) which illustrates the apparent contradiction of lowporosity and high overpressure. In old, deep, and hot shalemudrocks many pathways to create high overpressure may existand disequilibrium compaction contribution may be uncertain.In the case study above, the young, rapidly depositedsediments will have created enough overpressure from disequilibriumcompaction alone to explain the magnitude of overpressure,without recourse to other mechanisms. It is thereforeimperative to perform the pore pressure estimate from sedimentationrate to capture the “minimum” magnitude fromvertical stress loading, recognizing the pore-pressures will behigher if other, thermally driven mechanisms are present aswell.ConclusionsTraditional methods to accurately predict pore pressures usingrock properties are restricted to shale mudrocks at temperaturesless than about 100°C. The most likely cause ofoverpressure will be disequilibrium compaction (undrainedshales) alone and vertical effective stress relationships canbe developed with confidence to quantify pore pressures. Athigher temperatures, chemical compaction, mineral transformationsand other processes distort those relationships andmake pore-pressure prediction unreliable. Use of velocity-<strong>Nov</strong>ember <strong>2012</strong> The Leading Edge 1293
Case Studydensity crossplots facilitates examination of two key rockattributes used in pore-pressure prediction and assists inrecognizing mechanisms of overpressure generation and therequirements to adopt more sophisticated prediction methodologies.Figure 6 illustrates a workflow which captures theprocess described above, including a geologic model to estimateoverpressure from compaction disequilibrium compactionas well as any lateral drainage and lateral transfer effects.This geologic model helps to build confidence of prediction inlow temperature environments, but is especially important athigh temperatures.ReferencesBarker, C., 1972, Aquathermal pressure—role of temperature in developmentof abnormal pressure zones: AAPG Bulletin, 56, 2068–2071.Barker, C., 1990, Calculated volume and pressure changes during thethermal cracking of oil to gas in reservoirs: AAPG Bulletin, 74,1254–1261.Bowers, G. L., 1994, <strong>Pore</strong> pressure estimation from velocity data: Accountingfor overpressure mechanisms besides undercompaction:International Association of Drilling Contractors/Society of PetroleumEngineers Drilling Conference Dallas, SPE, Paper 27488,515–530.Bowers, G. L., 1995, <strong>Pore</strong> pressure estimation from velocity data: Accountingfor overpressure mechanisms besides undercompaction:SPE Drilling and Completion, 10, no. 2, 89–95, http://dx.doi.org/10.2118/27488-PA.Eaton, B. A., 1976, Graphical method predicts geopressures worldwide:World Oil, July 1976, 100–104.Eaton, B. A., 1975, The equation for geopressure prediction from welllogs: SPE paper 5544.Gardner, G. H. F., L. W. Gardner, and A. R. Gregory , 1974, Formationvelocity and density: the diagnostic for stratigraphic traps:Geophysics, 39, 770–780, http://dx.doi.org/ 10.1190/1.1440465.Harrold, T., R. E. <strong>Swarbrick</strong>, and N. R. Goulty, 1999, <strong>Pore</strong> pressureestimation from mudrock properties in Tertiary basins, S. E. Asia:AAPG Bulletin, 83, no. 7, 1057–1067.Hoesni, M. J., 2004, The Origins of overpressure in the Malay Basinand its influence on petroleum systems: PhD thesis, University ofDurham.Hottman, C. E. and R. K. Johnson, 1965, Estimation of formationpressures from log-derived shale properties: Journal of PetroleumTechnology, June, 717–722, doi: http://dx.doi.org/ 10.2118/1110-PA.Lahann, R., D. McCarty, and J. Hsieh, 2001, Influence of Clay Diagenesison Shale velocities and Fluid <strong>Pressure</strong>: OTC 13046, OffshoreTechnology Conference.Lahann, R. W. and R. E. <strong>Swarbrick</strong>, 2011, Overpressure generationby load transfer following shale framework weakening due tosmectite diagenesis: Geofluids, 11, no. 4, 362–375, http://dx.doi.org/10.1111/j.1468-8123.2011.00350.x.Luo, X. and G. Vasseur, 1992, Contributions of compaction and aquathermalpressure to geopressure and the influence of environmentalconditions: AAPG Bulletin, 76, 1550–1559.Mann, D. M. and A. S. Mackenzie, 1990, <strong>Prediction</strong> of pore fluidpressures in sedimentary basins: Marine and Petroleum Geology,7, no. 1, 55–65, http://dx.doi.org/10.1016/0264-8172(90)90056-M.Meissner, F. F., 1976. Petroleum geology of the Bakken FormationWilliston Basin, North Dakota and Montana, (24th Annual Conference,Williston Basin Symposium) Montana Geological Society,207–227.<strong>Swarbrick</strong>, R. E., M. J. Osborne, and G. S. Yardley, 2002, Comparisonof Overpressure Magnitude resulting from the Main GeneratingMechanisms, in A. R. Huffman and G. L. Bowers eds., <strong>Pressure</strong>regimes in sedimentary basins and their prediction: AAPGMemoir, 76, 1–12.<strong>Swarbrick</strong>, R. E., S. A. O’Connor, and R. W. Lahann, 2011, Occurenceand prediction of high-pressure sediment along the WestAfrican margin: The Leading Edge, no. 6, 682–687, http://dx.doi.org/ 10.1190/1.3599155.Tingay, R. P., R. R. Hillis, C. K. Morley, R. C. King, R. E.<strong>Swarbrick</strong>, and A. R. Damit, 2009, Present-day stress and neotectonicsof Brunei: Implications for petroleum exploration andproduction: AAPG Bulletin, 93, no. 1, 75–100, http://dx.doi.org/10.1306/08080808031.Ungerer, P., E. Behar, and D. Discamps, 1983, Tentative calculationof the overall volume expansion of organic matter during hydrocarbongenesis from geochemistry data, Implications for primarymigration, Advances in Organic Geochemistry, 129–135.Acknowledgments: Rick Lahann and Steve O’Connor are thankedfor comments on an early version. Alex Edwards is thanked forassistance in creating the database illustrated in Figure 4. NeilBraunsdorf and Martin Albertin are thanked for valuable editorialassistance.Corresponding author: R<strong>Swarbrick</strong>@ikonscience.comHardrock Seismic ExplorationEdited by David W. Eaton, Bernd Milkereit, and Matthew H. SalisburySeismic methods have excellent depth penetration and resolving power for deep exploration in hardrock terranes.Through integrated case histories and introductory chapters on the basic principles of seismic acquisition, processing,modeling, and interpretation techniques, this book strikes a fine balance among tutorial, review, application,and future research directions, emphasizing the growing importance of seismic exploration methods in the hardrockenvironment (“old” techniques applied to “new” targets). Researchers interested in high-resolution applications ofcrustal seismology, geophysicists involved with mineral exploration and development, geotechnical engineers, andseismic processors will find this book an invaluable aid in the challenges of seismic exploration of hardrock terranes.ISBN 978-1-56080-114-6 Catalog #131APublished 2003, 270 pages, Hardcover SEG Members $23, List $29, E-book $29To Order: www.seg.org/bookmart or E-mail books@seg.org1294 The Leading Edge <strong>Nov</strong>ember <strong>2012</strong>