Determinants of Stock Prices: Empirical Evidence from NSE 100 ...
Determinants of Stock Prices: Empirical Evidence from NSE 100 ...
Determinants of Stock Prices: Empirical Evidence from NSE 100 ...
Create successful ePaper yourself
Turn your PDF publications into a flip-book with our unique Google optimized e-Paper software.
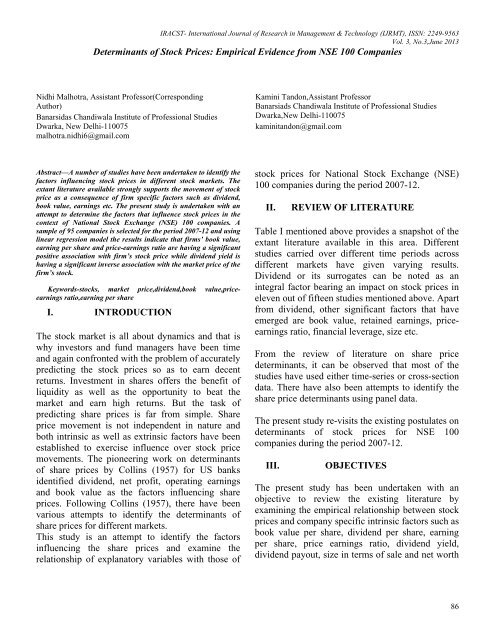
IRACST- International Journal <strong>of</strong> Research in Management & Technology (IJRMT), ISSN: 2249-9563Vol. 3, No.3,June 2013<strong>Determinants</strong> <strong>of</strong> <strong>Stock</strong> <strong>Prices</strong>: <strong>Empirical</strong> <strong>Evidence</strong> <strong>from</strong> <strong>NSE</strong> <strong>100</strong> CompaniesNidhi Malhotra, Assistant Pr<strong>of</strong>essor(CorrespondingAuthor)Banarsidas Chandiwala Institute <strong>of</strong> Pr<strong>of</strong>essional StudiesDwarka, New Delhi-1<strong>100</strong>75malhotra.nidhi6@gmail.comKamini Tandon,Assistant Pr<strong>of</strong>essorBanarsiads Chandiwala Institute <strong>of</strong> Pr<strong>of</strong>essional StudiesDwarka,New Delhi-1<strong>100</strong>75kaminitandon@gmail.comAbstract—A number <strong>of</strong> studies have been undertaken to identify thefactors influencing stock prices in different stock markets. Theextant literature available strongly supports the movement <strong>of</strong> stockprice as a consequence <strong>of</strong> firm specific factors such as dividend,book value, earnings etc. The present study is undertaken with anattempt to determine the factors that influence stock prices in thecontext <strong>of</strong> National <strong>Stock</strong> Exchange (<strong>NSE</strong>) <strong>100</strong> companies. Asample <strong>of</strong> 95 companies is selected for the period 2007-12 and usinglinear regression model the results indicate that firms’ book value,earning per share and price-earnings ratio are having a significantpositive association with firm’s stock price while dividend yield ishaving a significant inverse association with the market price <strong>of</strong> thefirm’s stock.Keywords-stocks, market price,dividend,book value,priceearningsratio,earning per shareI. INTRODUCTIONThe stock market is all about dynamics and that iswhy investors and fund managers have been timeand again confronted with the problem <strong>of</strong> accuratelypredicting the stock prices so as to earn decentreturns. Investment in shares <strong>of</strong>fers the benefit <strong>of</strong>liquidity as well as the opportunity to beat themarket and earn high returns. But the task <strong>of</strong>predicting share prices is far <strong>from</strong> simple. Shareprice movement is not independent in nature andboth intrinsic as well as extrinsic factors have beenestablished to exercise influence over stock pricemovements. The pioneering work on determinants<strong>of</strong> share prices by Collins (1957) for US banksidentified dividend, net pr<strong>of</strong>it, operating earningsand book value as the factors influencing shareprices. Following Collins (1957), there have beenvarious attempts to identify the determinants <strong>of</strong>share prices for different markets.This study is an attempt to identify the factorsinfluencing the share prices and examine therelationship <strong>of</strong> explanatory variables with those <strong>of</strong>stock prices for National <strong>Stock</strong> Exchange (<strong>NSE</strong>)<strong>100</strong> companies during the period 2007-12.II.REVIEW OF LITERATURETable I mentioned above provides a snapshot <strong>of</strong> theextant literature available in this area. Differentstudies carried over different time periods acrossdifferent markets have given varying results.Dividend or its surrogates can be noted as anintegral factor bearing an impact on stock prices ineleven out <strong>of</strong> fifteen studies mentioned above. Apart<strong>from</strong> dividend, other significant factors that haveemerged are book value, retained earnings, priceearningsratio, financial leverage, size etc.From the review <strong>of</strong> literature on share pricedeterminants, it can be observed that most <strong>of</strong> thestudies have used either time-series or cross-sectiondata. There have also been attempts to identify theshare price determinants using panel data.The present study re-visits the existing postulates ondeterminants <strong>of</strong> stock prices for <strong>NSE</strong> <strong>100</strong>companies during the period 2007-12.III.OBJECTIVESThe present study has been undertaken with anobjective to review the existing literature byexamining the empirical relationship between stockprices and company specific intrinsic factors such asbook value per share, dividend per share, earningper share, price earnings ratio, dividend yield,dividend payout, size in terms <strong>of</strong> sale and net worth86
for <strong>NSE</strong> <strong>100</strong> companies during the period 2007-08to 2011-12.IRACST- International Journal <strong>of</strong> Research in Management & Technology (IJRMT), ISSN: 2249-9563Vol. 3, No.3,June 2013S.No. Authors/Researchers Factors Identified Year Market1. Zahir & Khanna dividend per share, yield, book value 1981 India2. Srivastava dividend 1984 India3. Balkrishan book value and dividend per share 1984 India4. Chawla & Srinivasan dividend and retained earnings 1987 India5. Karathanassis anddividend, retained earnings, size 1988 GreecePhilippas6. Midani earnings per share, financial leverage 1991 Kuwait7. Zahir dividend, earnings and yield 1992 India8. Irfan and Nishat dividend yield, leverage, payout ratio,size2002 Pakistan9. Sen & Ray dividend payout ratio 2003 India10. Mehta& Turanmarket capitalization, market price tobook value ratio andprice-earnings ratio2005 India11. Singhania book value, dividend, dividend cover,dividend yield, earnings and priceearningsratio2006 India12 AL-Omar andbook value per share, earning per share 2008 KuwaitAL-Mutairi13. Khan dividend 2009 Bangladesh14. Somoye et al. earnings per share, foreign exchangerate, gross domestic2009 Nigeriaproduct, lending interest rate15. Uddin dividend, earning per share, net assetvalue per share2009 BangladeshTable I Previous Studies on <strong>Determinants</strong> <strong>of</strong> <strong>Stock</strong> <strong>Prices</strong>87
IRACST- International Journal <strong>of</strong> Research in Management & Technology (IJRMT), ISSN: 2249-9563Vol. 3, No.3,June 2013IV.RESEARCH METHODOLOGYThe study undertaken is analytical in nature usingsecondary data for the purpose <strong>of</strong> empiricalevaluation <strong>of</strong> stock price and explanatory variables.Sample population is <strong>of</strong> <strong>NSE</strong> <strong>100</strong> companies. Out <strong>of</strong>these <strong>100</strong> companies, 95 companies have beenselected on the basis <strong>of</strong> the following criterion:The company should have been in existence duringthe last five years i.e.2007-2012.• The company should not have skipped thedividend during the period <strong>of</strong> study i.e.,<strong>from</strong> 2007 to 2012.• The companies should have dividend aboveand equal to 5 crore.• No financial data required for the calculationshould be missing.Accordingly mentioned in Table II is a summary <strong>of</strong>the sample companies sector wise.Table II List <strong>of</strong> Sample CompaniesName <strong>of</strong> sectorBanking and financing 30Auto sector 18Pharma and Drug sector 15IT sector 12Power sector 10No. <strong>of</strong> companiesA linear multiple regression model has been used tomeasure the combined effects <strong>of</strong> explanatoryvariables on the dependent variable. The generalform <strong>of</strong> multiple linear equation is:Y=b0+b1X1+b2X2+b3X3+………+bnXn (1)Where, Y = dependent variable, X1, X2,X3……..Xn = independent variables, B1, b2,b3………..bn=regression coefficient <strong>of</strong> independentvariables.The statistical significance <strong>of</strong> regression coefficientshave been worked out and tested with the help <strong>of</strong> ttest. The coefficient <strong>of</strong> determination is computed todetermine the percentage variation in the dependentvariables explained by independent variables. Alsoadjusted R-square (R 2) and change statistic valuesare measured. The ‘F’ values are also computed totest the significance <strong>of</strong> R 2 with ‘F’ distribution atfive percent level <strong>of</strong> significance.Accordingly, the null hypothesis so framed is asfollows:H 0: There is no significant relationship between MP(market price) and independent variables such asBV (book value), EPS (earning price per share),DPS (dividend per share), DC (dividend cover), DY(dividend yield) and P/E (price earning) ratioH 1: There is a significant relationship between MP(market price) and independent variables such asBV (book value), EPS (earning price per share),DPS (dividend per share), DC (dividend cover), DY(dividend yield) and P/E (price earning) ratioCement sector 10V .THEORETICAL BACKGROUNDCorrelation & Linear Regression ModelThe study deploys correlation and a linear multipleregression models to measure the effect <strong>of</strong> theindependent variables on the dependent variable.Also to avoid the problem <strong>of</strong> multi-collinearity,backward elimination procedure <strong>of</strong> regression hasbeen used.The following relationship <strong>of</strong> independentvariables with dependent variable is formed:MP = f (BV, EPS, DPS,DC, DY & P/E ratio)Where, MP = Market Price <strong>of</strong> the equity share,BV = book value,DPS = Dividend per Share,88
EPS = Earning Price Share,DC = Dividend Cover,DY = Dividend Yield,P/E ratio = Price Earnings ratioMarket Price (MP) : It is the average price <strong>of</strong> theshare derived <strong>from</strong> the financial year high and lowhas been considered as market price. It is the currentprice at which an asset or service can be bought orsold.MP= (High Price + Low Price)/2 (2)Where, High Price = Highest market price duringthe financial year, Low Price = Lowest market priceduring the financial year.Book Value (BV): It is also known as net assetvalue per share because it measures the amount <strong>of</strong>assets, which the corporation has on behalf <strong>of</strong> eachequity share. BV shows the net investment per sharemade in the business by the shareholder. It is thevalue at which an asset is carried on a balance sheet.It can be calculated as follows:BV =(Reserves + Equity Capital –Revaluation Reserves)No. <strong>of</strong> outstanding shares (3)No. <strong>of</strong> outstanding shares is the total number <strong>of</strong>equity shares held by the company.Dividend per share(DPS): Dividend is the portion<strong>of</strong> the pr<strong>of</strong>it after tax, which is distributed to theshareholders for their investment bearing risk in thecompany. It has a significant influence on themarket price <strong>of</strong> the share. DPS shows how much thecompany has paid out as dividend. It refers to theactual amount <strong>of</strong> dividend (gross) declared pershare. The net pr<strong>of</strong>it after taxes belong toshareholders but the income that they really receiveis the amount <strong>of</strong> earnings distributed and paid ascash dividend. DPS is calculated as under:DPS = Dividend t,n (4)No. <strong>of</strong> outstanding sharesIRACST- International Journal <strong>of</strong> Research in Management & Technology (IJRMT), ISSN: 2249-9563Vol. 3, No.3,June 2013Where, DPS t,n refers to amount <strong>of</strong> dividendpaid by company t in the year n.Earning Per Share(EPS) : It refers to the ratio <strong>of</strong>the pr<strong>of</strong>it after tax <strong>of</strong> the company for any financialyear after payment <strong>of</strong> preference dividend .Theequity shareholders are the sole claimants to the netearnings <strong>of</strong> the corporation after making payment <strong>of</strong>dividend to the preference shareholders. Thesignificance <strong>of</strong> this ratio flows <strong>from</strong> the fact thathigher the earnings per share the more is the scopefor a higher rate <strong>of</strong> dividend and also <strong>of</strong> retainedearnings, to build up the inner strength <strong>of</strong> thecompany.EPS = Net Pr<strong>of</strong>it After Tax – Preference Dividend (5)No. <strong>of</strong> outstanding sharesDividend Cover(DC): is the ratio <strong>of</strong> company'searnings (net income) over the dividend paid toshareholders, calculated as earnings per sharedivided by the dividend per share. It shows theextent to which DPS is protected by the earning <strong>of</strong>the company. Dividend cover is the reciprocal <strong>of</strong>dividend payout ratio, which is calculated asDPS/EPS.DC = EPS t,n (6)DPS t,nWhere EPS t,n refers to earning per share for thecompany t in the year n and DPS t,n refers todividend per share for the company t in the year n.Price Earnings Ratio (P/E ratio) : This ratioenables an investor to make appropriatecalculation <strong>of</strong> the time required to cover hisinvestment in a company’ s stock.P/E ratioexpresses the relationship between the market price<strong>of</strong> a company’s share and its earnings per share. Itindicates the extent to which the earnings <strong>of</strong> eachshare are covered by its price.It can be calculatedas:P/E ratio = MP t,n (7)EPS t, n89
Where MP t,n is the market price per share <strong>of</strong>company t in the year n and EPS t,n is the earning pershare <strong>of</strong> company j in year t.Dividend Yield (DY) : It is the return earned by anequity shareholder by way <strong>of</strong> dividends. A financialratio that shows how much a company pays out individends each year relative to its share price. In theabsence <strong>of</strong> any capital gains, the dividend yield isthe return on investment for a stock. It is a way tomeasure how much cash flow you are getting foreach dollar invested in an equity position - in otherwords, how much "bang for your buck" you aregetting <strong>from</strong> dividends. Investors who require aminimum stream <strong>of</strong> cash flow <strong>from</strong> their investmentportfolio can secure this cash flow by investing instocks paying relatively high, stable dividend yields.Dividend yield is used to calculate the earning oninvestment (shares) considering only the returns inthe form <strong>of</strong> total dividends declared by the companyduring the year. Its reciprocal is the Price/Dividendratio. It has positive correlation with dependentvariable market price. DY is calculated as follows:DY = DPS t, n * <strong>100</strong> (8)MP t,nWhere DPS t,n is the dividend per share <strong>of</strong> company tin the year n and MP t,n is the market price <strong>of</strong> theshare <strong>of</strong> company j in the year t.VI.DATA ANALYSISTable III Mean & Standard DeviationMEAN MP BV EPS DPS DC DY P/E RATIO2007 670.467 151.0683 56.58223 10.86645 7.644601 11.19234 19.699652008 554.7484 176.3696 53.02053 9.74734 5.213446 10.9964 19.424812009 553.5442 159.4697 56.55649 10.17766 6.353819 10.0093 17.455272010 805.3301 180.0413 74.6967 12.62021 6.373571 10.47716 20.327662011 769.3561 194.4082 70.67638 12.36064 5.765652 11.16999 19.753212012 924.7918 204.7773 82.74298 11.93085 6.341391 10.68283 17.78922IRACST- International Journal <strong>of</strong> Research in Management & Technology (IJRMT), ISSN: 2249-9563Vol. 3, No.3,June 2013It can be observed <strong>from</strong> Table III that values <strong>of</strong> theexplained variable i.e. market price as well as theexplanatory variables is fluctuating over the period2007-12.Particularly there is a downturn during2008-09 which could be owing to global financialcrisis leading to overall economic slowdown. Thestandard deviation <strong>of</strong> MP <strong>from</strong> its mean isdecreasing during 2008 and 2009 but takes a sharpincrease in the following years. Deviation <strong>of</strong> BVincreases sharply in 2008 and then shows a mixedtrend during 2009-12 whereas with respect to EPS,the deviation narrows down in 2008 and thengradually increases for the period 2009-12. DPS andDC both depict a similar trend in terms <strong>of</strong> standarddeviation. P/E ratio like DC witnesses a steep fall indeviation in 2008 and then has a fluctuating trendover the remaining time period. DY throughout hasa mixed trend.As it can be noted <strong>from</strong> Table IV, the EPS hashighest positive correlation with market price i.e.,.620. Dividend yield is the only explanatoryvariable having negative correlation with marketprice i.e., -.85 and all others have positivecorrelation with dependent variable, MP. BV andDY show negative correlation with each other i.e., -.33. EPS, DY and P/E ratio show the negativecorrelation with each other. DPS has positivecorrelation with other independent correlation P/Eratio i.e., -.169. DC has only negative correlationwith DY otherwise with other independent variablesit has positive correlation. But DY has positivecorrelation with EPS but negative correlation withother variables such as DPS, EPS, BV and DC. P/Eratio exhibit negative correlation with EPS and DPSotherwise with rest has positive correlation. Thecorrelation analysis depicts the highest correlation<strong>of</strong> EPS with the MP. Other independent variablesBV, EPS, DPS, DC, DY, P/E ratio have positivecorrelation with MP but DY has negativecorrelation with MP.STDEV. MP BV EPS DPS DC DY P/E RATIO2007 1243.897 116.3657 82.63569 10.25414 23.21307 33.38716 23.968132008 980.9183 250.0194 73.66741 8.083943 5.033993 23.03272 26.552009 964.3396 110.7041 97.38407 9.979012 6.857165 18.51306 34.006932010 1484.576 133.3889 156.9029 15.34033 8.916217 17.65607 31.095092011 1356.145 156.2453 165.1776 13.73387 8.170194 17.61462 34.226032012 1921.253 183.9565 200.749 10.55242 9.687285 15.51833 29.72247Source: Author’s self-calculationFindings <strong>from</strong> the regression analysis result for theselected firms as depicted in table V indicates that<strong>from</strong> the model, the R 2 which is <strong>of</strong>ten referred to as90
the coefficient <strong>of</strong> determination <strong>of</strong> the variables is0.516. The R-Squared which is also a measure <strong>of</strong>Table IV Correlation StatisticsIRACST- International Journal <strong>of</strong> Research in Management & Technology (IJRMT), ISSN: 2249-9563Vol. 3, No.3,June 2013.196 **.511 956.104-.033 -.025 .205 *CorrelationModel SummaryMP BV EPS DPS DC DY P/E ratioMod R MP R Pearson Adjusted 1 Std. .383 *Error .620 *<strong>of</strong> the .243 *Estimate .225 * -el Square Correlation R Square* * * *.085 *Sig. (2- .000 .000 .000 .000 .045 .0001 .7 .516 tailed)9 a BV Pearson .383 * 1 .287 * .270 * .086 * -.033 .0011 N 609 562 562 562 562 562 562** *Correlationa. Predictors: (Constant), P/E ratio, BV, DC, DY, DPS, EPSSig. (2- .000 .000 .000 .041 .428 .973tailed)N 562 562 562 562 562 562 562EPS Pearson .620 * .287 * 1 .370 * .413 * -.025 -.131 **Correlation* ** *Sig. (2- .000 .000 .000 .000 .559 .002tailed)N 562 562 562 562 562 562 562DP Pearson .243 * .270 * .370 * 1 .011 .205 * -.169 **S Correlation* * **Sig. (2- .000 .000 .000 .799 .000 .000tailed)N 562 562 562 562 562 562 562DC Pearson .225 * .086 * .413 * .011 1 -.054 .008Correlation**Sig. (2- .000 .041 .000 .799 .202 .852tailed)N 562 562 562 562 562 562 562DY Pearson --.054 1 .109 **Correlation .085 * *Sig. (2- .045 .428 .559 .000 .202 .009tailed)N 562 562 562 562 562 562 562P/E Pearson .196 * .001 - - .008 .109 * 1ratioCorrelation*.131 **.169 ***Sig. (2- .000 .973 .002 .000 .852 .009tailed)N 562 562 562 562 562 562 562**. Correlation is significant at the 0.01 level (2-tailed)*. Correlation is significant at the 0.05 level (2-tailed)Table VSource:Author’sselfcalculationTable VI91
IRACST- International Journal <strong>of</strong> Research in Management & Technology (IJRMT), ISSN: 2249-9563Vol. 3, No.3,June 2013Coefficients aModelUnstandardizedCoefficientsStandardizedCoefficientsTSig.1(Constant)B Std. Error Beta-170.092 76.259 -2.230 .026BV 1.649 .260 .200 6.338 .000EPS 6.019 .360 .607 16.701 .000DPS 4.240 4.034 .036 1.051 .294DC -5.917 3.785 -.051 -1.563 .119DY -6.607 1.936 -.105 -3.413 .001P/ERATIO13.328 1.386 .293 9.617 .000a. Dependent Variable: mpSource: Author’s self calculationTable VII92
IRACST- International Journal <strong>of</strong> Research in Management & Technology (IJRMT), ISSN: 2249-9563Vol. 3, No.3,June 2013ANOVA bModelSum <strong>of</strong>SquaresDFMeanSquareFSig.1Regression5.414E8 6 9.024E798.717.000 aResidual 5.073E8 555 914135.225Total 1.049E9 561a. Predictors: (Constant), p/eratio, bv, dc, dy, dps, epsb. Dependent Variable: mpSource: Author’s self‐calculationthe overall fitness <strong>of</strong> the model indicates that themodel is capable <strong>of</strong> explaining about 51.6% <strong>of</strong> thevariability in the share prices <strong>of</strong> firms. This meansthat the model explains about 51.6 % <strong>of</strong> thesystematic variation in the dependent variable. Thatis, about 48.4% <strong>of</strong> the variations in movement <strong>of</strong>stock prices <strong>of</strong> the sampled firms are accounted forby other factors not captured by the model.Thisresult is complimented by the adjusted R 2 <strong>of</strong> about51.1%, which in essence is the proportion <strong>of</strong> totalvariance that is explained by the model.Analyzing further empirical findings listed in tableVI depict that there is a significant positiverelationship between firms’ book value and themarket value <strong>of</strong> share prices <strong>of</strong> the listed firms in<strong>NSE</strong> <strong>100</strong>. This is evident in the t-statistics value <strong>of</strong>0.000 and p-value>|t| (95% confidence level) Thisoutcome basically implies that with all othervariable held constant, an increase or a change inthe book value <strong>of</strong> the firms, say by one percent willon the average bring about a 1.649% percentincrease in the market price <strong>of</strong> shares. That is anincrease in the book value <strong>of</strong> firms will also lead toa positive improvement in the share prices <strong>of</strong> listedfirms. Noticeably, the results <strong>of</strong> the present study isin line with the propositions <strong>of</strong> Zahir & Khanna(1981) Balkrishan (1984), Singhania (2006) andAL-Omar and AL-Mutairi (2008) where the resultsindicated that book value significantly influencedthe market value <strong>of</strong> share prices. Similarly, furtherempirical findings enlisted in table VII also showthat there is a significant positive relationshipbetween firms’ earning per share and the marketvalue <strong>of</strong> share prices. This is evident in the t-statistics value <strong>of</strong> 16.701 and the p-value>|t|. Theresults can be explained as that an increase inearning per share will invariably bring about asignificant increase in the market prices <strong>of</strong> equityshares. Importantly this outcome is consistent withefindings provided in Midani (1991), AL-Omar andAL-Mutairi (2008), Somoye et al(2009),Uddin(2009) where it has been observed that earning pershare is a major determinant <strong>of</strong> stock prices. Thenext significant factor that emerges out <strong>of</strong> theempirical findings is dividend yield which has aninverse relationship with that <strong>of</strong> market price. Thisresult basically means that with the influence <strong>of</strong>other variable held constant, as firms dividend yield93
changes; say by one percent, on average, marketprice <strong>of</strong> share changes by 6.607 percent in theopposite direction. These results are supported withthe findings <strong>of</strong> Zahir & Khanna (1981),Zahir(1992),Irfan & Nishat (2002).Finally theregression analysis brings out a significantrelationship between price earnings ratio and marketprice. This is evident <strong>from</strong> the t-statistics value <strong>of</strong>(9.617 and p-value >|t| at 95% confidence level.These results corroborate with those <strong>of</strong> Mehta &Turan (2005) and Singhania (2006).The remainingfactors namely dividend per share and dividendcover are the insignificant factors as per the analysisnot having much <strong>of</strong> an impact on the market price<strong>of</strong> stocks.Referring to table VII, it can be noted <strong>from</strong> theFishers ratio (i.e. the F-Statistics which is a pro<strong>of</strong> <strong>of</strong>the validity <strong>of</strong> the estimated model) that the p-valuethat is less than 0.05 (p-value < 0.05); this hasinvariably clear implications that the explanatoryvariable are significantly associated with thedependent variable. That is, they strongly determinethe behavior <strong>of</strong> the market movement <strong>of</strong> stockprices.VII.IRACST- International Journal <strong>of</strong> Research in Management & Technology (IJRMT), ISSN: 2249-9563Vol. 3, No.3,June 2013CONCLUSIONThis study primarily examined the effects <strong>of</strong> bookvalue, earning per share, dividend per share,dividend yield, dividend cover and price earningsratio on <strong>from</strong> the study the share price <strong>of</strong> firmslisted on <strong>NSE</strong> <strong>100</strong>. The findings <strong>of</strong> the study for theperiod 2007-12 revealed that firms’ book value,earning per share and price-earnings ratio arehaving a significant positive association with firm’sstock price while dividend yield is having asignificant inverse association with the market price<strong>of</strong> the firm’s stock. Together these four variablesexplain 51.6% <strong>of</strong> the dependent variable. Theresults indicated above are in close conformity withthe findings <strong>of</strong> the previous studies- Zahir (1992),Singhania (2006), Somoye et al (2009).Theremaining variables namely dividend cover anddividend per share are not significantly impactingmovement f stock prices listed on <strong>NSE</strong> <strong>100</strong>.Thefindings <strong>of</strong> the present study are particularly usefulfor investors and fund managers as they can watchout for these significant factors while analyzingstock returns and predicting future prices.As nearly 48.4% <strong>of</strong> the movement in stock pricesremains unexplained thus there is scope for furtherresearch in this area as there are factors not includedin the study which can precisely explain theremaining unexplained movement <strong>of</strong> stock prices.REFERENCES[1] Al-Omar, H. and Al-Mutairi, A. 2008, TheRelationship between the Kuwaiti Banks Share<strong>Prices</strong> and Their Attributes. Scientific Journal <strong>of</strong>King Faisal University (Humanities andManagement Sciences), 9(1): 325-338.[2] Balkrishnan(1984), "<strong>Determinants</strong> <strong>of</strong> Equity<strong>Prices</strong> in India", Management Accountant, Vol. 19,No. 12 (Dec), p. 728-730[3] Chawla, D. and Srinivasan, G. 1987., Impact <strong>of</strong>Dividend and Retention on Share Price – AnEconometric Study. Decision, 14(3): 137-140.[4] J. 1957, How to Study the Behavior <strong>of</strong> Bank<strong>Stock</strong>s. The Analysts Journal, 13(2): 109-113.[5] Irfan, C. M. and Nishat, M. 2002, KeyFundamental Factors and Long-run Price Changesin an Emerging Market - A Case Study <strong>of</strong> Karachi<strong>Stock</strong> Exchange (KSE). The Pakistan DevelopmentReview, 41(4): 517–533.[6] Karathanassis, G. and Philippas, N,1988,Estimation <strong>of</strong> bank stock price parameters andthe variance components model, AppliedEconomics, 20(4): 497-507.[7] Khan,S. H. 2009. <strong>Determinants</strong> <strong>of</strong> Share PriceMovements in Bangladesh: Dividends and RetainedEarnings. Retrieved April 29, 2010 <strong>from</strong>http://btu.se/fou/cuppsats.nsf/all/7a3a58f2c2af8ba1c1257695000a3b1d/$file/Final%20Version.pdf.[8] Mehta, S. K. and Turan, M. S. 2005.<strong>Determinants</strong> <strong>of</strong> <strong>Stock</strong> <strong>Prices</strong> in India: An <strong>Empirical</strong>94
Study. The Journal <strong>of</strong> Indian Management andStrategy, 10(4): 37-43.[9] Midani, A. 1991. <strong>Determinants</strong> <strong>of</strong> Kuwaiti<strong>Stock</strong> <strong>Prices</strong>: An <strong>Empirical</strong> Investigation <strong>of</strong>Industrial Services, and Food Company Shares.Retrieved April 29, 2010 <strong>from</strong> h t t p : / / q s p a c e. q u. e d u . q a / b i t s t r e am/ h a n d l e / 1 0 5 76 / 6 9 0 8 / 0 4 9 1 0 2 - 0 0 0 8 - fulltext.pdf?sequence=3.[10]Sen ,S. and Ray, R. 2003, Key <strong>Determinants</strong> <strong>of</strong><strong>Stock</strong> <strong>Prices</strong> in India. The ICFAI Journal <strong>of</strong> AppliedFinance, 9(7): 35-40.[11]Somoye, R. O. C., Akintoye, I. R. and Oseni, J.E. 2009, <strong>Determinants</strong> <strong>of</strong> Equity <strong>Prices</strong> in the <strong>Stock</strong>Markets. International Research Journal <strong>of</strong> Financeand Economics, 30: 177-189.[12]Srivastava, S. C. 1968. Share <strong>Prices</strong>, Dividendsand Earnings. Economic and Political Weekly,3(48): 89- 95.[13] Uddin, M. B. 2009. <strong>Determinants</strong> <strong>of</strong> marketprice <strong>of</strong> stock: A study on bank leasing andinsurance companies <strong>of</strong> Bangladesh. Journal <strong>of</strong>Modern Accounting and Auditing, 5(7): 1-7.[14] Zahir, M. A. 1992, Factors Affecting Equity<strong>Prices</strong> in India. The Chartered Accountant, 40(9):743-748.[15] Zahir, M. A. and Khanna, Y. 1982,<strong>Determinants</strong> <strong>of</strong> <strong>Stock</strong> <strong>Prices</strong> in India. TheChartered Accountant, 30(8): 521-523.IRACST- International Journal <strong>of</strong> Research in Management & Technology (IJRMT), ISSN: 2249-9563Vol. 3, No.3,June 201395


