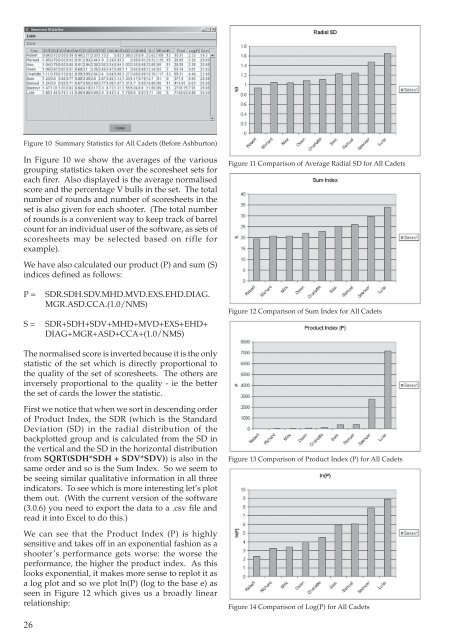
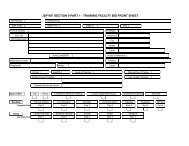
Figure 10 Summary Statistics for All Cadets (Before Ashburton)In Figure 10 we show the averages of the variousgrouping statistics taken over the scoresheet sets foreach firer. Also displayed is the average normalisedscore and the percentage V bulls in the set. The totalnumber of rounds and number of scoresheets in theset is also given for each shooter. (The total numberof rounds is a convenient way to keep track of barrelcount for an individual user of the software, as sets ofscoresheets may be selected based on rifle forexample).Figure 11 Comparison of Average Radial SD for All CadetsWe have also calculated our product (P) and sum (S)indices defined as follows:P =S =SDR.SDH.SDV.MHD.MVD.EXS.EHD.DIAG.MGR.ASD.CCA.(1.0/NMS)SDR+SDH+SDV+MHD+MVD+EXS+EHD+DIAG+MGR+ASD+CCA+(1.0/NMS)Figure 12 Comparison of Sum Index for All CadetsThe normalised score is inverted because it is the onlystatistic of the set which is directly proportional tothe quality of the set of scoresheets. The others areinversely proportional to the quality - ie the betterthe set of cards the lower the statistic.First we notice that when we sort in descending orderof Product Index, the SDR (which is the StandardDeviation (SD) in the radial distribution of thebackplotted group and is calculated from the SD inthe vertical and the SD in the horizontal distributionfrom SQRT(SDH*SDH + SDV*SDV)) is also in thesame order and so is the Sum Index. So we seem tobe seeing similar qualitative information in all threeindicators. To see which is more interesting let’s plotthem out. (With the current version of the software(3.0.6) you need to export the data to a .csv file andread it into Excel to do this.)We can see that the Product Index (P) is highlysensitive and takes off in an exponential fashion as ashooter’s performance gets worse: the worse theperformance, the higher the product index. As thislooks exponential, it makes more sense to replot it asa log plot and so we plot ln(P) (log to the base e) asseen in Figure 12 which gives us a broadly linearrelationship:Figure 13 Comparison of Product Index (P) for All CadetsFigure 14 Comparison of Log(P) for All Cadets26
The SDR and Sum Index plots above both showsimilar information, albeit on a different scale.However, the range between the best and worstperformers is not strong.If we take a look at the ln(P) plot however, the samelinear relationship seen in the Sum Index and SDR isalso now present but of greater interest is that there isa stronger separation between the best and worstperformers in the group. The ln(P) (let’s call it theLogP index) seems to have good potential as anumerical characterisation of performance. The lowerthe LogP index, the better the performance.The AshburtonSo how did they do in the Ashburton itself? Well,they won. But let’s take a look at the tabulated resultsbased solely on the two Ashburton ranges, 300 yardsand 500 yards for each of the eight shooters in theteam:Figure 15 Summary Statistics for Stamford School Ashburton TeamWe plot below the LogP index for the eight teammembers taken over the two shoots comprising theAshburton, at 300 yards and 500 yards. Theyperformed quite differently from what would havebeen expected from the scorecard analysis alone.Charlotte put in a good performance with a 33.3, 34.2and shot better than in the trial set of shoots; Samueland Sam also pulled themselves up; Robert andSpencer performed as would have been predictedfrom their earlier scorecard analysis; but Nick, Owenand Richard did not perform to potential. You mightFigure 16 Comparison of Log(P) for Ashburton Teambe tempted to draw the conclusion from this thatCharlotte and Richard thrive under pressure, Robertand Spencer are not really bothered by it, and Nick,Owen and Richard need to work on their matchnerves.SummaryWe have examined an admittedly minimal set ofscoresheets in order to investigate whether numericalgrouping statistics can be applied to produce indicesto rank performance. Although we had only a limitednumber of shooters and scorecards available for thisanalysis, it is nevertheless clear enough that theperformances of the shooters can indeed be rankednumerically in a meaningful way. We suggest thatthe best indicator to use is the LogP index when thereis a reasonable spread in performance between theshooters being compared. In this case the LogP indexgives a fairly linear relationship between performanceand index value. It also has a greater sensitivitycompared to the other linear indicators which alsoshow the same qualitative information. However, ifthe set of shooters are very closely matched, the muchmore sensitive Product Index would perhaps be thebetter choice.It would be very interesting to apply this techniqueto larger data sets for more shooters of varying abilityand experience. This might allow us to calibrate theLogP index by associating numerical values tohistorical performances for a broad spectrum ofshooter abilities; from GB team usual suspects, tonovices.We do not suggest that this technique is any morethan a numerical ranking based on a historical set ofscorecards. At best it can be an aid to team selectors,who have other considerations to take into account.Nonetheless it could be a welcome aid when itbecomes difficult to decide between borderline cases,especially when trying to explain to prospective teamcandidates that they were not selected when theirscorebook looks qualitatively like the other shooterwho was selected.From our limited scorecard data, Robert had a LogPof just over 2. In the Ashburton Charlotte beat this,making a respectable score and with a LogP index ofjust over 1.2.The question is, how low can you go?Afterword and AcknowledgementsThe software may of course be more simply used fora single user as a scoresheet database, together withthe same analysis tools. It is also useful for producingbespoke scoresheets, which may appeal in particularto the F Class community who experiment withdifferent target faces at different distances. You couldset up your target patterns for, say, the Palma targetface at 1100 yards if you were so inclined, or a 600yards face at 1000 yards, and produce scoresheets with27