1 The Photoelectric Effect - Measurement of the Planck constant
1 The Photoelectric Effect - Measurement of the Planck constant
1 The Photoelectric Effect - Measurement of the Planck constant

You also want an ePaper? Increase the reach of your titles
YUMPU automatically turns print PDFs into web optimized ePapers that Google loves.
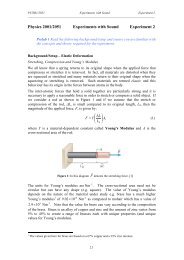
1 <strong>The</strong> <strong>Photoelectric</strong> <strong>Effect</strong> -<strong>Measurement</strong> <strong>of</strong> <strong>the</strong> <strong>Planck</strong> <strong>constant</strong>(Reference: Mansfield and O’Sullivan pp. 362–365)In 1899 J.J. Thomson found that under certain conditions electrons are emitted froma clean metal surface when it is exposed to electromagnetic radiation (light). Thisphenomenon is called <strong>The</strong> <strong>Photoelectric</strong> <strong>Effect</strong>. Three years later P. Lenard studiedhow <strong>the</strong> energy <strong>of</strong> <strong>the</strong>se electrons varied with <strong>the</strong> intensity <strong>of</strong> <strong>the</strong> light and found tohis surprise that <strong>the</strong>re was no dependence at all. Doubling <strong>the</strong> light intensity onlydoubled <strong>the</strong> number <strong>of</strong> electrons emitted, but did not affect <strong>the</strong> energies <strong>of</strong> <strong>the</strong> emittedelectrons.However, Lenard had a very powerful arc lamp with sufficient intensity to study <strong>the</strong> photoelectriceffect using light in different wavelength ranges. He found that <strong>the</strong> maximumenergy <strong>of</strong> <strong>the</strong> ejected electrons did indeed depend on <strong>the</strong> wavelength and that shorterwavelength (higher frequency) would lead to electrons ejected with more energy. Belowa certain frequency, f 0 , no electrons would be emitted at all, regardless <strong>of</strong> <strong>the</strong> radiationintensity.<strong>The</strong>ory<strong>The</strong> threshold frequency f 0 depends on <strong>the</strong> particular metal and requires a quantumexplanation, which was given by Einstein in 1905. He assumed that <strong>the</strong> incoming radiationshould be thought <strong>of</strong> as quanta <strong>of</strong> energy hf, with f being <strong>the</strong> frequency. One suchquantum can be absorbed by one electron, which <strong>the</strong>n uses <strong>the</strong> energy gained to try toescape from <strong>the</strong> material. If <strong>the</strong> electron is some distance into <strong>the</strong> material, some energywill be lost as it moves towards <strong>the</strong> surface. Additionally, an electrostatic potentialhas to be overcome as <strong>the</strong> electron leaves <strong>the</strong> surface. <strong>The</strong> energy necessary for that isusually called <strong>the</strong> work function, φ. <strong>The</strong> most energetic electrons emitted will be thosevery close to <strong>the</strong> surface, and <strong>the</strong>y will leave <strong>the</strong> cathode with <strong>the</strong> kinetic energyK max = hf − φ . (1.1)1
Experimental Methods I PY2108If <strong>the</strong> metal (<strong>the</strong> cathode) is placed in an evacuated tube and a second electrode (<strong>the</strong>anode) is introduced to collect <strong>the</strong> electrons, a current flows if a suitable potentialdifference is applied between <strong>the</strong> anode an cathode. <strong>The</strong> kinetic energy <strong>of</strong> <strong>the</strong> electronscan <strong>the</strong>n be measured experimentally by making <strong>the</strong> anode voltage V progressively morenegative with respect to <strong>the</strong> cathode until <strong>the</strong> electron current drops to zero. At thispoint <strong>the</strong> field energy, eV max , equals <strong>the</strong> kinetic energyeV max = K max . (1.2)Secondly, when <strong>the</strong> photon energy equals <strong>the</strong> work function <strong>of</strong> <strong>the</strong> metal, hf 0 = φ, noexcess energy is available to be transferred into kinetic energy for <strong>the</strong> electrons, K max = 0,and no electrons are ejected. From eqs. (??) and (??) we obtain( 1eV max =hf − hf 0 = hcλ − 1 )(1.3)λ 0⇒V max = hce( 1λ − 1 λ 0). (1.4)Varying <strong>the</strong> frequency <strong>of</strong> <strong>the</strong> incoming light and plotting 1 against V λ max will <strong>the</strong>reforeyield a straight line with a slope hc which intercepts <strong>the</strong> V e max axis ( 1= 0) atλV max (0) = − hceλ 0= − φ e . (1.5)Measuring <strong>the</strong> slope and <strong>the</strong> intercept, one can <strong>the</strong>refore determine <strong>Planck</strong>’s <strong>constant</strong> hand <strong>the</strong> work function φ <strong>of</strong> <strong>the</strong> metal. [using c = 3 × 10 8 m/s and e = 1.6 × 10 −19 C ]Because <strong>the</strong> work functions <strong>of</strong> pure metals are greater than 4 eV and <strong>the</strong> typical quantumenergy <strong>of</strong> visible light is about 2 eV, ultraviolet radiation is needed to produce photoemissionfrom pure metal cathodes. To produce photoemission with visible radiation weuse a caesium antimony cathode (with low work function) in this experiment.Procedure<strong>The</strong> wavelength <strong>of</strong> <strong>the</strong> incident light is determined by using filters to isolate narrowwavelength ranges from <strong>the</strong> continuous spectrum <strong>of</strong> a tungsten filament <strong>of</strong> a desk lamp.When <strong>the</strong> light hits <strong>the</strong> cathode, a current starts flowing (if <strong>the</strong> anode-cathode voltageis zero) and a potentiometer is used to give <strong>the</strong> anode an increasing negative potentialwith respect to <strong>the</strong> cathode until this current falls to zero (V = V max ).Since <strong>the</strong> current will be small as V max is approached it must be amplified for a sensitivemeasurement. <strong>The</strong> d.c. signal <strong>of</strong> <strong>the</strong> electron current is <strong>the</strong>refore transformed into2
Experimental Methods I PY2108an a.c. signal which is amplified by an a.c. amplifier and monitored by a cathode rayoscilloscope (CRO). <strong>The</strong> transformation to an a.c. signal is achieved by operating <strong>the</strong>tungsten filament lamp from <strong>the</strong> a.c. mains (50Hz). <strong>The</strong> filament is heated and cooledevery half cycle <strong>of</strong> <strong>the</strong> mains so that <strong>the</strong> intensity <strong>of</strong> <strong>the</strong> light varies at twice <strong>the</strong> mainsfrequency (100Hz). <strong>The</strong> photoelectric current, which varies at this frequency, is passedthrough a resistor and <strong>the</strong> a.c. voltage across <strong>the</strong> resistor is amplified by an a.c. amplifierand displayed on <strong>the</strong> CRO. As V max is approached <strong>the</strong> photocurrent and <strong>the</strong> CRO signalgo to zero.<strong>The</strong> voltage V max is measured by a digital voltmeter connected to <strong>the</strong> monitor outputwhenever <strong>the</strong> button switch is pressed. <strong>The</strong> output <strong>of</strong> <strong>the</strong> amplifier, marked ’ OUT’, isdisplayed on <strong>the</strong> CRO. <strong>The</strong> earth terminal on <strong>the</strong> output should be connected to <strong>the</strong>earth terminal on <strong>the</strong> CRO. <strong>The</strong> 40W tungsten filament lamp should be placed about20 cm from <strong>the</strong> photodiode and kept in this position for each filter.Measure V max for each wavelength (each filter) available to you and repeat this measurementsa few times, to be able to do an error analysis <strong>of</strong> your data.As a second experiment, measure V max for a single filter for three different distancesbetween <strong>the</strong> lamp and <strong>the</strong> photodiode and show that V max does not depend on <strong>the</strong> lightintensity.Note: If V is increased beyond V max , a current starts flowing again and a signal reappearson <strong>the</strong> CRO. This occurs because some <strong>of</strong> <strong>the</strong> incident radiation is reflected from<strong>the</strong> cathode and falls on <strong>the</strong> anode. Although <strong>the</strong> anode is made <strong>of</strong> material <strong>of</strong> highwork function, some <strong>of</strong> <strong>the</strong> low work function cathode material is deposited on <strong>the</strong> anodeduring manufacture <strong>of</strong> <strong>the</strong> tube so that light falling on <strong>the</strong> anode produces a currentin <strong>the</strong> opposite direction. This reverse current is always present but is only seen whenV > V max . This is one <strong>of</strong> <strong>the</strong> effects which give rise to <strong>the</strong> low value <strong>of</strong> h obtainedin this experiment. A fur<strong>the</strong>r effect is that, for electrons in <strong>the</strong> cathode with energygreater than φ, <strong>the</strong>re is a finite probability that <strong>the</strong>se may not escape <strong>the</strong> surface butmay instead be reflected. <strong>The</strong> calculated value <strong>of</strong> h may <strong>the</strong>refore be lower than <strong>the</strong>published value by a factor <strong>of</strong> two or more.AnalysisPlot V max against 1 and determine h and φ (in SI units) from it. Calculate error barsλfor your measured data and analyse <strong>the</strong> sources <strong>of</strong> errors in <strong>the</strong> experimental setup.Compare your results for h and φ to literature values.3
Experimental Methods I PY2108No. Colour Pass-band [nm]1λ [m−1 ]600 violet 380-450 2.6 − 2.2 × 10 6602 blue 440-490 2.3 − 2.0 × 10 6603 blue-green 470-520 2.1 − 1.9 × 10 6605 yellow-green 530-570 1.9 − 1.75 × 10 6607 orange 575-610 1.75 − 1.65 × 10 6608 red ≥ 620 ≤ 1.6 × 10 6Filter Details<strong>The</strong> full pass-band transmitted by each filter should be shown on <strong>the</strong> graph (ra<strong>the</strong>r thana single wavelength at <strong>the</strong> centre <strong>of</strong> <strong>the</strong> pass-band).4