optical characterisation of rare-earth doped fluoride and phosphate ...
optical characterisation of rare-earth doped fluoride and phosphate ...
optical characterisation of rare-earth doped fluoride and phosphate ...
- No tags were found...

Create successful ePaper yourself
Turn your PDF publications into a flip-book with our unique Google optimized e-Paper software.
OPTICAL CHARACTERISATION OF RARE-EARTHDOPED FLUORIDE AND PHOSPHATE GLASSMICROSPHERE RESONATORSByDanny O'SheaSUBMITTED IN PARTIAL FULFILLMENT OF THEREQUIREMENTS FOR THE DEGREE OFMASTER OF SCIENCEATNATIONAL UNIVERSITY OF IRELAND,UNIVERSITY COLLEGE CORKIRELANDAUGUST 2007Department Head, Pr<strong>of</strong>. John McInerneySupervisor, Dr. Sle Nic Chormaic
To the O'Shea families <strong>and</strong> Martha.ii
Table <strong>of</strong> ContentsAcknowledgementsList <strong>of</strong> PublicationsAbstractGlossary <strong>of</strong> AcronymsviviiiixxiIntroduction 11 Optical Properties <strong>of</strong> Doped Microcavities 71.1 Introduction . . . . . . . . . . . . . . . . . . . . . . . . . . . . . . . . 71.2 Whispering Gallery Modes . . . . . . . . . . . . . . . . . . . . . . . . 81.3 Electromagnetic Description <strong>of</strong> Modes . . . . . . . . . . . . . . . . . 81.4 Resonance Positions . . . . . . . . . . . . . . . . . . . . . . . . . . . 111.5 Cavity Quality Factor . . . . . . . . . . . . . . . . . . . . . . . . . . 141.6 Mode Volume . . . . . . . . . . . . . . . . . . . . . . . . . . . . . . . 191.7 Spectroscopy <strong>of</strong> Rare Earth Ions . . . . . . . . . . . . . . . . . . . . . 221.8 Selection Rules for Er 3+ . . . . . . . . . . . . . . . . . . . . . . . . . 221.9 Radiative Emission Rates . . . . . . . . . . . . . . . . . . . . . . . . 241.10 Material Loss Mechanisms in Lasers . . . . . . . . . . . . . . . . . . . 262 Fabrication <strong>of</strong> <strong>and</strong> Coupling to Microspheres 282.1 Introduction . . . . . . . . . . . . . . . . . . . . . . . . . . . . . . . . 282.2 Microsphere Fabrication . . . . . . . . . . . . . . . . . . . . . . . . . 292.3 Introduction to Coupling . . . . . . . . . . . . . . . . . . . . . . . . . 312.3.1 Angle-Polished Fibres . . . . . . . . . . . . . . . . . . . . . . 322.3.2 Tapered Fibres . . . . . . . . . . . . . . . . . . . . . . . . . . 332.4 Mode Propagation Constants . . . . . . . . . . . . . . . . . . . . . . 34iii
5 Homemade External Cavity Diode Laser 1115.1 Introduction . . . . . . . . . . . . . . . . . . . . . . . . . . . . . . . . 1115.2 Design <strong>and</strong> Construction . . . . . . . . . . . . . . . . . . . . . . . . . 1125.3 Performance . . . . . . . . . . . . . . . . . . . . . . . . . . . . . . . . 1156 Conclusions 118Appendices 122A Spectral Characterisation <strong>of</strong> Erbium-Doped Microspherical Lasers 122B A Heat-<strong>and</strong>-Pull Rig for Fiber Taper Fabrication 134C Upconversion Channels in Er:ZBLALiP: a Multi-Color MicrosphericalLight Source 140D An All Fibre-Coupled Multicolor Microspherical Light Source 149E Optical Bistability in Er-Yb co-<strong>doped</strong> <strong>phosphate</strong> glass microspheresat room temperature 153F External Cavity Diode Laser Design Files 161Bibliography 171v
AcknowledgementsThe work in this thesis would not be possible without the great eorts <strong>of</strong> Dr. Sle NicChormaic, my supervisor, Jonathan Ward, my work colleague, <strong>and</strong> the other members<strong>of</strong> the Quantum Optics Group - Dr. Brian Shortt, Michael Morrissey, Kieran Deasy,<strong>and</strong> Thejesh B<strong>and</strong>i. I am indebted to their suggestions, encouragement, <strong>and</strong> mostimportantly, their humour. The warm atmosphere in our group over my two years inthe Tyndall National Institute, have made it a ne environment in which to develop<strong>and</strong> realise ideas. The relative freedom to choose our own course <strong>of</strong> research aordedto us by Sle, helped me develop a degree <strong>of</strong> independence. My level <strong>of</strong> scienticeducation as well as personal knowledge <strong>of</strong> my abilities have truly benetted fromthis experience. Despite having a busy schedule running the group, Sle was alwaysavailable, either in person or email, to answer any problems I needed help with.She is also responsible for identifying my next work, which will be for my PhD, inthe Glass Fiber Quantum Optics Group in Mainz, Germany, with Pr<strong>of</strong>. Dr. ArnoRauschenbeutel.There were a number <strong>of</strong> fruitful trips throughout my thesis work. During my timein the Q&NLO summer school in Denmark, I met many very intelligent <strong>and</strong> friendlystudents. Dr. Renzoni <strong>and</strong> his two students in University College London made mefeel very welcome when I visited his laboratory in 2006. The CLEO 2007 conferencein Baltimore, USA, led to friendship with Scott Lewis, who kindly visited Martha,my partner, <strong>and</strong> I in June. We look forward to reciprocating the visit some time inthe near future.Looking back at my rst draft <strong>of</strong> our rst paper, I am a little astounded by thecontrast in my writing style compared to later papers. I will forever be grateful toSle <strong>and</strong> Brian for teaching me the skill <strong>of</strong> technical writing. Martha kindly spent anumber <strong>of</strong> days reading over the manuscript <strong>and</strong> making corrections. Sle also spentmany long hours making corrections <strong>and</strong> improvements to the thesis; too numerousvi
viito be counted. Any remaining errors are, <strong>of</strong> course, my own fault.I wish to express my gratitude to a number <strong>of</strong> people around the various institutionsin Cork. A special thanks must go to Dr. Anthony Grant in the CorkInstitute <strong>of</strong> Technology (CIT) for taking time out to teach me how to use their electronmicroscope. The Department Head <strong>of</strong> my previous department in CIT, Dr. LiamMcDonnell, showed an interest in my progress <strong>and</strong> oered useful advice for which Ithank him. This appreciation is extended to all the technicians <strong>and</strong> sta <strong>of</strong> the department.Halfway through my work, Sle <strong>and</strong> I transferred to the Physics Department inUniversity College Cork (UCC). Here I had the opportunity <strong>of</strong> co-supervising an undergraduatephysics laboratory; it can be more dicult than it seems, but rewardingnonetheless. During my time in UCC, several <strong>of</strong> us, under the guidance <strong>of</strong> Sle, set upthe Cork Chapter <strong>of</strong> the Optical Society <strong>of</strong> America; this also took some eort <strong>and</strong>persistence. The sta <strong>and</strong> students in CIT, UCC <strong>and</strong> the Tyndall National Institute,the place where my work was undertaken, were always a pleasure to talk with, bothduring <strong>and</strong> after work. Of course, I am grateful to my parents for their support <strong>and</strong>for making every eort in ensuring my studies went as smoothly as possible. Ourcollaborators in France, Patrice Feron <strong>and</strong> Michel Mortier, provided us with the bulk<strong>doped</strong> glass <strong>and</strong> absorption measurements, which are studied in this thesis. Last,but not least, I thank Pr<strong>of</strong>. Roger Whatmore, Tyndall CEO, for selecting me for theTyndall bursary in 2007.I am also very happy to acknowledge the nancial help <strong>of</strong> IRCSET through theEmbark Initiative who provided me with a scholarship over 2005-2007.Kenmare, Irel<strong>and</strong>2 August, 2007Danny O'Shea
viiiList <strong>of</strong> Publications[1] J. Ward, D. G. O'Shea, B. J. Short, M. J. Morrissey, K. Deasy <strong>and</strong> S. G. NicChormaic, \Heat-<strong>and</strong>-pull rig for ber taper fabrication," Rev. Sci. Instrum.,77, 083105, (2006).[2] B. J. Shortt, J. Ward, D. O'Shea <strong>and</strong> S. Nic Chormaic, \Spectral <strong>characterisation</strong><strong>of</strong> erbium-<strong>doped</strong> microspherical lasers," Proc. SPIE, 6187, 618708, (2006).[3] J. Ward, D. O'Shea, B. Shortt, <strong>and</strong> S. Nic Chormaic, \Optical Bistability inEr-Yb co-<strong>doped</strong> <strong>phosphate</strong> glass microspheres at room temperature," J. Appl.Phys., 102, 023104, (2007).[4] D. G. O'Shea, J. M. Ward, B. J. Shortt, M. Mortier, P. Feron <strong>and</strong> S. NicChormaic, \Upconversion channels in Er:ZBLALiP: a multi-color microsphericallight source," Eur. Phys. J. Appl. Phys., 40, 181, (2007).[5] D. G. O'Shea, J. M. Ward, B. J. Shortt, <strong>and</strong> S. Nic Chormaic, \An All-Fiber Coupled Multicolor Microspherical Light Source," IEEE Photon. Technol.Lett., 19, 1720 (2007).
ixAbstractThe unique ability <strong>of</strong> microresonators to conne tens <strong>of</strong> Watts <strong>of</strong> power in micron-sizedstructures for long periods <strong>of</strong> time has prompted applications ranging from <strong>optical</strong>processing <strong>of</strong> data to more fundamental studies, such as cavity quantum electrodynamics.Rare-<strong>earth</strong> ions embedded in glasses serve as solid state laser sources forapplications in telecommunications, nuclear fusion, environmental sensors, <strong>and</strong> evenquantum information. This combination <strong>of</strong> active medium <strong>and</strong> resonant cavity hasopened new areas <strong>of</strong> research focusing on the <strong>characterisation</strong> <strong>of</strong> <strong>doped</strong> microspheres.The aim <strong>of</strong> this research was the investigation <strong>of</strong> the emission characteristics <strong>of</strong> asingly-<strong>doped</strong> uorozirconate glass microsphere, made from ZBLALiP, <strong>and</strong> a co-<strong>doped</strong><strong>phosphate</strong> glass microsphere, made from IOG-2.The technique used for microsphere <strong>and</strong> taper fabrication is outlined. A rig forfabricating adiabatic tapered <strong>optical</strong> bres is also described <strong>and</strong> the prole <strong>of</strong> the resultingbres is characterised. Light is coupled from these bres into the microspheres,whereupon it propagates in cavity modes <strong>and</strong> excites the active medium. Bulk samplesnormally operate with excitation densities <strong>of</strong> only a few tens <strong>of</strong> kW/cm 2 . Excitationdensities as high as 200 MW/cm 2 circulate in the <strong>doped</strong> microspheres, therebymaking it possible to investigate interesting new behaviour in the glasses under study.In ZBLALiP we observe a total <strong>of</strong> thirteen discrete uorescence emissions from 320nm to 850 nm <strong>and</strong> a lasing emission at 1.5 m. Results from the literature normallyshow a limited number <strong>of</strong> emissions at green, red <strong>and</strong> - possibly - blue wavelengths.A spectroscopic study <strong>of</strong> the absorption <strong>and</strong> uorescence properties is given, <strong>and</strong> theprocesses responsible for the generation <strong>of</strong> the observed wavelengths are outlined.
xTo the best <strong>of</strong> our knowledge, this thesis presents the rst systematic study <strong>of</strong><strong>optical</strong> bistability in any <strong>doped</strong> microspherical laser glass. In comparison to otherbistable glasses <strong>and</strong> crystals, IOG-2 microspheres have large contrast between the twobistable states <strong>and</strong> require very low switching powers. In addition, their small size<strong>and</strong> room temperature operation, in contrast to other glasses that require cryogeniccooling, make them interesting for miniature devices.Finally, details <strong>of</strong> the construction <strong>and</strong> performance <strong>of</strong> a homemade, bre-coupled,external cavity diode laser are given.
xiGlossary <strong>of</strong> AcronymsCWECDLEDFAESAETUFSRGSAJOLLOBOSAPASEMSMFTIRContinuous WaveExternal Cavity Diode LaserErbium Doped Fibre AmplierExcited State AbsorptionEnergy Transfer UpconversionFree Spectral RangeGround State AbsorptionJudd-OfeltLight in - light outOptical BistabilityOptical Spectrum AnalyserPhoton AvalancheScanning Electron MicroscopeSingle Mode FibreTotal Internal Reection
xiiWDMWGMZBNAZBLALiPZBLANWavelength Division MultiplexerWhispering Gallery ModeZrF4-BaF2-NaF-AlF3ZrF4-BaF2-LaF3-AlF3-LiF-PbF2ZrF4-BaF2-LaF3-AlF3-NaF
xiiiList <strong>of</strong> Figures1.1 WGM in a microsphere. (a) Ray propagation around the sphere byTIR; (b) Spherical coordinate system. . . . . . . . . . . . . . . . . . . 91.2 Calculated intensity distribution <strong>of</strong> the TM mode in the equatorialplane (a) for n = 1 <strong>and</strong> l = 30 with x = 24.623 (b) <strong>and</strong> for n = 2 <strong>and</strong>l = 30 with x = 27.978. The wavelength is 1.55 m, <strong>and</strong> the sphereradius <strong>and</strong> intensity are normalised to unity in both cases. . . . . . . 121.3 Azimuthal intensity distribution for TM modes with (a) n = 1; l jmj =1, (b) n = 2; l jmj = 1, (c) n = 1; l jmj = 2, (d) n = 2; l jmj = 1.The wavelength is 980 m, <strong>and</strong> the sphere radius is normalised to unity. 131.4 Total quality factor <strong>and</strong> individual quality factors as a function <strong>of</strong>sphere diameter at a wavelength <strong>of</strong> 980 nm. Water absorption limitsthe Q in silica. In (b), the statistical correlation length, B, <strong>and</strong> theaverage st<strong>and</strong>ard deviation <strong>of</strong> the surface roughness, , are increased bya factor <strong>of</strong> about three to simulate the estimated poorer surface qualityin our <strong>doped</strong> microspheres (B = 7 nm <strong>and</strong> = 15 nm). Coupling losseswith a tapered bre have been neglected. . . . . . . . . . . . . . . . . 181.5 Mode volume for a <strong>doped</strong> microsphere with n s = 1:5 for = 1550nm (squares) <strong>and</strong> 980 nm (diamonds). The TE modes have a slightlysmaller mode volume. In contrast, the nonlinear mode volume (greenmarkers) is at variance with the quantum mode volumes (red <strong>and</strong> bluemarkers). . . . . . . . . . . . . . . . . . . . . . . . . . . . . . . . . . 21
xiv1.6 Fundamental light-matter interactions in a two level system. The notationJ <strong>and</strong> J 0 designate the upper <strong>and</strong> lower energy levels respectively. 251.7 Population <strong>of</strong> each <strong>of</strong> the Stark levels for the 1.5 m lasing transition( 4 I 13=2 ! 4 I 15=2 ) in Er 3+ . . . . . . . . . . . . . . . . . . . . . . . . . . 252.1 Microsphere fabrication with a microwave plasma chamber. A bulksample is rst ground into a powder <strong>and</strong> then injected through a quartztube to a ame, where microspheres form under surface tension. Themicrosphere can later be mounted on the end <strong>of</strong> an <strong>optical</strong> bre formanipulation (see bottom right image). . . . . . . . . . . . . . . . . . 302.2 Scanning Electron Microscope image <strong>of</strong> a silica microsphere fabricatedby melting the end <strong>of</strong> a tapered <strong>optical</strong> bre. The electrons penetrateinto the microsphere, revealing the bre core in the centre <strong>and</strong> claddingin the outer region, where the WGM should propagate. . . . . . . . . 312.3 Schematic <strong>of</strong> (a) tapered bre-microsphere <strong>and</strong> (b) angle-polished bremicrospherecoupling schemes. . . . . . . . . . . . . . . . . . . . . . . 322.4 Calculated polish angle as a function <strong>of</strong> sphere radius for a wavelength<strong>of</strong> 980 nm for the fundamental n = 1 mode, <strong>and</strong> the n = 2 mode. . . 342.5 (a) Propagation constant for the fundamental HE 11 mode at 980 nm,<strong>and</strong> (b) phase matching condition at 980 nm in a silica microsphere. . 372.6 Poynting vector for a 0.5 m radius bre taper for light with a wavelength<strong>of</strong> 1.5 m. The boundary <strong>of</strong> the bre wall shows a discontinuityin the vector eld causing a large power density. The evanescent eldis quasi linearly polarised. . . . . . . . . . . . . . . . . . . . . . . . . 382.7 Schematic <strong>of</strong> the taper fabrication rig. Dashed lines indicate controllines or data transfer. . . . . . . . . . . . . . . . . . . . . . . . . . . . 422.8 Taper prole for a 3 m diameter taper. The pull length is 40 mm, thescan length is 7 mm, <strong>and</strong> the initial taper diameter is 125 m. Theinset shows an SEM image <strong>of</strong> a section <strong>of</strong> the taper with a diameter <strong>of</strong>5.9 m. The inset bar in the lower right is 1.0 m. . . . . . . . . . . 44
xv2.9 Approximated length-scale delineation curves for three taper fabricationtechniques - direct CO 2 heating, indirect micro-furnace heating,<strong>and</strong> a 2-step process employing both techniques. The green trace representsthe delineation between guidance <strong>and</strong> non-guidance <strong>of</strong> light. . 452.10 Optical micrograph <strong>of</strong> a bottle resonator with a diameter <strong>of</strong> 12 m <strong>and</strong>a length <strong>of</strong> 300 m. The bar is 10 m. . . . . . . . . . . . . . . . . . 483.1 The theoretical absorption loss <strong>of</strong> ZBLAN is compared to that <strong>of</strong> experimentallyrealised bres from the visible to the near infra-red [23].The attenuation in silica is higher by a factor <strong>of</strong> about 10 or more. . . 533.2 Absorption spectra for 0.2 mol% Er 3+ <strong>doped</strong> ZBLALiP bulk glass at<strong>optical</strong> <strong>and</strong> IR wavelengths. . . . . . . . . . . . . . . . . . . . . . . . 553.3 Er 3+ energy level diagram with radiative (solid lines) <strong>and</strong> non-radiativetransitions for a 976 nm pump. The thick, black line at 1540 nmindicates the C-b<strong>and</strong> lasing transition. . . . . . . . . . . . . . . . . . 563.4 Theoretical refractive index variation as a function <strong>of</strong> wavelength inZBLALiP. . . . . . . . . . . . . . . . . . . . . . . . . . . . . . . . . . 573.5 The experimental setup schematically represents how the microsphereis excited with a 980 nm diode laser (DL) <strong>and</strong> the emissions are collected.The uorescence is collected on a CCD spectrometer, <strong>and</strong> thelasing emission is collected in an <strong>optical</strong> spectrum analyser (OSA). Legend:OI - <strong>optical</strong> isolator, VA - variable attenuator, WDM - wavelengthdivision multiplexer. . . . . . . . . . . . . . . . . . . . . . . . . . . . 593.6 66 m diameter microsphere lasing spectrum about 1.5 m showingwhispering gallery mode structure. Inset: microsphere <strong>and</strong> bre taperwith a green WGM. The FSR is 7.8 nm. . . . . . . . . . . . . . . . . 603.7 Absorption <strong>and</strong> emission cross-sections for 0.2 mol% Er 3+ <strong>doped</strong> bulkZBLALiP. . . . . . . . . . . . . . . . . . . . . . . . . . . . . . . . . . 62
xvi3.8 Gain coecient for dierent population inversions between the metastable4I 13=2 <strong>and</strong> the ground level 4 I 15=2 . The percentages correspond to differentamounts <strong>of</strong> population inversion. . . . . . . . . . . . . . . . . . 633.9 Observed Er 3+ :ZBLALiP microsphere upconversion spectrum for 976nm pumping. Inset: whispering gallery mode structure about T13 witha FSR <strong>of</strong> 2.3 nm. . . . . . . . . . . . . . P . . . . . . . . . . . . . . . . 703.10 Calculated fraction <strong>of</strong> radiative decay, A= A, for the observed emissions.The parameters C <strong>and</strong> are 1:99 ¢ 10 5 s 1 <strong>and</strong> 2:11 ¢ 10 3cm respectively, taken for ZBLAN at 300 K [38]. The fraction for4I 13=2 ! 4 I 15=2 at 1.5 m is 0.93 (not shown). . . . . . . . . . . . . . . 743.11 Light in-Light out logarithmic graph for the uorescence emissions. Allemissions show a slope <strong>of</strong> approximately 1. Note the lines are an aidfor the eye. . . . . . . . . . . . . . . . . . . . . . . . . . . . . . . . . 763.12 Experimental setup to perform Q factor measurement. Legend - PBS:polarising beam splitter, QWP: quarter wave plate, PD: photodiode.The black dotted line indicates electronic data/control signals. . . . . 793.13 Quality factor measurement. The upper trace represents the transmissionpast the taper-sphere coupling junction. The lower trace is theRb saturation absorption measurement used to calibrate the x-axis interms <strong>of</strong> frequency. . . . . . . . . . . . . . . . . . . . . . . . . . . . . 804.1 Energy level diagram <strong>and</strong> uorescence mechanisms with radiative (solidlines) <strong>and</strong> non-radiative transitions (wiggly lines). . . . . . . . . . . . 85
xvii4.2 Upconversion uorescence spectrum for two dierent IOG-2 microspheres.Strong red uorescence is dependent on whether lasing is present in themicrosphere. The gure in (a) shows that a larger proportion <strong>of</strong> thepopulation is involved in the C-b<strong>and</strong> lasing compared to (b), whereupconversion is strong <strong>and</strong> lasing is absent. An additional weak violetemission from a 35 m diameter microsphere is shown, for a pumppower <strong>of</strong> 8 mW. The violet emission has been scaled up by a factor <strong>of</strong>ve for clarity. . . . . . . . . . . . . . . . . . . . . . . . . . . . . . . . 874.3 Absorption <strong>and</strong> emission cross-sections for Er 3+ :Yb 3+ co-<strong>doped</strong> IOG-2bulk glass. . . . . . . . . . . . . . . . . . . . . . . . . . . . . . . . . . 914.4 Lasing spectrum for a 50 m diameter IOG-2 microsphere for 10 mWpump power. The inset shows whispering gallery mode structure for adierent 50 m diameter microsphere. . . . . . . . . . . . . . . . . . 924.5 Intensity bistability for the C-b<strong>and</strong> in a 50 m diameter sphere. . . . 934.6 Intensity bistability for the two green states 2 H 11=2 <strong>and</strong> 4 S 3=2 , <strong>and</strong> thered 4 F 9=2 state, for a 60 m diameter, non-lasing sphere. The launchedpump power is varied from 0 to about 10 mW. The switching positionsfor the green <strong>and</strong> red emissions in this gure dier from the 1.5 mlasing emission in Fig. 4.5 due to spheres <strong>of</strong> dierent sizes being used.The corresponding spectra for the visible uorescence are shown in Fig.4.2(a). . . . . . . . . . . . . . . . . . . . . . . . . . . . . . . . . . . . 944.7 Chromatic switching for the green uorescence emissions at 2 H 11=2 (520nm) <strong>and</strong> 4 S 3=2 (550 nm). The inversion ratio is proportional to thetemperature <strong>of</strong> the mode volume. The jump in intensity ratio from 1.1to 2.3 indicates a temperature increase <strong>of</strong> 178 K. The correspondingspectra for the visible uorescence are shown in Fig. 4.2(a). . . . . . 964.8 Wavelength switching in the C-b<strong>and</strong> lasing at 1.5 m. The gurecorresponds with the intensity bistability measurements in Fig. 4.5.The switching positions are the same for both. . . . . . . . . . . . . . 98
xviii4.9 Fluorescence slopes <strong>and</strong> spectrum for the two green levels <strong>and</strong> thered level for a 30 m diameter nonlasing sphere. The slopes in (a)follow a power law dependence <strong>and</strong> indicate two pump photons producea photon at either <strong>of</strong> the three wavelengths. The spectrum in (b)corresponds to the last data point in (a). . . . . . . . . . . . . . . . . 1004.10 Schematic <strong>of</strong> the heat conduction from the mode volume to the rest <strong>of</strong>the microsphere <strong>and</strong> the tapered bre (not shown). The microspheredissipates its heat primarily through the supporting stem/post. . . . . 1054.11 Graphical description <strong>of</strong> dispersive <strong>optical</strong> bistability due to thermalnonlinearities in a cavity. The green circles mark out correspondingpoints on each <strong>of</strong> the three plots. Figure (a) shows the Lorentzian <strong>of</strong>the 980 nm pump, Fig. (b) shows the cavity coecient, i.e. the regionover which the cavity resonance scans over the pump Lorentzian, as afunction <strong>of</strong> input power, <strong>and</strong> Fig. (c) shows the internal cavity eld asa function <strong>of</strong> input power. . . . . . . . . . . . . . . . . . . . . . . . . 1065.1 Schematic <strong>of</strong> the external cavity diode laser <strong>and</strong> the supporting hardware.The angle in the zoomed imaged is dened as the angle betweenthe normal to the grating <strong>and</strong> the <strong>optical</strong> axis <strong>of</strong> the beam from thelaser diode. DSO: Digital storage oscilloscope, PZT: piezo-electric element,SMF28: single mode bre, angular displacements, ¡, are donewith the upper adjustment screw in the main gure. . . . . . . . . . . 1135.2 (a) Fibre coupled lasing peak as measured on the OSA, <strong>and</strong> (b) thresholdcurrents. The threshold currents were recorded at dierent stages<strong>of</strong> the collimation tube alignment. . . . . . . . . . . . . . . . . . . . . 1145.3 Mode hopping with both (a) laser diode current tuning <strong>and</strong> (b) PZTscanning. The wavelength in (a) is 990 nm <strong>and</strong> the laser diode temperatureis 23 C. The solid green line in (b) represents increasing voltageacross the piezo stack <strong>and</strong> the dashed blue line represents decreasingvoltage. . . . . . . . . . . . . . . . . . . . . . . . . . . . . . . . . . . 117
F.1 Electrical wiring diagram for the ECDL <strong>and</strong> laser diode controller. . . 170xix
xxList <strong>of</strong> Tables1.1 Rigorous selection rules for electric dipole transitions. . . . . . . . . . 233.1 Comparison <strong>of</strong> Judd-Ofelt parameters for uoride <strong>and</strong> other glasses<strong>doped</strong> with Er 3+ . . . . . . . . . . . . . . . . . . . . . . . . . . . . . . 64
1IntroductionOptical glasses are a huge driving force behind technological progress in our society.One <strong>of</strong> mankind's most challenging programmes to control nuclear fusion, through aprocess known as inertial connement fusion, relies on neodymium <strong>doped</strong> glass lasersto heat <strong>and</strong> compress deuterium/tritium fuel pellets. Such lasers use either silicate or<strong>phosphate</strong> glasses to deliver TeraWatts <strong>of</strong> power. In the other extreme, clinical dentistryhas found more prosaic applications for erbium <strong>doped</strong> YAG lasers in the preparation<strong>of</strong> tooth enamel, delivering sub-mW powers [1]. One <strong>of</strong> the great successes <strong>of</strong>solid-state <strong>and</strong> semiconductor technology has been the development <strong>of</strong> miniature, i.e.micron-sized, light structures for use in integrated circuits <strong>and</strong> telecommunications.Such light structures have reached a high degree <strong>of</strong> sophistication, e.g. operating atGHz <strong>and</strong> oering ultra-narrow linewidths - with many relying on nonlinear processes- <strong>and</strong> come in numerous designs, e.g. microcavities [2], VCSELs (Vertical CavitySurface Emitting Lasers), <strong>and</strong> photonic crystal bres [3].Microcavities have a particularly unique combination <strong>of</strong> properties which havebeen the subject <strong>of</strong> intensive research <strong>and</strong> rapid developments in the last decade.Braginsky <strong>and</strong> Ilchenko [4] realised at an early stage that the strong temporal (upto 10 6 s) <strong>and</strong> spatial connement (10 11 cm 3 ) <strong>of</strong> the cavity mode, <strong>and</strong> the small
2device size (typically < 200 m diameter), could meet the technical needs <strong>of</strong> all<strong>optical</strong>computers. Earlier work by Garret et al. [5] in the 60's had shown stimulatedemission from CaF 2 <strong>doped</strong> Sm 2+ millimetre sized spheres when pumped with a xenonashtube. Subsequent work began to exploit the combined advantages <strong>of</strong> using a highquality microcavity <strong>and</strong> dierent <strong>rare</strong> <strong>earth</strong> dopants in a wide variety <strong>of</strong> glasses.1987 was a fortuitous year for these whispering gallery mode (WGM) resonators.Braginsky <strong>and</strong> Ilchenko [4] provided the rst demonstration <strong>of</strong> an ultra-high quality(Q) factor (> 10 7 ) in a passive, micron-sized silica resonator, <strong>and</strong> Baer [6] demonstratedthe rst laser action in a solid-state resonator by using Nd:YAG spheres witha diameter <strong>of</strong> 5 mm <strong>and</strong> a lasing threshold <strong>of</strong> 100 mW. 1 Today, some twenty yearslater, the Q factor <strong>of</strong> silica resonators has risen from 10 6 up to 10 10 . The Q factordetermines the ability <strong>of</strong> a cavity to build up very high circulating elds. In fact,Savchenkov <strong>and</strong> co-workers have recently described [7] how they achieved exceptionalQ factors (> 10 11 ) in a CaF 2 crystal microtoroid, using an annealing <strong>and</strong> polishingtechnique. This is far in excess <strong>of</strong> so-called super Fabry-Perot cavities which can haveQ factors <strong>of</strong> up to 1.9¢10 6 [2] at <strong>optical</strong> wavelengths. 2Current day resonators area factor <strong>of</strong> ten smaller in both diameter (50 m) <strong>and</strong> threshold power (6100 W)<strong>and</strong>, hence, we term these resonators "microcavities". More specically, in the case<strong>of</strong> the work presented in this thesis, microspheres are the resonator <strong>of</strong> choice.The strong connement <strong>of</strong> the cavity mode ensures immense enhancements <strong>of</strong> thelight eld - an important requirement for the observation <strong>of</strong> nonlinear processes. For1In a general sense, the quality factor is dened as the energy stored in the cavity at a particularwavelength divided by the loss rate at this wavelength.2A record high nesse <strong>of</strong> 4:6¢10 9 was demonstrated in a Fabry-Prot cavity but operated in themicrowave region, while the work in this thesis focusses on <strong>optical</strong> wavelengths. Due to its operationat this wavelength, the quality factor (4:2 ¢ 10 10 ) is still less than Ilchenko's microtoroid.
3example, in the case <strong>of</strong> a typical <strong>doped</strong> microsphere with a Q factor <strong>of</strong> 10 6 , for 1 mWlight coupled in, the cavity mode power can be amplied by a factor <strong>of</strong> 10 4 to 10W. In passive cavities, with much higher Q factors, the mode can reach up to kW's<strong>of</strong> power. Early work on nonlinear processes in liquid microdroplets by Lin et. al[8] demonstrated stimulated Raman scattering. Stimulated Brilluoin scattering wasshown by Zhang <strong>and</strong> Chang [9].Others had also shown very low threshold powersfor dispersive bistability in microspheres, which had the eect <strong>of</strong> overwhelmingany observable Kerr nonlinearity at room temperature. Later, Treussart et al. [10]produced measurements for Kerr nonlinearity in a silica microsphere at 2 K. Followingthe development <strong>of</strong> ultra-high Q resonators, along with bre taper couplingtechniques, several studies realised low threshold, high eciency stimulated Ramanemission [11], parametric oscillations [12], <strong>and</strong> cascaded Raman lasing [13] in silicamicrospheres <strong>and</strong> microtoroids, as well as a measurement <strong>of</strong> the Kerr nonlinearity atroom temperature [14].Optical bistability (OB) in a sodium vapour was rst reported by Gibbs in 1976[15] <strong>and</strong>, since then, numerous other materials exhibiting the phenomenon have beenstudied, including Yb 3+ <strong>doped</strong> glasses <strong>and</strong> crystals, <strong>and</strong> semiconductors [16]-[22]. Adevice with this attribute must have a nonlinear process <strong>and</strong> a feedback mechanismthat causes the output signal to operate in either <strong>of</strong> two stable output states thatare dependent on the history <strong>of</strong> the input signal. The mechanisms responsible fornonlinearity in <strong>doped</strong> glasses <strong>and</strong> crystals are varied, with many requiring cryogenictemperatures (typically < 40 K) to maintain the necessary low atomic decay ratesin Yb 3+dimer <strong>and</strong> monomer systems [17]. Alternative <strong>and</strong> more easily achievablemechanisms include photon avalanche <strong>and</strong> thermal avalanche [16, 19], suggesting that
4a wider range <strong>of</strong> materials can exhibit OB at room temperature <strong>and</strong> above. However,no evidence <strong>of</strong> OB through these mechanisms in this temperature range has yetbeen observed. Bistable sensitised luminescence in Er 3+ :Yb 3+ :CsCdBr 3 was shown byRedmond <strong>and</strong> R<strong>and</strong> [17], <strong>and</strong>, subsequently, by Rodenas et al. [18] in a Nd 3+ :Yb 3+co-<strong>doped</strong> crystal. They also described chromatic or wavelength switching in additionto the more traditional intensity switching, though both mechanisms required temperatureswell below room temperature. To date, OB has also been predicted <strong>and</strong>observed in Yb 3+ <strong>doped</strong> oxide crystals, Cr-<strong>doped</strong> LiSrGaF 6 <strong>and</strong> LiSrAlF 6 crystals[19], Sm 3+ <strong>doped</strong> glass microspheres [20], <strong>and</strong> Tm 3+ :Yb 3+ co-<strong>doped</strong> glass [21]. Thelatter system exhibited multiple hysteresis loops in the uorescence intensity at roomtemperature. The experimental realisation <strong>of</strong> a <strong>doped</strong> glass/crystal microsphere exhibitingbistability has been limited to a single paper on the eect in a Sm 3+ <strong>doped</strong>glass [20].This work is focused on the development <strong>and</strong> analysis <strong>of</strong> bistable uorescent <strong>and</strong>lasing emissions from Er 3+ :Yb 3+ -<strong>doped</strong> <strong>phosphate</strong> glass microspheres.Dispersivebistability is <strong>of</strong>ten seen as a hindrance for many applications involving passive cavities,such as ltering, as it causes microcavity line broadening <strong>and</strong> bistable wavelengthresponse [11]. These eects are generally well understood. It is, however, not knownhow bistable microspheres behave when <strong>doped</strong>. This aspect <strong>of</strong> <strong>doped</strong> microspheresis shown to have benecial qualities for applications such as <strong>optical</strong> switching <strong>and</strong>temperature sensing devices. In particular, cavity temperatures as high as 742 K,just below the glass transition temperature, can arise without any structural damage.Heavy metal uoride glasses, such as the commonly used ZBLAN glass, weredeveloped by the Poulain brothers in 1974 as an ultra-low-loss material transmitting
5from the UV ( 250 nm) to the mid-IR (8 m) with 0.001 dB/km loss at 2.6 m.The name ZBLAN arises from its constituent elements: ZrF 4 BaF 2 LaF 3 AlF 3 NaF.When dealing with wavelengths in the mid <strong>and</strong> near IR, applications such as dentistry,remote IR spectroscopy, <strong>and</strong> industrial quality control can benet from this large,high-transmission window. In contrast, silica bres can only transmit from the UV( 250 nm) to the near IR ( 2 m). Unfortunately, ZBLAN glass has suered fromdiculties in glass bre manufacturing due to crystallisation (see [23] for an overview<strong>of</strong> uorozirconate glasses). An alternative material, ZBLALiP, was mooted as possiblyhaving better shaping properties for fabricating bres <strong>and</strong> microspheres [24]. In thiswork, we build on this argument <strong>and</strong> show additional benets <strong>of</strong> ZBLALiP in terms<strong>of</strong> very ecient upconversion uorescence emissions in the 320-850 nm range. Wehave performed a comprehensive Judd-Ofelt analysis in order to underst<strong>and</strong> the glassbehaviour when <strong>doped</strong> with erbium.The layout <strong>of</strong> this thesis is as follows:A general introduction to the <strong>optical</strong> properties <strong>of</strong> microspheres is presented inChapter 1. This provides a groundwork for the rest <strong>of</strong> the thesis. Parameters suchas resonance positions, quality factor limitations, mode volume, <strong>and</strong> electric eldproles are summarised. The fabrication <strong>of</strong> the <strong>doped</strong> microspheres used in this workis also discussed. There is a brief introduction to the topic <strong>of</strong> <strong>optical</strong> spectroscopy<strong>of</strong> laser glasses, which is later used in Chapters 3 <strong>and</strong> 4. Several topics are covered:the dierence between glasses <strong>and</strong> crystals, selection rules for radiative transitions,Einstein A <strong>and</strong> B coecients, excitation mechanisms in ions with multi-phonon decay,<strong>and</strong> nally thermal issues.The two dierent microsphere-coupling schemes that we considered are discussed
6in Chapter 2: angle-polished bres <strong>and</strong> tapered bres. The latter scheme was chosenas the most appealing on the basis <strong>of</strong> its reported ability to provide the most ecientexcitation <strong>of</strong> resonant modes in microspheres [25]. The spatial extent <strong>of</strong> the evanescenteld in the bre is outlined, after which bre taper fabrication with a CO 2 laser <strong>and</strong>the <strong>characterisation</strong> <strong>of</strong> such bres is discussed.In Chapter 3 the methods outlined in Chapter 1 are used to analyse the uorescenceemissions <strong>and</strong> absorption data from Er 3+ :ZBLALiP. The glass is shown to havehigh upconversion rates yielding strong upconversion uorescence.Experimental results <strong>of</strong> <strong>optical</strong> bistability in Er 3+ :Yb 3+ <strong>phosphate</strong> glass microspheresare given in Chapter 4. The results are explained in terms <strong>of</strong> dispersive bistability.Thermal issues related to <strong>phosphate</strong> glass are shown to give rise to nonlinear behaviourin the intensity <strong>and</strong> wavelength output. Full conrmation <strong>of</strong> the dispersivebistability eect requires using a narrow linewidth 980 nm laser to probe the individualcavity resonances. For this purpose, an external cavity diode laser has been built,the details <strong>of</strong> which are given in Chapter 5.Finally, the main achievements <strong>of</strong> the research work are summarised in Chapter6. Thermally induced bistability can potentially display add-drop ltering capability.ZBLALiP microspheres may serve as laser sources at visible wavelengths, 1.5 m, <strong>and</strong>possibly at 2.6 m, if ultra low-loss uorozirconate glass technology can be furtherexploited.
7Chapter 1Optical Properties <strong>of</strong> DopedMicrocavities1.1 IntroductionSome insight into electromagnetic resonances in a microsphere is presented in thisChapter. In this chapter I provide some insight into electromagnetic resonances existingin a microsphere. Ecient coupling to a microsphere requires that the propagationmodes <strong>of</strong> light in the coupling element match the WGMs within the sphere.Several factors can aect the quality factor including material losses <strong>and</strong> couplinglosses. The total unloaded quality factor, i.e. without any coupling device, <strong>and</strong> themodal connement are calculated under realistic experimental conditions. Finally,the concepts <strong>and</strong> dierent types <strong>of</strong> analyses <strong>of</strong> laser glass spectroscopy that will beused later in the work are introduced. I conclude the chapter by introducing concepts<strong>and</strong> dierent types <strong>of</strong> analyses in laser glass spectroscopy that will be used later inthe thesis.
81.2 Whispering Gallery ModesWhispering gallery modes can occur in a symmetrical structure when a wave undergoestotal internal reection (TIR). In the geometrical-optic model, if a ray strikesthe glass-air interface <strong>of</strong> a spherical cavity such that the angle <strong>of</strong> incidence is greaterthan the critical angle, TIR will occur (c.f. Fig. 1.1(a)). The ray is reected <strong>and</strong>, dueto the symmetry <strong>of</strong> the cavity, strikes the glass-air interface again at the same angle.In the case <strong>of</strong> large microspheres, i.e. radius wavelength <strong>of</strong> trapped light (a ), the light ray will be trapped by this mechanism <strong>and</strong> can propagate continuouslyaround the inside wall giving rise to a st<strong>and</strong>ing wave, hence the concept <strong>of</strong> resonantmodes. The integer number <strong>of</strong> these wavelengths around a single revolution can bedenoted by the equatorial mode number, l.The momentum, p, <strong>of</strong> a photon is p = ~k = 2~=, where ~ is Planck's constantdivided by 2, <strong>and</strong> k is the wavenumber inside the sphere. The angular momentum,~l, <strong>of</strong> the photon when it strikes the surface with near glancing incidence is ~l =2an s ~=, where n s is the refractive index <strong>of</strong> the sphere. The integer l is the angularmomentum <strong>of</strong> the photon <strong>of</strong> unit ~ <strong>and</strong> is pointing into the page with reference toFig. 1.1(a). An important variable describing the resonance condition is the sizeparameter, x nl = 2a=. Figure 1.1(b) shows the spherical coordinate system whichis used to model the WGMs in the next section.1.3 Electromagnetic Description <strong>of</strong> ModesA mathematically realistic description <strong>of</strong> the electromagnetic eld patterns in a microspherebegins with the solution <strong>of</strong> the Helmholtz equation in spherical coordinates
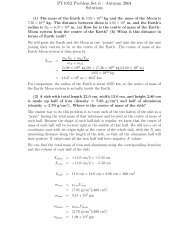
9Figure 1.1: WGM in a microsphere. (a) Ray propagation around the sphere by TIR; (b)Spherical coordinate system.(see [26] for example). The solution is obtainable from the scalar wave equationr 2 ©(r) + n 2 sk 2 ©(r) = 0; (1.1)by assuming a constant polarisation. There are four solutions to Eqn. 1.1 correspondingto the transverse electric (TE) <strong>and</strong> transverse magnetic (TM) components <strong>of</strong> thesphere's electric <strong>and</strong> magnetic elds. Spherical Bessel (Hankel) functions describe theradial elds inside (outside) the sphere, <strong>and</strong> these are given by! ET E (r; ; ) =(jl (n s kr) ! X lm (; ) r a! BT E (r; ; ) =j l (n s kr)h (1)l(kr)=h (1)l(ka) ! X lm (; ) r > a1k r ¢ ! E (r; ; )! BT M (r; ; ) =(jl (n s kr) ! X lm (; ) r a! ET M (r; ; ) =j l (n s kr)h 1 (l) (kr)=h(1)(ka)!X(l) lm (; )1"( ! r )k r ¢ ! B (r; ; );r > a(1.2)
10where j l (h (1)l) are spherical Bessel functions (Hankel functions <strong>of</strong> the rst kind) <strong>of</strong>order l <strong>and</strong> ! X lm = [l(l +1)]1=2 ! L Y lm <strong>and</strong> Y lm are vector spherical harmonic functionswith ! L = ! r ¢( ir). These functions (X lm <strong>and</strong> Y lm ) describe the sinusoidal nature<strong>of</strong> the eld corresponding to reections <strong>of</strong> the ray o the sphere surface.The three mode numbers, n, l, <strong>and</strong> m, are used to characterise the radial, theequatorial, <strong>and</strong> the polar components <strong>of</strong> the electromagnetic eld.Mode numbern (n = 1; 2; 3; : : :) gives the number <strong>of</strong> maxima in the radial electromagnetic elddistribution. The fundamental (n = 1) TM radial mode is depicted in Fig. 1.2(a)<strong>and</strong> two radial modes are depicted in Fig. 1.2(b). The second mode number, m(m = l; l + 1; : : : ; 0; : : : ; l 1; l), describes the number <strong>of</strong> maxima in the sinusoidalvariation in eld intensity in the equatorial or latitudinal direction.Finally, themode number l describes the eld intensity distribution in the polar or longitudinaldirection, <strong>and</strong> can take values l = 0; 1; 2; : : : with the number <strong>of</strong> maxima present inthe polar eld distribution given by l jmj + 1.For a perfect sphere (zero ellipticity), modes with the same l but dierent m valueshave a 2l + 1 degeneracy, <strong>and</strong>, therefore, the mode numbers n <strong>and</strong> l are sucient todescribe the WGM. In reality, some ellipticity exists in the sphere <strong>and</strong> this removesthe degeneracy. For minimal mode volumes one wants n to be small <strong>and</strong> m l,as shown in Fig. 1.3. The spheres used in the present studies have a diameter inthe range 50 - 200 m with < 5% ellipticity.Figure 1.3 shows a cross-section <strong>of</strong>the eld for dierent values <strong>of</strong> m <strong>and</strong> l. We see that the mode volume is lowest forthe fundamental mode <strong>and</strong> increases for more complicated mode structures. In theray optics picture, the fundamental mode represents a ray with the smallest reectionangle, the lowest diraction losses, the lowest mode volume, <strong>and</strong> the highest Q factor.
11The fundamental mode in Fig. 1.3(a) is located on the equatorial plane <strong>of</strong> thesphere. Although modes with l jmj > 0 travel with greater inclinations with respectto the equator, they still have the same resonant wavelength as the fundamental mode,since the curvature <strong>of</strong> the sphere precisely compensates the greater incline. The pathlength for ljmj > 0 modes in Fig. 1.3(a) to Fig. 1.3(d) are all equal, i.e. theyare degenerate.Therefore, the equatorial mode number, m, is superuous whendescribing the resonance wavelength.1.4 Resonance PositionsThe continuity <strong>of</strong> the tangential components <strong>of</strong> the electric <strong>and</strong> magnetic elds at thesphere surface (see Eqn. 1.2) must satisfy a characteristic equation,ns2b [n s kaj l (n s ka)] 0j l (n s ka)=hn s kah (1)l(ka)h (1)l(ka)i 0; (1.3)where b is the polarisation (equal to 1 for TM modes <strong>and</strong> 0 for TE modes). Theprime denotes dierentiation with respect to the argument. The position <strong>and</strong> width<strong>of</strong> the resonances are obtained by numerically solving this characteristic equation.The solution yields discrete values <strong>of</strong> frequency at which resonances are possible. Inpractice, the locations <strong>of</strong> these resonances are found by scanning a tuneable diodelaser over the free spectral range <strong>of</strong> the sphere.The solution to Eqn. 1.3 requires a signicant amount <strong>of</strong> computational time asthe resonances have sharp Lorentzian line-shapes. Schiller [27] has used an asymptoticformula to yield an approximation for the resonance frequency in terms <strong>of</strong> the size
12(a)(b)Figure 1.2: Calculated intensity distribution <strong>of</strong> the TM mode in the equatorial plane (a)for n = 1 <strong>and</strong> l = 30 with x = 24.623 (b) <strong>and</strong> for n = 2 <strong>and</strong> l = 30 with x = 27.978. Thewavelength is 1.55 m, <strong>and</strong> the sphere radius <strong>and</strong> intensity are normalised to unity in bothcases.
13(a)(b)(c)(d)Figure 1.3: Azimuthal intensity distribution for TM modes with (a) n = 1; l jmj = 1, (b)n = 2; l jmj = 1, (c) n = 1; l jmj = 2, (d) n = 2; l jmj = 1. The wavelength is 980 m,<strong>and</strong> the sphere radius is normalised to unity.
14parameter, x nl , up to order = 8 such thatx nl = t 1=3+m m 28X=0d (m; t ); (1.4) =3 (m 2 1)=2where = l + 1=2, m = n s =n a , n a is the refractive index <strong>of</strong> the surrounding medium,<strong>and</strong> t is the t th zero <strong>of</strong> the Airy function, . The coecients <strong>of</strong> the expansion aregiven by the polarisation dependent term d (m; t ).Identication <strong>of</strong> these resonances is achieved by measuring the separations <strong>of</strong> theresonance frequencies x nl x nl 1 . The widths <strong>of</strong> the resonances, (n)l, are given atFWHM as [28]:where n l is the spherical Neumann function, <strong>and</strong>nl = 2 ¢ Nx 2 n l (x) 2£ 1 ; (1.5)N =(n2s 1; for TE modes(n 2 s 1)[ 2 + ( 2 =n 2 s 1)]; for TM modes;(1.6)where = =x with x evaluated at x nl .1.5 Cavity Quality FactorMicrocavities have exhibited the highest quality factors among all types <strong>of</strong> resonators.A value <strong>of</strong> > 10 11 was reported for a microtoroid at 1559 nm in 2007 [7]. The qualityfactor is the primary performance characteristic measure <strong>of</strong> microspheres <strong>and</strong> is de-ned in terms <strong>of</strong> the resonators ability to store energy. In its most simple expression,the Q factor <strong>of</strong> a resonant system is given as:Q = 2(Energy Stored)=(Power Dissipated per cycle): (1.7)
15The Q factor is dictated by the length <strong>of</strong> time for which a photon can be stored withinthe cavity <strong>and</strong> is limited by several other factors apart from the WGM losses. In fact,WGM losses have an appreciable eect only for radii less than about 7 m [29].The losses within a microsphere resonator arise due to both internal <strong>and</strong> externalmechanisms. The internal losses result from WGM losses <strong>and</strong> material losses fromthe cavity such as surface scattering, water absorption <strong>and</strong> bulk absorption <strong>of</strong> thematerial.Coupling losses, Q coupling , depend on the coupling technique <strong>and</strong> on the ability toachieve good phase matching between the coupler <strong>and</strong> the microsphere. We typicallyuse 1-2 m diameter taper bres for coupling due to their near ideal performance[25]. These bres are fabricated by heating <strong>and</strong> stretching a str<strong>and</strong> <strong>of</strong> single modebre down to a diameter <strong>of</strong> 1 m. An evanescent eld forms in this region whichis then coupled into an adjacent microsphere. The coupling Q factor is governed bythe overlap <strong>of</strong> the evanescent elds <strong>of</strong> the bre taper <strong>and</strong> the sphere (c.f. page 28 formore details) [30]. The interaction strength between the cavity mode <strong>and</strong> bre modegovern Q coupling . 1It has been found [31] that the Q factor shows an initial rapid decay within therst two to three minutes <strong>of</strong> fabrication <strong>of</strong> microspheres. This is due to one or twomonolayers <strong>of</strong> water forming on the surface. Ideally, fabrication should be performedin a vacuum environment. The formula for losses due to water absorption [32] isQ w s2a8n 3 s1 w; (1.8)where 0.2 nm is the thickness <strong>of</strong> the monolayers <strong>of</strong> water, <strong>and</strong> w is the absorption1 Q coupling is maximised when the mode matching is optimised in terms <strong>of</strong> the spatial modes <strong>and</strong>the propagation constants <strong>of</strong> the microsphere <strong>and</strong> bre taper.
16coecient <strong>of</strong> water. There is an a 1=2 dependency, but the wavelength has an inversesquare root dependency.Bulk losses do not exhibit a sphere size dependency. The absorption coecient<strong>of</strong> silica, s , has a minimum at 1550 nm corresponding to a peak in Q at this value,while for uorozirconate glass this minimum is at 2.6 m. We use the form <strong>of</strong> theequation given in [33], for bulk losses:Q bulk = 2n s s (1.9)where s (0.7 m 4 = 4 )+1:1¢103 exp(4:6 m=)+4¢10 12 exp( 56 m=))dB/km.Bulk losses are dominant for large spheres at 633 nm. (NB The Q arising from otherloss mechanisms are much higher than Q bulk ).Surface scattering is due to surface roughness <strong>and</strong> absorption arising from impuritieswithin the cavity. Our passive silica microspheres are produced by meltingthe tip <strong>of</strong> a silica bre <strong>and</strong> our <strong>doped</strong> microspheres are fabricated from a powderglass sample (c.f. Section 2.2). While production <strong>of</strong> the microspheres results in nearatomic smoothness owing to surface tension during melting, it has been shown thatthese minute irregularities not only degrade the Q factor for small spheres, but alsocause light to be backscattered into degenerate counter-propagating modes [34]. Forsilica spheres, it is imperative that the bre be cleaned with acetone <strong>and</strong>, sometimes,with other chemicals before production. An accurate model describing the surfacescattering Q factor, Q ss , has yet to be found, but observations have found a (a) 1=2relationship [33]. This model is <strong>of</strong> the formQ ss =K T E 3 3 a1 + K T E 8n s 2 B 2 ; (1.10)2where K T E is the suppression coecient dened as the ratio <strong>of</strong> complete scattered
17power to the power scattered into a TE mode scattering angle dened in [33], Bis the statistical correlation length, <strong>and</strong> is the average st<strong>and</strong>ard deviation <strong>of</strong> thesurface roughness. The TE <strong>and</strong> TM mode suppression coecients are 2.8 <strong>and</strong> 9.6respectively. The parameters B <strong>and</strong> have been measured [32] to be 5 nm <strong>and</strong> 1.7nm respectively.The size dependence <strong>of</strong> Q ss for a wavelength <strong>of</strong> 980 nm is plotted in Fig. 1.4. Apartfrom sphere size, the choice <strong>of</strong> pump wavelength will dictate the observed Q. Forexample, at a wavelength <strong>of</strong> 633 nm, surface scattering becomes dominant for radii <strong>of</strong>less than about 20 m until whispering gallery losses begin to dominate at about 7 m(not shown). Longer wavelengths do not share this dependence on surface scattering,which is due to the role <strong>of</strong> the absorption coecient <strong>of</strong> water, w . This coecientis only 0.363 m 1 at 633 nm <strong>and</strong> rapidly increases to 799 m 1 at 1550 nm. Thisplays a crucial role in selecting a suitable wavelength <strong>and</strong> sphere diameter in orderto achieve large Qs. The Er 3+ <strong>and</strong> Yb 3+ ions in the glasses under study here have alarge absorption coecient at 980 nm compared to other wavelengths (except C-b<strong>and</strong>wavelengths), thus making ion absorption a dominating factor when choosing theoptimal pump wavelength. Unlike the passive microspheres, our <strong>doped</strong> microspheresare transported from France to our lab in a petri dish, which undoubtedly increasesthe surface roughness. The importance <strong>of</strong> the surface roughness for our spheres isshown in Fig. 1.4(b) where we have reasonably assumed degraded surface parameterscompared to silica microspheres. The B value is taken as 7 nm <strong>and</strong> is taken as 15nm. We nd a loaded Q factor <strong>of</strong> 1 ¢ 10 7 at 780 nm for our ZBLALiP microsphereswhich corresponds reasonably with the unloaded Q factor in Fig. 1.4(b). We canassume surface scattering losses are the largest loss mechanism.
18(a) Silica glass(b) ZBLALiP glassFigure 1.4: Total quality factor <strong>and</strong> individual quality factors as a function <strong>of</strong> sphere diameterat a wavelength <strong>of</strong> 980 nm. Water absorption limits the Q in silica. In (b), the statisticalcorrelation length, B, <strong>and</strong> the average st<strong>and</strong>ard deviation <strong>of</strong> the surface roughness, , areincreased by a factor <strong>of</strong> about three to simulate the estimated poorer surface quality in our<strong>doped</strong> microspheres (B = 7 nm <strong>and</strong> = 15 nm). Coupling losses with a tapered bre havebeen neglected.
19An issue closely related to Q factor is nesse, F, dened as the free spectral range(FSR) divided by the b<strong>and</strong>width <strong>of</strong> the resonances, or equivalently,F =Q2n s a : (1.11)To date, the highest reported nesse is 10 7at an <strong>optical</strong> wavelength, recorded bySavchenkov et al. in 2007 in a CaF 2 microtoroid [7]. As a comparison, the highestreported nesse in a super Fabry-Perot cavity is 10 5 at <strong>optical</strong> wavelengths [2].Each <strong>of</strong> these individual contributions to the cavity loss can be combined togetherto give a system Q factor asQ 1total = Q wgm 1 + Q 1material + Q 1coupling(1.12)Q 1material = Q ss 1 + Qwater 1 + Q 1bulk ;where Q wgm is the whispering gallery Q, <strong>and</strong> Q material is the material Q.1.6 Mode VolumeThe degree <strong>of</strong> modal connement in a sphere can be determined by integrating thevolume as shown in Fig. 1.3, <strong>and</strong>, optionally, choosing a 1=e 2 boundary for theintensity distribution. It is a non-trivial exercise to determine the volume based onthe set <strong>of</strong> formulae in Eqn. 1.2. Despite that, it can be shown that mode volumescan be as small as 1000-4000 m 3 , depending on microsphere size <strong>and</strong> wavelength.Such tightly propagating modes around the microsphere can easily develop very highexcitation densities ( 10 3 Vm1 ) as mentioned earlier. This is very important forstudying nonlinear processes <strong>and</strong> microlaser operation.The eective mode volume, V eff , is dened as the integral <strong>of</strong> the square <strong>of</strong> the
20eld (Eqn. 1.2) over a quantisation volume, V Q , <strong>and</strong> is given by [35]V eff =ZVQ(r; ; )E(r; ; ) 2 dV; (1.13)where the quantisation volume includes both real internal microsphere elds <strong>and</strong> theimaginary evanescent elds, <strong>and</strong> =(n2s ; r a1; r > a:(1.14)It can be shown that both TE modes <strong>and</strong> TM modes have dierent mode volumesdue to slight dierences in the conguration <strong>of</strong> the elds in the cavity (c.f. Fig. 1.5).TE modes are found deeper inside the sphere <strong>and</strong>, therefore, occupy a smaller volume(<strong>and</strong> an associated higher Q factor), as given by [36]V T E 1:02(2a) 11=6 (=n s ) 7=6V T M 1:08(2a) 11=6 (=n s ) 7=6 :(1.15)There is also an alternative denition <strong>of</strong> mode volume for nonlinear processes [37]V eff RVQ E(r; ; )2 dVRVQ E(r; ; )4 dV 2(1.16) 3:4 3=2 (=2n s ) 3 l 11=6p l m + 1 ; (1.17)where l 2an s =. In the case <strong>of</strong> both Eqns. 1.15 <strong>and</strong> 1.17, the volume scalesas a 11=6 . However, as can be seen from Fig. 1.5, which presents the quantum <strong>and</strong>nonlinear mode volumes, there are some dierences in the denitions.Another issue to note is the dierence in mode volume between the pump wavelengthfor Er 3+(980 nm) <strong>and</strong> the lasing wavelength (1.5 m): the volume scalesalmost linearly with wavelength. Therefore, the gain region in the 1.5 m mode issome 1.7 times larger than the excitation region.
21Figure 1.5: Mode volume for a <strong>doped</strong> microsphere with n s = 1:5 for = 1550 nm (squares)<strong>and</strong> 980 nm (diamonds). The TE modes have a slightly smaller mode volume. In contrast,the nonlinear mode volume (green markers) is at variance with the quantum mode volumes(red <strong>and</strong> blue markers).
221.7 Spectroscopy <strong>of</strong> Rare Earth IonsThe lanthanides, or <strong>rare</strong> <strong>earth</strong>s as they are referred to in this thesis, have unique spectroscopicproperties arising from their electronic conguration. The material scienceshave an intense interest in the properties <strong>of</strong> glasses, crystals, <strong>and</strong> ceramics <strong>doped</strong>with these ions (e.g. Ce 3+ , Nd 3+ , Sm 3+ , Ho 3+ , Er 3+ , Tm 3+ , <strong>and</strong> Yb 3+ ). All transitionsoccur with 4f electrons deep within the ion, shielded by <strong>optical</strong>ly passive outerelectrons in the lled 5s <strong>and</strong> 5d shells. This shielding \protects" the transitions frominteractions with elds in the lattice environment. Evaluation <strong>of</strong> the glass behaviourmust include aspects <strong>of</strong> the spectroscopic properties, such as Judd-Ofelt parameters,McCumber analysis, <strong>and</strong> cavity eects.This work is concerned with Er 3+<strong>doped</strong> uoride <strong>and</strong> <strong>phosphate</strong> glasses, whichexhibit large homogeneous <strong>and</strong> inhomogeneous broadening <strong>of</strong> the levels compared to<strong>doped</strong> crystals. The inhomogeneous broadening arises from an overlap <strong>of</strong> Stark levelsarising from the location <strong>of</strong> individual lattice sites for the <strong>rare</strong> <strong>earth</strong> ions, despitethe aforementioned shielding. The homogeneous broadening arises because phononsaect all ions by smearing out the transitions <strong>and</strong> energies <strong>of</strong> emitted photons withapproximately the same magnitude as inhomogeneous broadening.1.8 Selection Rules for Er 3+In principle, there should be no emissions from Er 3+ due to the selection rules; alltransitions have the same parity <strong>and</strong> are, therefore, not allowed. Judd-Ofelt theoryreveals, however, that certain transitions are in fact weakly allowed when the 4felectrons are mixed with the 5d electrons. These 5d electrons have opposite parity
23to the 4f electrons.If transitions in the 4f levels were allowed by selection rules,the lifetimes would typically be less than a few nanoseconds. Since the transitionsin the 4f levels are only weakly allowed, the lifetimes can range from hundreds <strong>of</strong>microseconds to milliseconds for metastable levels.The parameters describing the strength <strong>of</strong> these transitions are the electric dipoleoscillator strength <strong>and</strong>, to a lesser extent, the magnetic dipole oscillator strength. Itis important to note that higher order interactions are also possible. The selectionrules for electric dipole transitions in their most rigorous form are in Table 1.1 [38].The notation in the table is used to designate energy levels in the form 2S+1 L J , e.g.,4I 15=2 for the ground level in Er 3+ has S = 3=2, L = 6, <strong>and</strong> J = 15=2. The symbol Jis taken to mean the total angular momentum unless stated otherwise.Table 1.1: Rigorous selection rules for electric dipole transitions.Spin quantum number ¡S = 0Orbital angular momentum ¡L = ¦1Total Angular Momentum ¡J = 0;¦1; J = 0 9 0Absorption measurements over a wide spectral range - from UV to near IR - formthe basis for theoretical calculations. The McCumber theory is a powerful, <strong>and</strong> yetsimple, tool that equates the absorption cross-section to the emission cross-sectionbased on absorption measurements. Conceptually, the absorption cross-section is thearea <strong>of</strong> the ion that will absorb a photon passing through it. In a similar vein, theemission cross-section is the area <strong>of</strong> the ion that will emit a photon. Therefore, thecross-section can be interpreted as a probability <strong>of</strong> absorbing or emitting a photon.
241.9 Radiative Emission RatesIn the previous section we mentioned a number <strong>of</strong> techniques for studying laser behaviour,i.e. Judd-Ofelt theory <strong>and</strong> McCumber theory. Before proceeding, we describethree processes by which light can interact with matter: absorption, spontaneousemission, <strong>and</strong> stimulated emission. These interactions are ascribed with three EinsteinCoecients: B J0 ;J , B J;J 0, <strong>and</strong> A J;J0respectively. For the two level system in Fig.1.6, these interactions are related through the equationN J 0B J0 ;J = N J (B J;J 0g() + A J;J 0); (1.18)where N is the population <strong>of</strong> the upper (J) or lower (J 0 ) levels, <strong>and</strong> g() is a lineshapefunction describing the emission probability <strong>of</strong> a photon with wavelength . Thislineshape function is given by Planck's Law.In reality, levels J <strong>and</strong> J 0 are composed <strong>of</strong> Stark-split levels, populated accordingto Boltzmann's equation. Figure 1.7 shows the population distribution for the lasingtransition in Er 3+ . The upper Stark-split level in 4 I 13=2 is only 32% <strong>of</strong> the lowerStark-split level. This means that the Einstein coecients need to be taken as thesum <strong>of</strong> each coecient over all the transitions from each Stark level M [38]. For thespontaneous emission rate A J;J 0, this becomesA J;J0 =12D 0 + 1XMJ ;MJ 0 A 0 J;J 0(M J; M J 0); (1.19)where D 0 is the degeneracy <strong>of</strong> level J 0 . Later in this thesis we will apply this theoryto Er 3+ <strong>doped</strong> ZBLALiP.
25Figure 1.6: Fundamental light-matter interactions in a two level system. The notation J<strong>and</strong> J 0 designate the upper <strong>and</strong> lower energy levels respectively.Figure 1.7: Population <strong>of</strong> each <strong>of</strong> the Stark levels for the 1.5 m lasing transition ( 4 I 13=2 ! 4I 15=2 ) in Er 3+ .
261.10 Material Loss Mechanisms in LasersIn Section 1.5 several cavity loss mechanisms that degrade the Q factor were mentioned.In this section we consider a number <strong>of</strong> material loss mechanisms inside thelaser cavity that aect the lasing quantum eciency. The eciency in a downconversionlaser, = dP out =dP in , is governed by the energy conservation rule E signal
27which is negative for both uoride <strong>and</strong> <strong>phosphate</strong> glasses, results from an unequalrefractive index variation across the pump beam's Gaussian prole. Mode propagationbecomes distorted in the presence <strong>of</strong> this lensing. These issues have varying degrees<strong>of</strong> importance in the two glasses <strong>of</strong> study <strong>and</strong> will be elucidated in later chapters.
28Chapter 2Fabrication <strong>of</strong> <strong>and</strong> Coupling toMicrospheres2.1 IntroductionIn this chapter we exp<strong>and</strong> on the brief introduction to tapered bre coupling to microspheresin Chapter 1. After giving a description <strong>of</strong> the microsphere fabrication<strong>and</strong> coupling details, the procedure for fabricating <strong>and</strong> characterising tapered bres- our coupling element <strong>of</strong> choice - is outlined. In terms <strong>of</strong> coupling, the taper modemust be overlapped both spatially <strong>and</strong> spectrally with the microsphere mode. Theevanescent wave component <strong>of</strong> the light eld is used for this purpose, <strong>and</strong> we presenthow one can ensure that the coupling technique satises the mode-matching requirementswhen a taper bre is used as the coupling component. Spatial mode matchingrequires good taper-microsphere alignment, <strong>and</strong> spectral mode matching is achievedby matching the propagation constant <strong>of</strong> the taper with that <strong>of</strong> the microsphere.
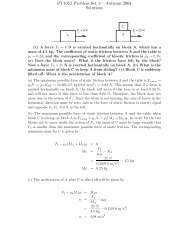
292.2 Microsphere FabricationAll the <strong>doped</strong> microspheres used for this thesis work are made in the Laboratoired'Optronique <strong>of</strong> ENSSAT, Lannion using a microwave plasma torch. The torch isshown schematically in Fig. 2.1 <strong>and</strong> uses a mixture <strong>of</strong> argon <strong>and</strong> oxygen or nitrogen.The plasma is generated using a microwave supply with an oscillator frequency <strong>of</strong>2.4 GHz <strong>and</strong> a maximum power <strong>of</strong> 2 kW [40]. Fluoride or <strong>phosphate</strong> glass is rstcrushed into a powder <strong>and</strong> is then slowly fed into the ame by h<strong>and</strong>. The glass ismelted on passing through the plasma ame <strong>and</strong> surface tension gives the spherestheir spherical form. After passing through, the free spheres solidify <strong>and</strong> are collectedin a dish several tens <strong>of</strong> cm beneath the torch. The diameter <strong>of</strong> the spheres producedvaries between 10 m <strong>and</strong> 200 m <strong>and</strong> is largely dependent on powder size. Thesystem can be optimised for dierent glass materials by changing the ratio <strong>of</strong> thegases feeding the plasma discharge.The quality <strong>of</strong> the resulting microspheres is reliant on the black-art <strong>of</strong> carefullyselecting a suitable gas ow rate for the melting point <strong>of</strong> the glasses. Evidently, themost important factor in determining the Q factor is the surface roughness, whichmust be somewhat higher than that for silica microspheres fabricated from the end <strong>of</strong>a tapered bre using a CO 2 laser, as outlined below. We have assumed that nucleation<strong>of</strong> the dopant ions is not a problem.Silica microspheres were fabricated by placing the end <strong>of</strong> a tapered bre into thebeam <strong>of</strong> a 20 W Synard CO 2 laser. Silica is highly absorbing at the lasing wavelength<strong>of</strong> 10.2 m <strong>and</strong> melts into a spherical shape under surface tension. The scanningelectron microscope image in Fig. 2.2 shows the internal \fetal-like" structure obtainedwith clearly dened core <strong>and</strong> cladding regions. As glass is a poor reector
30Figure 2.1: Microsphere fabrication with a microwave plasma chamber.A bulk sampleis rst ground into a powder <strong>and</strong> then injected through a quartz tube to a ame, wheremicrospheres form under surface tension. The microsphere can later be mounted on theend <strong>of</strong> an <strong>optical</strong> bre for manipulation (see bottom right image).<strong>of</strong> secondary electrons, they penetrate deep into the glass while very few electronsoriginate from the glass surface. The structure reveals that a WGM will propagate inthe cladding material which forms the microsphere surface. This aects the Q factorin so much as absorption losses in this cladding material are higher than in the silicacore. In future work it may be possible to exploit the low absorption loss <strong>of</strong> silicaby rst removing the cladding through etching with HF acid <strong>and</strong> then fabricating amicrosphere with the CO 2 laser.
31Figure 2.2: Scanning Electron Microscope image <strong>of</strong> a silica microsphere fabricated by meltingthe end <strong>of</strong> a tapered <strong>optical</strong> bre. The electrons penetrate into the microsphere, revealingthe bre core in the centre <strong>and</strong> cladding in the outer region, where the WGM shouldpropagate.2.3 Introduction to CouplingTechniques for evanescent coupling <strong>of</strong> light into microspherical cavities include prismcouplers [41], <strong>optical</strong> bre half-block couplers [42], angle-polished bres [43], <strong>and</strong> bretapers [40]. Fibre tapers have proven to be the most attractive device for achievingnear loss-less coupling <strong>of</strong> light into microspherical cavities <strong>and</strong> exciting the fundamentalresonant mode [25, 40]. The overlap <strong>of</strong> the taper <strong>and</strong> microsphere evanescentelds denes the strength <strong>of</strong> this coupling [30]. The attainment <strong>of</strong> small taper diameters,typically in the range <strong>of</strong> 1 to 4 m, is critical to maximise this coupling.Recent discussions on the form <strong>of</strong> the evanescent eld have shown the spatial extent<strong>of</strong> the radial component <strong>of</strong> the eld to greatly increase for diameters less than 2 m[44, 45]. It has also been reported that ecient coupling <strong>of</strong> light into sub-millimetresized silica microspheres is possible for taper diameters up to 4.5 m [46].
32Figure 2.3:Schematic <strong>of</strong> (a) tapered bre-microsphere <strong>and</strong> (b) angle-polished bremicrospherecoupling schemes.We start by briey summarising two <strong>of</strong> the most commonly used coupling schemesnowadays: angle-polished bres <strong>and</strong> tapered bres. The advantages <strong>and</strong> disadvantages<strong>of</strong> both schemes are discussed with reference to phase matching constraints <strong>and</strong>maximal coupling eciencies. The schematic in Fig. 2.3 explains the basic conceptbehind the two techniques.2.3.1 Angle-Polished FibresWe initially investigated these couplers as a robust method <strong>of</strong> coupling. The deviceis a hybrid <strong>of</strong> the more traditional prism <strong>and</strong> taper couplers [43]. The fabricationconsists <strong>of</strong> polishing the end <strong>of</strong> a single mode bre to an angle sucient to obtainecient coupling into the sphere. By placing the sphere at the polished surface, TIRconditions will be met. Likewise, this is the case with prism coupling. Therefore, thephase matching condition is controlled by the polish angle, = arcsin(n sphere =n fibre ).
33The eective index <strong>of</strong> the resonant mode in the sphere is found from n sphere = ln s =x (n)lwhere n s is the refractive index <strong>of</strong> the sphere material, for example silica, as determinedfrom the Sellmeier dispersion formula, <strong>and</strong> l is the polar mode number. Theeective index <strong>of</strong> the bre is assumed to be =k, where is the propagation constantfor the sphere material <strong>and</strong> k is the free space propagation constant, <strong>and</strong> is evaluatedfrom Eqn. 2.1 for the fundamental HE 11 mode. Figure 2.4 shows the required polishangle as a function <strong>of</strong> sphere radius for n = 1 <strong>and</strong> n = 2 modes at a wavelength<strong>of</strong> 980 nm. For decreasing sphere sizes the phase matching condition becomes moreselective with almost a 1 angle to 1 m diameter correspondence.Among the advantages <strong>of</strong> angle-polished bres are their robustness <strong>and</strong> smallpackage size. Further advantages <strong>of</strong> angle-polished bres are the ease <strong>of</strong> alignment <strong>of</strong>the sphere <strong>and</strong> bre as the interaction region is larger, <strong>and</strong> good coupling eciencies<strong>of</strong> up to 60% [43]. One disadvantage <strong>of</strong> using bre tapers is the competing requirement<strong>of</strong> small diameter to maximise the evanescent eld, against a suitably large diameterfor good phase matching. For example, a silica bre diameter <strong>of</strong> 6 m is required tophase match an Er 3+ :ZBLAN sphere with a diameter <strong>of</strong> 100 m [40]. The fraction <strong>of</strong>the eld in the core <strong>of</strong> the bre is 100% for this diameter taper.2.3.2 Tapered FibresIn order to eectively couple light into a microsphere, the angular momentum <strong>and</strong>propagation constant <strong>of</strong> the pump beam must match that <strong>of</strong> the WGMs within thesphere, in such a way that there is phase matching at the point <strong>of</strong> closest contact.We decided on tapered bres as opposed to angle-polished bres to achieve this.Light is coupled between the microsphere <strong>and</strong> bre via evanescent wave coupling.
34Figure 2.4: Calculated polish angle as a function <strong>of</strong> sphere radius for a wavelength <strong>of</strong> 980nm for the fundamental n = 1 mode, <strong>and</strong> the n = 2 mode.The technique involves overlapping the sphere with the evanescent eld <strong>of</strong> the brewhile maintaining good phase matching. In contrast to angle-polished bres, taperedbres can achieve greater than 99% coupling eciency when operating at their criticalcoupling position [25].2.4 Mode Propagation ConstantsThe transcendental equation for the propagation constant <strong>of</strong> a bre is given by [47] J0n (ha)haJ n (ha) + K n(qa)0 n2core Jn(ha)0 n=qaK n (qa) haJ n (ha) k 2¢(qa)2+ (ha) 2£2 ; (2.1)for HE nm <strong>and</strong> EH nm modes, where J n (K n ) is a Bessel function (modied Hankelfunction <strong>of</strong> the second kind) <strong>of</strong> order n, k is the free space propagation constant, n coreis the index <strong>of</strong> the core, n clad is the index <strong>of</strong> the cladding, h 2 = n 2 corek 2 2 is the radial
35propagation constant in the core, q 2 = n 2 clad k2 2 is the radial propagation constantin the cladding, <strong>and</strong> the prime denotes dierentiation with respect to the argument.Eqn. 2.1 is solved numerically for the fundamental HE 11 bre mode for specic taperdiameters. The propagation constant <strong>of</strong> the sphere is = kl=x nlm , where x nlm is themicrosphere size parameter determined from Eqn. 1.4. 1Similar equations for TE<strong>and</strong> TM modes can be obtained [47], <strong>and</strong> are plotted in Fig. 2.5(a). A summary<strong>of</strong> waveguiding properties <strong>of</strong> tapered bres is given in [44] <strong>and</strong> [47]. The taper <strong>and</strong>sphere are phase matched when the dierence between propagation constants is zero.This is represented in Fig. 2.5(b) for a silica microsphere at 980 nm.2.5 Tapered Fibre FieldsIf ecient coupling is to be achieved using tapers or half-tapers, it is imperative thatthe taper be only a few microns in diameter. Taper coupling provides a simple <strong>and</strong>potentially compact method <strong>of</strong> exciting the sphere.We fabricate low-loss 3-4 mdiameter tapers using a 25 W CO 2 Synrad laser, <strong>and</strong> 1-2 m diameter tapers usingeither a ceramic bre heater or a ame. Fibre taper coupling eciencies <strong>of</strong> more than99% have been reported [25], indicating excellent phase matching between the taper<strong>and</strong> microsphere.As with the microsphere, the eld inside the bre is described by a Bessel function,<strong>and</strong> the eld outside the bre is described by a Hankel function. For elds inside the1All calculations, both with the microsphere <strong>and</strong> tapered bre, should be done with the eectiveindex, n eff <strong>and</strong> not simply n sphere or n core . However, it is sometimes acceptable to approximaten eff for convenience.
36bre, the exact electric eld equations in cylindrical coordinates are [44]e r =e =e z =a 1 J 0 (2ahR) + a 2 J 2 (2ahR)f 1 ()J 1 (2ah)a 1 J 0 (2ahR) a 2 J 2 (2ahR)g 1 ()J 1 (2ah)i2ah J 1 (2ahR)a J 1 (2ah) f 1():(2.2)The elds outside the bre are given by:e r =e =e z =2ah a 1 K 0 (2aqR) a 2 K 2 (2aqR)f 1 ()2aq K 1 (2aq)2ah a 1 K 0 (2aqR) + a 2 K 2 (2aqR)g 1 ()W K 1 (2aq)i2ah K 1 (2aqR)a K 1 (2aq) f 1():(2.3)The linear polarisation is given by f 1 () <strong>and</strong> g 1 (), which are sine <strong>and</strong> cosine functionsaround the bre respectively. The other variables are not dened here, but theinterested reader can refer to [44] for details.Another representation <strong>of</strong> these equations that has much importance for tapermicrospherecoupling, as well as atom-light interactions, is the Poynting vector. ThePoynting vector gives the power density across the bre <strong>and</strong> outside the bre in theevanescent region, i.e. the mode pattern. In the limit <strong>of</strong> a weakly guiding approximation,the Poynting vector is given by ! !S (r) = 2! 1 E ¢ H , <strong>and</strong> is proportional to thesquare <strong>of</strong> the Bessel or Hankel function [44]. Figure 2.6 shows this calculation for abre <strong>of</strong> radius 0.6 m <strong>and</strong> light <strong>of</strong> wavelength 1.5 m. An important feature in thisplot is the sharp discontinuity at the bre surface, which only becomes appreciablefor diameters below roughly 2 m. At this radius <strong>of</strong> 0.6 m, about 18% <strong>of</strong> the poweris in the evanescent region, while for a radius <strong>of</strong> 1.5 m there is only about 1% <strong>of</strong> thepower in the evanescent region.
37(a) Propagation constant at 980 nm.(b) Phase matching condition at 980 nm for a silica microsphere.Figure 2.5: (a) Propagation constant for the fundamental HE 11 mode at 980 nm, <strong>and</strong> (b)phase matching condition at 980 nm in a silica microsphere.
38Figure 2.6: Poynting vector for a 0.5 m radius bre taper for light with a wavelength <strong>of</strong>1.5 m. The boundary <strong>of</strong> the bre wall shows a discontinuity in the vector eld causing alarge power density. The evanescent eld is quasi linearly polarised.2.6 Fabrication <strong>and</strong> Characterisation <strong>of</strong> TaperedFibres 2This section describes how we designed a reproducible method <strong>of</strong> fabricating adiabatictapers with 3-4 m diameter. The method is based on a heat-<strong>and</strong>-pull rig, wherebya CO 2laser is continuously scanned across a length <strong>of</strong> bre that is being pulledsynchronously. Our system relies on a CO 2 -compatible mirror mounted on a gearedstepper motor in order to scan the laser beam across the taper region.We showthat this system oers a reliable alternative to more traditional rigs incorporatinggalvanometer scanners. Transmission losses are routinely between 0.1 <strong>and</strong> 0.3 dB,2 The following sections have appeared in \Heat-<strong>and</strong>-pull rig for ber taper fabrication,"Rev. Sci. Instrum., 77, 083105, (2006).
39indicating the satisfactory production <strong>of</strong> adiabatic tapers. The operation <strong>of</strong> the rig isdescribed in detail, <strong>and</strong> an analysis on the produced tapers is provided. The exibility<strong>of</strong> the rig is demonstrated by fabricating prolate dielectric microresonators (so-called"bottle" resonators) using a micro-tapering technique. Such a rig is <strong>of</strong> interest toa range <strong>of</strong> elds that require tapered bre fabrication, such as microcavity-tapercoupling, <strong>optical</strong> bre sensing, <strong>and</strong> the fabrication <strong>of</strong> fused biconical tapered couplers.It should be noted at the outset that bre tapers fabricated using this rig were onlyused in early experiments.The experiments in Chapters 3 <strong>and</strong> 4 relied on 1 mdiameter bre tapers fabricated using either a butane torch or ceramic heaters.2.6.1 IntroductionThe four most widely exploited means <strong>of</strong> achieving micron-sized tapers are by ame[25, 48, 49], CO 2 laser heating [50], micro-furnace [51, 52], <strong>and</strong>, to a lesser extent,fusion splicer [40]. While subwavelength diameters have been shown to be achievablewith the ame method, it presents signicant technical challenges [49]. Firstly, thegas ow rate must be precisely regulated in order to maintain a suitable temperature.Secondly, the purity <strong>of</strong> the gas supply becomes increasingly important for smallertaper diameters due to contamination concerns. Air currents in the vicinity <strong>of</strong> theame also pose a problem by causing areas <strong>of</strong> uneven heating, thereby limiting theoption <strong>of</strong> scanning the ame across a length <strong>of</strong> bre. 3Despite being able to producesub-micron tapers with the micro-furnace method, the bres cannot be controllablystructured to produce dierent taper proles. We have also found that such tapersare not adiabatic, <strong>and</strong> the micro-furnace itself degrades substantially after fabricating3The alternative is to scan the taper over the stationary ame. This has the added advantage <strong>of</strong>producing long taper waists.
40a few dozen tapered bres.As an alternative, CO 2lasers present a largely stable <strong>and</strong> easily controllablemethod <strong>of</strong> heating a bre. Air currents or other deleterious environmental eectsbear no consequence on the power output or the ability to scan the beam across thebre with a mirror scanner. It is possible to precisely control the length <strong>of</strong> bre to beheated (i.e. the hot-zone), thereby yielding any desired taper prole [53]. The physicalprocess <strong>of</strong> heating a bre with a laser beam involves the bre absorbing radiation<strong>and</strong> heating from the inside, whereas for a ame the process involves heating the surface<strong>of</strong> the bre. There is an inverse square relationship between radius <strong>and</strong> heatingfor a CO 2 laser heat source, while for a ame heat source there is simply an inverserelationship between heating <strong>and</strong> radius. This ultimately places a stricter limit on theminimum taper diameter attainable for a given CO 2 laser power as compared with aame heat source [54]. Previous reported attempts <strong>of</strong> producing tapers using the CO 2laser technique have achieved a diameter <strong>of</strong> 4.6 m with a CO 2 laser power <strong>of</strong> 13 W,<strong>and</strong> FWHM spot size <strong>of</strong> 820 m using a galvanometer mirror scanner [50]. Here, wedescribe a reliable method <strong>of</strong> fabricating low-loss 3-4 m diameter tapers as well asthe possibility <strong>of</strong> fabricating bottle-resonators using a micro-tapering technique witha 25 W CO 2 laser.Our fabrication method relies on the use <strong>of</strong> a geared stepper motor to scan thelaser beam rather than the more traditional galvanometer. Implementation <strong>of</strong> ourrig is trivial, requiring only interconnection <strong>of</strong> the stepper motor with the controllercircuit. In contrast, Galvanometer scanners require PD (proportional-derivative) orPID (proportional-integral-derivative) control, which can be awkward to tune correctly.From a mechanical perspective, the stepper motor has a more robust design
41<strong>and</strong> better torque, which negates any eects induced by the inertia <strong>of</strong> the mirrorattached to the shaft <strong>of</strong> the motor.Additionally, the stepper motor represents asignicant cost saving since the cost <strong>of</strong> a scanning galvanometer system is typicallyin excess <strong>of</strong> US $1990 [55], while the cost <strong>of</strong> a Radionics hybrid stepper motor, gearbox, <strong>and</strong> controller circuit is approximately US $210 [56]. The following subsectionsdescribe the procedure <strong>and</strong> requirements for pulling adiabatic bre tapers [53, 57]with typical losses in the range <strong>of</strong> 0.1 to 0.3 dB at 980 nm, <strong>and</strong> prolate resonators.2.6.2 ExperimentA schematic <strong>of</strong> the laser-scanning rig for taper fabrication is shown in Fig. 2.7.Custom designed s<strong>of</strong>tware automates all the instrument control <strong>and</strong> data acquisitionthrough serial <strong>and</strong> USB interfaces, thereby ensuring ease <strong>of</strong> parameter adjustment<strong>and</strong> reproducibility. A 12.5 cm focal length ZnSe lens focuses the laser beam ontothe bre with a FWHM spot size <strong>of</strong> approximately 500 m, 5.5 cm in front <strong>of</strong> thescanning mirror. The stepper motor used in conjunction with a 500:1 gear box in halfstepmode has a resolution <strong>of</strong> 1:8 ¢ 103 degrees per half-step, which corresponds to ahot-spot translation <strong>of</strong> around 1.7 m per half-step on the bre. The hot-spot refersto the point on the bre which is being heated by the laser beam at any instant. A 1 00gold mirror <strong>and</strong> holder are vertically mounted on the shaft <strong>of</strong> the gear box. The CO 2laser beam is incident on the centre <strong>of</strong> the mirror at an angle <strong>of</strong> 45 <strong>and</strong> is directedonto the bre.A Thurlby Th<strong>and</strong>er TG250 function generator, connected to thestepper motor controller circuit, cyclically scans the mirror through a sweep angle <strong>of</strong>approximately 10 , thereby scanning the laser beam across the bre. Alternatively, wecan use customised limit switches to control the sweep angle <strong>of</strong> the mirror. Another
42Figure 2.7: Schematic <strong>of</strong> the taper fabrication rig. Dashed lines indicate control lines ordata transfer.function generator, connected to the stepper motor controller circuit, provides theclocking pulses, which dictate the speed at which the mirror scans the laser beam.The discrete nature <strong>of</strong> the stepper motor step-size is smeared out by the size <strong>of</strong> thebeam at the focus. Two motorised translation stages (St<strong>and</strong>a Ltd., Lithuania) pullthe ends <strong>of</strong> the bre taper (SM980 single mode bre from Fibercore) with a resolution<strong>of</strong> 1 m. As the taper is being drawn, the transmission loss <strong>of</strong> a 980 nm diode laserthrough the bre is monitored with a Thorlabs Si-photodiode (DET-series) connectedto a digital storage oscilloscope. The computer provides an analog voltage signal tothe UC-2000 laser controller.Since the taper prole closely follows an exponential prole, we use this relationshipto predict suitable scan lengths, L, <strong>and</strong> pull lengths, z, for any desired taperwaist radius, r(z),r(z) = r o exp( z=L); (2.4)
43where r o is the initial bre radius before tapering [53]. There is some exibility inchoosing z <strong>and</strong> L. Scan lengths ranging from 5 to 15 mm <strong>and</strong> pull lengths rangingfrom 12 to 40 mm were examined, <strong>and</strong> all yielded low transmission losses <strong>and</strong> taperdiameters <strong>of</strong> 3-4 m. We found that Eqn. 2.4 always gives an accurate prediction<strong>of</strong> the waist diameter. The pull speed is less exible, <strong>and</strong> a value <strong>of</strong> 80-110 m persecond provided the best results. Several preparatory steps are essential in ensuringnished taper quality. Firstly, the bre is liberally cleaned with acetone to removeinorganic substances. It is imperative that the laser beam <strong>and</strong> bre be horizontal towithin a few tens <strong>of</strong> microns so that the focus <strong>of</strong> the beam covers the bre preciselythroughout the scan.The bre must also be slightly taut before attempting thisalignment. Failure to optimise the alignment before starting fabrication results insagging <strong>and</strong> possible vibrations <strong>of</strong> the bre, which tends to distort taper proles,leading to high transmission losses. The polarisation <strong>of</strong> the laser beam is set verticalto the bre so that the absorption coecient is maximised [54].The taper prole was measured under a Nikon MM-66 microscope with a resolution<strong>of</strong> 2-4 m <strong>and</strong> is shown in Fig. 2.8. Surface roughness on the taper is notnoticeable as evidenced by the inset SEM image.2.6.3 Results <strong>and</strong> DiscussionAs a rule, tapers can only be produced with low losses if their prole follows the adiabaticitycriterion [57]. This criterion requires the taper prole to be such that thechange in taper angle is small enough to prevent light propagation being either coupledfrom the fundamental mode, HE 11 , to higher order parasitic modes in the bre or beinglost as radiation. The criterion can be stated as jdr=dzj (z)[ 1 (z) 2 (z)]=2,
44Figure 2.8: Taper prole for a 3 m diameter taper. The pull length is 40 mm, the scanlength is 7 mm, <strong>and</strong> the initial taper diameter is 125 m. The inset shows an SEM image<strong>of</strong> a section <strong>of</strong> the taper with a diameter <strong>of</strong> 5.9 m. The inset bar in the lower right is 1.0m.where jdr=dzj denes the local taper angle, (z), by the trigonometric expression(z) = arctan jdr=dzj. The other variables are (z), the local core radius, 1 (z) <strong>and</strong> 2 (z), the local propagation constants <strong>of</strong> the fundamental mode <strong>and</strong> the next closestmode respectively, <strong>and</strong> z is along the bre axis [53, 57]. The transcendental equationfor the propagation constants has been solved numerically as a function <strong>of</strong> local taperdiameter. Figure 2.9 shows a plot <strong>of</strong> this criterion <strong>and</strong> <strong>of</strong> the core taper angle <strong>of</strong> atypical adiabatic taper as produced by the above described method. The taper curveis based on an optimum exponential t <strong>of</strong> the measurements in Fig. 2.8 <strong>and</strong> has theform as described by Eqn. 2.4.When the angle <strong>of</strong> the delineation curve is less than approximately ten times the
45Figure 2.9: Approximated length-scale delineation curves for three taper fabrication techniques- direct CO 2 heating, indirect micro-furnace heating, <strong>and</strong> a 2-step process employingboth techniques. The green trace represents the delineation between guidance <strong>and</strong> nonguidance<strong>of</strong> light.
46taper angle, the light in the propagating mode will be lost to parasitic modes. Whilethe bre has only a single propagating mode in the untapered region, the taper itselfcontains multiple modes since the light is cladding-air guided. For a taper waist radius,r a , <strong>of</strong> 1.5 m, the core guidance parameter V = kr a np2 core n 2 clad 9:669 >2:405 at a wavelength <strong>of</strong> 980 nm, indicating the taper is multimoded [45]. The refractiveindex <strong>of</strong> the core, n core , is actually the eective index <strong>of</strong> the fundamental modedetermined from 1 (z)=k, where k is the free space wavenumber, <strong>and</strong> the refractiveindex <strong>of</strong> the air cladding, n clad , is 1. Once the taper is adiabatic, <strong>and</strong> below a diameter<strong>of</strong> about 0.8 m at a wavelength <strong>of</strong> 980 nm, light only propagates in the fundamentalmode.The delineation curve in Fig. 2.9 is read from right to left when considering a decreasingtaper diameter. Starting from the untapered region on the right, the initialtaper transition consists <strong>of</strong> a core, where the light propagates, <strong>and</strong> a cladding, wherethe refractive index dierence is ¡ = (n core n clad )=n clad = 7:8 ¢ 10 3 . An approximationfor the core guidance curve is given in [57], <strong>and</strong> is based on the assumption<strong>of</strong> an innite cladding diameter. Gradually, the diameter <strong>and</strong> core guidance parameterdecrease until the core eectively disappears <strong>and</strong> the propagating light becomescladding-air guided. At the taper waist, there is a large index dierence <strong>of</strong> about 0.42between the cladding <strong>and</strong> surrounding air causing the core guidance parameter togradually increase; this is shown as an increase in the angle <strong>of</strong> the delineation curve.Similarly, for the cladding guidance curve an approximation is given in [57], <strong>and</strong> isbased on the assumption that the core diameter is vanishing. Figure 2.8 shows a typicaltaper angle decreasing when approaching the taper waist. Both core <strong>and</strong> claddingcontribute to distinct regions in the delineation curve. The taper clearly meets the
47adiabaticity criterion since the angle <strong>of</strong> the taper transitions is suciently below thedelineation curve. Using a shorter wavelength diode laser would proportionately shiftthe delineation curve to the left <strong>and</strong> this would increase the taper-delineation curveseparation, consequently giving lower losses.2.6.4 Micro-furnace TaperingSubwavelength diameters <strong>of</strong> below 100 nm have been achieved with the micro-furnacemethod [58]. A 20 W CO 2 laser heats a small Sapphire tube (8-10 mm long, 2 mmouter diameter, <strong>and</strong> 0.8 mm inner diameter) that surrounds the bre rather th<strong>and</strong>irectly heating the bre with the laser. Alignment <strong>of</strong> the beam focus with the taperis not as stringent as compared to the direct laser heating method. A limitation <strong>of</strong>this method is that microstructuring <strong>of</strong> the bre prole cannot be achieved. Dierenttaper shapes may not be easily produced since the hot-zone cannot be precisely varied<strong>and</strong> is typically several millimetres in length, <strong>and</strong> a very short hot-zone is vital forthe micro-tapering step when producing bottle resonators. Furthermore, high losses<strong>of</strong> several dB have thus far been observed with the micro-furnace method becausethe taper transitions are non-adiabatic as shown in the delineation curve in Fig. 2.9.This is detrimental when coupling to the fundamental mode <strong>of</strong> a microresonator.2.6.5 Fabrication <strong>of</strong> Prolate MicroresonatorsIn recent years, interest in the use <strong>of</strong> microspherical resonators in cavity QED experimentshas increased [10].The use <strong>of</strong> such microcavities in these experimentsrequires the possibility <strong>of</strong> tuning the resonance frequency <strong>of</strong> the microcavity to anatomic line. In principle, there are two main methods <strong>of</strong> achieving this: strain tuning
48Figure 2.10: Optical micrograph <strong>of</strong> a bottle resonator with a diameter <strong>of</strong> 12 m <strong>and</strong> alength <strong>of</strong> 300 m. The bar is 10 m.<strong>and</strong> temperature tuning. Strain tuning can be used to sweep the resonant frequencythrough the cavity FSR, whereas temperature tuning is limited to a fraction <strong>of</strong> theFSR [59]. Temperature tuning is unsuitable as a st<strong>and</strong>-alone method, <strong>and</strong> the fabrication<strong>of</strong> microspheres suitable for the strain tuning apparatus is dicult. A newtype <strong>of</strong> prolate microcavity that oers potentially greater exibility in tuning themicrocavity resonance frequency has recently been described theoretically in the literature[60, 52]. Strain tuning <strong>of</strong> these bottle resonators may tune the frequency overseveral FSR, while temperature tuning over a single FSR may only require a few tens<strong>of</strong> Kelvin. Another appealing feature compared with typical spherical microcavitiesis the stronger evanescent eld at the bottle resonator surface due to the smallerresonator dimensions.The bottle resonator in Fig.2.10 is produced with similar dimensions to theone described in the theoretical work <strong>of</strong> Louyer et al. [60] <strong>and</strong> Sumetsky [52]. Theresonator has a midsection diameter <strong>of</strong> 12 m <strong>and</strong> a length <strong>of</strong> approximately 300m. Shorter bottle resonators are limited by the size <strong>of</strong> the hot-spot. Kakarantzaset al. [61] describe a bottle resonator 160 m long with a diameter <strong>of</strong> 16 m. The
49fabrication begins with tapering <strong>of</strong> the bre down to a waist diameter <strong>of</strong> 10-20 mas described already. Each micro-tapered section on either side <strong>of</strong> the resonator isproduced by pulling the taper at a speed <strong>of</strong> 10 m per second for a length <strong>of</strong> about0.2 mm while keeping the hot-spot stationary. The discrete rotation <strong>of</strong> the steppermotor shaft allows the scanning mirror to direct the beam onto exact locations, wheremicro-tapering is to take place.2.6.6 ConclusionsIn this chapter, we have described the fabrication methods used for our passive <strong>and</strong>active microspheres. Most work in this thesis deals with active spheres fabricatedfrom Er <strong>doped</strong> uoride or <strong>phosphate</strong> glasses. In addition, we have devised a simpleprocedure for producing bre tapers as coupling elements into the microspheres. Thismethod routinely produces 3-4 m diameter tapers using commercial single-modeSM980 bre.A stepper motor <strong>and</strong> gear box can be used to scan the laser beamacross the bre with sucient precision as an inexpensive alternative to the moretraditional galvanometer scanners reported for ame systems. Transmission losses <strong>of</strong>0.3 ¦ 0.2 dB at a wavelength <strong>of</strong> 980 nm are within acceptable limits <strong>of</strong> other taperingrigs described in the literature [62]. We verify our <strong>optical</strong> microscope measurements<strong>of</strong> the taper diameter with SEM imaging.This rig is <strong>of</strong> interest for applicationsinvolving microresonator coupling. The rig can also be used to produce long periodgratings [61] <strong>and</strong> fused biconical taper couplers [62]. Apart from the cost savings <strong>of</strong>such a laser-scanning rig, we have shown its exibility for producing bottle resonators.This technique involves micro-tapering a bre over a distance <strong>of</strong> about 0.2 mm <strong>and</strong>at a very slow speed. The dimensions <strong>of</strong> this new type <strong>of</strong> resonator can be precisely
50controlled. The discrete step-size <strong>of</strong> the stepper motor can be used to control thelength <strong>of</strong> the resonator with a resolution <strong>of</strong> approximately 1.7 m per half-step giventhe current rig conguration. The diameter <strong>of</strong> the bottle resonators can be as smallas 3-4 m. Installation <strong>and</strong> operation <strong>of</strong> our laser-scanning rig requires a minimumamount <strong>of</strong> skill compared with most other tapering methods. Smaller diameter tapers<strong>and</strong> shorter bottle resonators would, no doubt, be possible by rst exp<strong>and</strong>ing the CO 2beam before focusing it through the 12.5 cm lens, thereby yielding a higher powerdensity by virtue <strong>of</strong> the smaller size <strong>of</strong> the laser beam at the focus. Even thoughthe micro-furnace tapering method can achieve any reasonable diameter required formicrocavity coupling, the tapers are not adiabatic <strong>and</strong> the CO 2technique is stillrequired for bottle resonator fabrication.
51Chapter 3Ecient Upconversions in HeavyMetal Fluoride Glass: Er 3+ <strong>doped</strong>ZBLALiP3.1 Introduction 1Results on the realisation <strong>of</strong> a multicolour microspherical glass light source fabricatedfrom the erbium <strong>doped</strong> uoride glass ZBLALiP are presented in this chapter. Whisperinggallery mode lasing <strong>and</strong> upconversion processes give rise to laser <strong>and</strong> uorescentemissions at multiple wavelengths from the ultraviolet to the inf<strong>rare</strong>d. Thirteen discreteemissions ranging from 320 in the ultraviolet to 850 nm in the inf<strong>rare</strong>d have beenobserved in the upconversion spectrum. The absorption <strong>and</strong> uorescence properties,<strong>and</strong> inf<strong>rare</strong>d lasing are studied, <strong>and</strong> the processes responsible for the generation <strong>of</strong>the observed wavelengths are outlined. We report, to the best <strong>of</strong> our knowledge, therst observation <strong>of</strong> 320 nm upconversion emission following 980 nm pumping <strong>of</strong> Er 3+ .1 This chapter has appeared in \Upconversion channels in Er:ZBLALiP: a multi-colormicrospherical light source," Eur. Phys. J. Appl. Phys., 40, 181, (2007).
52In recent years, much eort has been devoted to the exploitation <strong>of</strong> upconversionmechanisms in <strong>rare</strong>-<strong>earth</strong> ion <strong>doped</strong> materials to yield a range <strong>of</strong> wavelengthsfrom near inf<strong>rare</strong>d to ultraviolet.The spectral properties <strong>of</strong> the resulting uorescence<strong>and</strong>/or lasing emissions depends on the choice <strong>of</strong> dopant <strong>and</strong> the host matrixin which it is embedded. In particular, microspheres fabricated from <strong>rare</strong>-<strong>earth</strong> ion<strong>doped</strong> materials have been shown to operate as miniature laser devices [40, 24]. Theclose proximity <strong>of</strong> numerous energy levels in triply-ionised <strong>rare</strong> <strong>earth</strong> ions is advantageousfor obtaining uorescent <strong>and</strong> lasing emissions through various upconversionmechanisms, such as excited state absorption (ESA), energy transfer upconversion(ETU), <strong>and</strong> photon avalanche (PA) [63]. This combination <strong>of</strong> active medium <strong>and</strong> resonantcavity has resulted in much research focusing on the <strong>characterisation</strong> <strong>of</strong> <strong>doped</strong>microspheres.The interest in heavy metal uoride glasses (HMFG) is due to the ultra-low absorptionlosses compared to the more traditional silica glass shown in Fig. 3.1. Fluorozirconateglasses are ideal for producing upconversion emissions due to their lowerphonon energy (600 cm 1 max.) compared with silica (1190 cm 1 max.), for example.The gure shows losses <strong>of</strong> around 0.001 dB/km at 2.6 m, whereas for silica,the losses are an order <strong>of</strong> magnitude greater. Unfortunately, ZBLAN usually suersfrom recrystallisation problems when drawn into long bres suitable for telecommunications.The vast majority <strong>of</strong> work on activated glasses found in the literature deal withbulk samples, waveguides, <strong>and</strong> to a lesser extent, microcavities. The suitability <strong>of</strong>uoride glasses as <strong>rare</strong>-<strong>earth</strong> host materials has long been known [64], as their low
53Figure 3.1: The theoretical absorption loss <strong>of</strong> ZBLAN is compared to that <strong>of</strong> experimentallyrealised bres from the visible to the near infra-red [23]. The attenuation in silica is higherby a factor <strong>of</strong> about 10 or more.phonon energies determine multiphonon relaxation rates, <strong>and</strong>, ultimately, the eciency<strong>of</strong> upconversion processes. Preliminary work on the material <strong>and</strong> IR lasingproperties <strong>of</strong> Er 3+ :ZBLALiP was presented in [24]. Here, this work is extended to amore systematic study <strong>of</strong> the upconversion processes involved in 980 nm pumping <strong>of</strong>Er 3+ :ZBLALiP microspheres.
543.2 ZBLALiP Material PropertiesWe start by briey introducing the material properties <strong>of</strong> ZBLALiP. A detailed study<strong>of</strong> some fundamental material properties <strong>of</strong> Er 3+ <strong>doped</strong> ZBLALiP (ZrF 4 -BaF 2 -LaF 3 -AlF 3 -LiF-PbF 2 ) glass has been presented in an earlier paper [24]. That work describedthe improved stability <strong>of</strong> ZBLALiP with respect to similar uorozirconate glasses<strong>and</strong> its suitability as a host for <strong>rare</strong>-<strong>earth</strong> ions. Additional material properties arepresented here, including the absorption spectrum for a 5.8 mm thick bulk sample <strong>of</strong>0.2 mol% Er 3+ :ZBLALiP (c.f. Fig. 3.2). Twelve absorption b<strong>and</strong>s are indicated inFig. 3.2(a) <strong>and</strong> represent the transitions from the ground state 4 I 15=2 ! A N withA 1 = 2 G 9=2 + 2 K 15=2 + 2 G 7=2 , A 2 = 4 G 11=2 , A 3 = 2 H 9=2 , A 4 = 4 F 3=2 , A 5 = 4 F 5=2 , A 6= 4 F 7=2 , A 7 = 2 H 11=2 , A 8 = 4 S 3=2 , A 9 = 4 F 9=2 , A 10 = 4 I 9=2 , A 11 = 4 I 11=2 , <strong>and</strong> A 12 =4I 13=2 . We use the same glass sample as described in [24]. Figure 3.2(b) shows theabsorption in the C-b<strong>and</strong>. The measured energy levels for Er 3+ is shown in Fig. 3.3<strong>and</strong> are discussed further in Section 3.5.An important parameter, especially in relation to phase matching, is the spectralvariation <strong>of</strong> the refractive index in the material. We will assume that ZBLALiP hasa similar behaviour to ZBLAN <strong>and</strong> use a Cauchy formula to estimate the wavelengthdependence such that the refractive index is [38]n s () = A 4 + B 2 + C + D 2 + E 4 ; (3.1)where the coecients are A = 1:35123 ¢ 10 5 m 4 ; B = 2:94780 ¢ 10 3 m 2 ; C =1:48965D = 1:30933 ¢ 10 3 m 2 ; <strong>and</strong> E = 3:23335 ¢ 10 6 m 4 .When lead is added to ZBLAN - as is the case with the P component in ZBLALiP- the refractive index is linearly increased across the whole spectrum. Figure 3.4 was
55(a) UV to visible absorption spectrum <strong>of</strong> ZBLALiP bulk glass.(b) C-b<strong>and</strong> absorption spectrum <strong>of</strong> ZBLALiP bulk glass.Figure 3.2: Absorption spectra for 0.2 mol% Er 3+ <strong>doped</strong> ZBLALiP bulk glass at <strong>optical</strong><strong>and</strong> IR wavelengths.
56Figure 3.3: Er 3+ energy level diagram with radiative (solid lines) <strong>and</strong> non-radiative transitionsfor a 976 nm pump. The thick, black line at 1540 nm indicates the C-b<strong>and</strong> lasingtransition.generated from Eqn. 3.1 <strong>and</strong> the measurement <strong>of</strong> the refractive index for ZBLALiP at1.5 m, 1.49, was used as an oset from the pure ZBLAN graph. It can be seen thatthe UV <strong>and</strong> violet parts <strong>of</strong> the spectrum have a rapidly increasing refractive index,which complicates phase matching at multiple wavelengths. This complication is inaddition to the spectral variation <strong>of</strong> phase matching when the simplied assumption<strong>of</strong> a constant refractive index is taken.
57Figure 3.4: Theoretical refractive index variation as a function <strong>of</strong> wavelength in ZBLALiP.3.3 Experimental DetailsThe Er 3+ :ZBLALiP microspheres studied for this work contain erbium at a concentration<strong>of</strong> 0.2 mol%, which equates to 4 ¢10 19 Er 3+ ions/cm 3 . It should be noted that,at this concentration, energy transfer (ET) is not expected to play a major role, <strong>and</strong>,as such, excited state absorption (ESA) is the dominant mechanism in the upconversionprocess [65]. Nevertheless, due to the non-trivial problem <strong>of</strong> distinguishing thetwo mechanisms, some authors have suggested that ET may play a role even whenthe dopant concentration is below the critical value <strong>of</strong> about 1 mol% [66]-[68]. Thismay be true if ion clustering is present.In our work, the C-b<strong>and</strong> lasing characteristics <strong>and</strong> upconversion spectrum areinvestigated at room temperature using a single mode 980 nm diode laser pump
58(Avanex, 1998 PLM) with a spectral width <strong>of</strong> about 1 nm under CW pumping conditions.Figure 3.5 is a schematic <strong>of</strong> the experimental setup. Up to 15 mW <strong>of</strong> power fromthe diode laser (DL) is coupled into a tapered bre. A bre coupled isolator (Agiltron,980 nm), with 1 dB insertion loss, is placed after the DL to prevent back-reectionfrom other <strong>optical</strong> components down the line.We monitor the DL power duringthe microsphere-taper alignment using the 10% line on a 10:90% coupler (Fibercom,EFAG0306207) connected to a power meter (Thorlabs).Typically, 10-15% <strong>of</strong> thepump light is coupled into the microsphere. 2A bred variable attenuator (VA - OZoptics, BB-100-11-980-61-125-S-40-3S3S-1-1) controls the power. The emissions arecollected in two ways: the scattered uorescence emissions are collected using a freespaceprobe connected to a CCD spectrometer (Ocean Optics, CCD 2000) locatedabout 1 mm from the microsphere: <strong>and</strong> the C-b<strong>and</strong> lasing is collected from the outputport <strong>of</strong> the tapered bre connected to an <strong>optical</strong> spectrum analyser (OSA - Anritsu,MS9710B). Some residual power from the pump is measurable in the C-b<strong>and</strong>, eventhough the pump wavelength is about 550 nm away from the lasing wavelength at 1.5m. A 980/1550 nm WDM is used to provide further isolation, thereby ensuring thatthe detected pump power in the C-b<strong>and</strong> remains below around 100 pW, dependingon the b<strong>and</strong>width setting on the OSA.The tapered bre is fabricated in order to eciently couple the pump into themicrosphere <strong>and</strong> eciently collect the inf<strong>rare</strong>d lasing spectrum. A 1550 nm SMF-28bre was adiabatically tapered to a diameter <strong>of</strong> 1 m using a butane ame followinga similar technique as described in Section 2.6. The transmission loss <strong>of</strong> these tapers2This measurement is rather crude as it excludes any estimation <strong>of</strong> the light scattered from thetaper-sphere coupling junction. A more accurate method would involve measuring the nonresonanttransmitted light before <strong>and</strong> after contact with the microsphere using a narrow linewidth laser.
59Figure 3.5: The experimental setup schematically represents how the microsphere is excitedwith a 980 nm diode laser (DL) <strong>and</strong> the emissions are collected. The uorescence is collectedon a CCD spectrometer, <strong>and</strong> the lasing emission is collected in an <strong>optical</strong> spectrum analyser(OSA). Legend: OI - <strong>optical</strong> isolator, VA - variable attenuator, WDM - wavelength divisionmultiplexer.is typically less than 0.1 dB/cm. Optimum mechanical alignment <strong>of</strong> the taper <strong>and</strong>microsphere is achieved by moving the microsphere to dierent locations along thetaper until the microsphere emission spectrum about 1.5 m is maximised on theOSA. This coupling eciency is, in part, due to the broad spectral nature <strong>of</strong> thepump laser relative to the whispering gallery mode resonances <strong>of</strong> the microsphere, <strong>and</strong>can be improved by the use <strong>of</strong> a narrow linewidth pump source [46]. Only when thetaper <strong>and</strong> microsphere are critically coupled is 100% coupling expected. A typicalemission spectrum is presented in Fig.3.6 <strong>and</strong> the inset shows the characteristicWGM b<strong>and</strong>s about the sphere equator.The taper-microsphere coupling is performed under a Zeiss Stemi 2000-C microscopeusing either a CCD camera (JAI, CV-S3200) or the eyepieces. Due to vibrationsin the microscope support arm, it is dicult to use a ¢50 magnication objective.
60Figure 3.6: 66 m diameter microsphere lasing spectrum about 1.5 m showing whisperinggallery mode structure. Inset: microsphere <strong>and</strong> bre taper with a green WGM. The FSRis 7.8 nm.Alternatively, we can mount the taper-microsphere coupling rig on a Nikon MM-66microscope, which oers greater mechanical stability <strong>and</strong> ne control over x-y movements<strong>of</strong> the microscope table. This setup allows us to use a ¢100 magnicationobjective, if needed, without any noticeable vibrations.3.4 McCumber AnalysisThe emission cross-section, ems , for Er 3+ :ZBLALiP around 1.5 m can be determinedfrom the absorption spectrum in Fig. 3.2. Before proceeding with the analysis, theabsorption cross-section, abs , for each <strong>of</strong> the levels must be evaluated using thefollowing expression [67] abs () =ln(A)lN Er; (3.2)
61where A is the absorbance, l is the sample thickness, <strong>and</strong> N Er is the Er 3+ concentration<strong>of</strong> 3:76 ¢ 10 19 cm3 (c.f. Fig. 3.3 for the energy level diagram). Using McCumbertheory, under the assumption <strong>of</strong> a strongly phonon coupled system [69], the emissioncross-section is given by ems () = abs () Z LZ Uexphc; (3.3)k B Twhere Z L (Z U ) is the partition P function <strong>of</strong> the lower (upper) state given by a summation<strong>of</strong> continuous levels exp ¡E i =k B T , where ¡E i is the energy dierence betweenthe Stark split sublevels <strong>and</strong> the lowest energy level in the lower (upper) manifold, his Planck's constant, c is the speed <strong>of</strong> light, k B is Boltzmann's constant, <strong>and</strong> T is thetemperature in Kelvin. From Eqn. 3.3, the bulk sample <strong>of</strong> Er 3+ :ZBLALiP has a peakemission cross-section <strong>of</strong> 4:6 ¢ 1021 cm 2 in the C-b<strong>and</strong>, which compares well with4:9 ¢ 10 21 cm 2 measured for uoroindate glasses [70] <strong>and</strong> 4:6 ¢ 10 21 cm 2 measuredin ZBLAN [71].Figure 3.7 presents the absorption <strong>and</strong> emission cross-section measurement for 0.2mol% Er 3+ :ZBLALiP in the C-b<strong>and</strong> <strong>and</strong> pump b<strong>and</strong>. The cross-sections eectivelygive the probability that an ion will absorb or emit a photon over a particular spectralregion. By a simple extension <strong>of</strong> this denition, the spectral gain coecient, G(), canbe determined in terms <strong>of</strong> the fraction <strong>of</strong> the ion population, p Er , in the metastablelevel, 4 I 13=2 , using the formulaG() = N Er [p Er ems () (1 p Er ) abs ()] : (3.4)Figure 3.8 shows that emissions from 4 I 13=2 at shorter wavelengths become possibleas the population inversion increases. For example, an emission at 1560 nm becomes
62(a) C-b<strong>and</strong>(b) Pump b<strong>and</strong>Figure 3.7: Absorption <strong>and</strong> emission cross-sections for 0.2 mol% Er 3+ <strong>doped</strong> bulk ZBLALiP.
63favourable only when the gain coecient is positive at that wavelength, which correspondsto a fraction p Er 40%. This does not mean, however, that lasing will occurbecause the lasing threshold at a particular wavelength is dependent on the Q factor<strong>of</strong> the cavity mode. Note also, the degree <strong>of</strong> population inversion is governed by thepump power.Figure 3.8: Gain coecient for dierent population inversions between the metastable 4 I 13=2<strong>and</strong> the ground level 4 I 15=2 . The percentages correspond to dierent amounts <strong>of</strong> populationinversion.3.5 Judd-Ofelt AnalysisThe absorption cross-sections can reveal several important material properties. Theprocess <strong>of</strong> analysing this data has been described in numerous papers, <strong>and</strong> is known
64as Judd-Ofelt (JO) analysis [72]-[74]. The JO intensity parameters, t , (t = 2, 4, 6),are derived from the electric-dipole contributions <strong>of</strong> the measured line strengths by aleast-squares-tting approach to minimise the rms deviation with the calculated linestrength. Throughout this work we use the JO intensity parameters, = 3:12¦0:15¢10 20 cm 2 , = 1:49¦0:07¢10 20 cm 2 , <strong>and</strong> = 1:15¦0:03¢10 20 cm 2 , as previouslycalculated in [24], since we use the same glass sample to fabricate our microspheres.These three parameters dictate all the material properties determined in this section.A spectroscopic quality factor can be dened as 4 = 6 , yielding a value <strong>of</strong> 1.30 forthe quoted intensity parameters. A higher number makes miniaturisation <strong>of</strong> deviceseasier while improving their performance.Table 3.5 compares Er 3+ :ZBLALiP toother erbium-<strong>doped</strong> glasses. The three parameters in ZBLALiP are quite similar tothe other uorozirconate glasses, as expected. In contrast, the 2 value is appreciablysmaller than in most other glasses, such as silicate, <strong>phosphate</strong>, <strong>and</strong> tellurite.Table 3.1: Comparison <strong>of</strong> Judd-Ofelt parameters for uoride <strong>and</strong> other glasses <strong>doped</strong> withEr 3+ . 2 ¢10 20 cm 2 4 ¢10 20 cm 2 6 ¢10 20 cm 2 Ref.ZBLALiP 3.12¦0.15 1.49¦0.07 1.15¦0.03 [24]ZBLAN 2.37¦0.15 1.24¦0.23 0.73¦0.16 [72]ZBLAN 2.912 1.464 1.184 [38]Al/Silicate 5.59 1.42 0.87 [75]Phosphate 4.67 1.37 0.77 [75]Tellurite 5.34 1.75 0.94 [75]A larger 2 indicates greater asymmetry <strong>of</strong> the host glass, while a larger 6 has
65a dominant inuence on the electric dipole line strength, S ed , <strong>of</strong> the lasing transition4I 13=2 ! 4 I 15=2 , as shown in the expressionS ed ¢ 4I 13=2 ! 4 I 15=2£= 0:01952 + 0:1173 4 + 1:4316 6 : (3.5)Equation 3.5 can be expressed more generally asXS ed = t jh(S; L)JjjU t jj(S 0 ; L 0 J 0 ij 2 ; (3.6)t=2;4;6where jh(S; L)JjjU t jj(S 0 ; L 0 J 0 ij 2 are the double reduced matrix elements <strong>of</strong> the unittensor operator, U, <strong>and</strong> are assumed to be independent <strong>of</strong> the host material [73].Therefore, we have taken the matrix elements from references [73, 74, 70] for ourcalculations, <strong>and</strong> these are reproduced in Table 3.5 for convenience. 3The magneticdipole line strengths are calculated fromS md = 14m 2 c 2 jh(S; L)JjjL + 2Sjj(S0 ; L 0 )J 0 ij 2 ; (3.7)where jh(S; L)JjjL + 2Sjj(S 0 ; L 0 )J 0 ij 2 are the double reduced matrix elements <strong>of</strong> theL + 2S operator, where L is the total orbital angular momentum <strong>and</strong> S is the totalspin.The data yielded from Eqns. 3.2, 3.6, <strong>and</strong> 3.7 combined with the JO intensityparameters, are used to calculate important radiative properties, such as the spontaneousradiative transition rates, electric dipole line strengths, branching ratios, <strong>and</strong>radiative lifetimes.3There are few complete tables <strong>of</strong> reduced matrix elements in the literature for transitions up to35¢10 3 cm 1 because researchers normally only observe emissions from transitions below 28¢10 3cm 1 . In addition, it is dicult <strong>and</strong> time-consuming to perform these calculations for U. Just priorto completing my thesis, I became aware <strong>of</strong> a thesis by Casprary [38] that gives a full table <strong>of</strong> matrixelements for transitions up to 97¢10 3 cm 1 with Er 3+ <strong>and</strong> other dopants in ZBLAN.
66The total spontaneous radiative transition rate between level J <strong>and</strong> a lower levelJ 0 is given byA JJ0= A edJJ + Amd0 JJ = 64 403h 3 (2J + 1) edS ed + md S md¡ ; (3.8)where is the mean wavelength <strong>of</strong> the absorption, ed = p(p 2 + 2) 2 =9 is the localeld correction factor for electric dipole transitions, <strong>and</strong> md = p 3 is the local eldcorrection factor for magnetic dipole transitions. In this work, A JJ0 is calculated usingthe values given by Carnall et al. [74] for LaF 3 (A 0 JJ 0) corrected for the refractive indexdierence using the relation A JJ0= (p=p 0 ) 3 A 0 JJ 0, where p0 (p) is the refractive index <strong>of</strong>LaF 3 (ZBLALiP). The refractive index for ZBLALiP is 1.49 at 1.5 m, while that forLaF 3 is 1.57. Using the relation given in Eqn. 3.1, we can approximate the refractiveindex at other wavelengths also.The radiative lifetime, R , <strong>of</strong> transitions between levels J <strong>and</strong> J 0 is related to theinverse <strong>of</strong> A JJ0by R =1P ; (3.9)JA 0 JJ0<strong>and</strong> the branching ratio, , between J <strong>and</strong> J 0 is simply the ratio <strong>of</strong> A JJ0 for the initiallevel to the sum <strong>of</strong> A JJ0for all the lower levels given by = A JJ 0 R : (3.10)Table 3.5 shows the radiative probabilities, electric dipole line strengths, branchingratios, <strong>and</strong> radiative lifetimes for the transitions. Several levels have high branchingratios for transitions to the ground level <strong>and</strong> intermediate levels, many <strong>of</strong> which havebeen observed in the emission spectrum shown in Fig. 3.9.
67Table 3.2: Predicted radiative transition probabilities, A JJ 0, electric dipole line strengths, A edJJ 0,branching ratios, , <strong>and</strong> radiative lifetimes, R , <strong>of</strong> Er 3+ :ZBLALiP. The wavelength calc is thebaricenter <strong>of</strong> the absorption b<strong>and</strong>s.Table 3.2Transition Label calc¢U(2) £ 2 ¢U(4) £ 2 ¢U(6) £ 2A edJJ 0A mdJJ 0S ed (¢10 20 R (ms)(nm)(s 1 )(s 1 )cm 3 )4 I 13=2 ! 4 I 15=2 1519 0.0195 0.1173 1.4316 78 32 18.8 1.00 9.104 I 11=2 ! 4 I 15=2 975 0.0282 0.0003 0.3953 98 5.4 0.84 8.57! 4 I 13=2 2727 0.0210 0.1100 1.0400 12 7 1.43 0.164 I 9=2 ! 4 I 15=2 T12 799 0.0000 0.1733 0.0099 106 2.7 0.77 7.18! 4 I 13=2 1668 0.0003 0.0081 0.6400 32 7.5 0.22! 4 I 11=2 4663 0.0030 0.0674 0.1271 1 1 2.6 0.014 F 9=2 ! 4 I 15=2 T10 656 0.0000 0.5354 0.4618 928 13.3 0.89 0.96! 4 I 13=2 1025 0.0096 0.1576 0.0870 67 3.6 0.06! 4 I 11=2 1966 0.0671 0.0088 1.2611 44 5 16.7 0.05! 4 I 9=2 3623 0.0960 0.0061 0.0120 1 2 3.2 0.004 S 3=2 ! 4 I 15=2 T8 540 0.0000 0.0000 0.2211 700 2.5 0.66 0.95! 4 I 13=2 T13 849 0.0000 0.0000 0.3481 294 4.0 0.28! 4 I 11=2 1212 0.0000 0.0037 0.0789 24 1.0 0.02! 4 I 9=2 1688 0.0000 0.0729 0.2560 36 4.0 0.042 H 11=2 ! 4 I 15=2 T7 520 0.7056 0.4109 0.0870 3453 29.1 0.96 0.27! 4 I 13=2 792 0.0230 0.0611 0.0527 75 54 2.2 0.02! 4 I 11=2 1115 0.0357 0.1382 0.0371 43 81 3.6 0.02! 4 I 9=2 1507 0.2077 0.0662 0.2858 53 0 10.8 0.00! 4 F 9=2 2579 0.3629 0.0224 0.0022 11 0 11.7 0.004 F 7=2 ! 4 I 15=2 T6 487 0.0000 0.1467 0.6273 1964 9.4 0.78 0.40! 4 I 13=2 727 0.0000 0.3371 0.0001 316 5.0 0.13! 4 I 11=2 983 0.0035 0.2648 0.1515 147 5.8 0.06! 4 I 9=2 1245 0.0163 0.0954 0.4277 86 6.8 0.03! 4 F 9=2 1947 0.0121 0.0342 0.0151 4 1.1 0.00Continued on next page
68Table 3.2: Predicted radiative transition probabilities, A JJ 0, electric dipole line strengths, A edJJ 0,branching ratios, , <strong>and</strong> radiative lifetimes, R , <strong>of</strong> Er 3+ :ZBLALiP. The wavelength calc is thebaricenter <strong>of</strong> the absorption b<strong>and</strong>s.Table 3.2Transition Label calc¢U(2) £ 2 ¢U(4) £ 2 ¢U(6) £ 2A edJJ 0A mdJJ 0S ed (¢10 20 R (ms)(nm)(s 1 )(s 1 )cm 3 )Continued from previous page4 F 5=2 ! 4 I 15=2 450 0.0000 0.0000 0.2237 873 2.6 1.00 1.154 F 3=2 ! 4 I 15=2 443 0.0000 0.0000 0.1204 690 1.4 1.00 1.442 H 9=2 ! 4 I 15=2 T3 406 0.0000 0.0190 0.2255 850 2.9 0.34 0.40! 4 I 13=2 556 0.0780 0.1194 0.3535 953 8.3 0.38! 4 I 11=2 T11 697 0.0428 0.0824 0.1128 226 31 3.9 0.10! 4 I 9=2 823 0.0147 0.0062 0.0043 21 1 0.6 0.01! 4 F 9=2 1079 0.0055 0.0314 0.0369 184 36 1.1 0.09! 2 H 11=2 1854 0.0308 0.1828 0.0671 152 1 4.5 0.06! 4 F 7=2 2485 0.1058 0.0488 0.0240 61 1 4.3 0.024 G 11=2 ! 4 I 15=2 T2 378 0.9178 0.5271 0.1197 11752 37.9 0.83 0.07! 4 I 13=2 505 0.1011 0.2642 0.2550 1300 38 10.0 0.10! 4 I 11=2 618 0.0002 0.4930 0.0144 527 0 7.5 0.04! 4 I 9=2 724 0.0645 0.0117 0.0467 120 1 2.7 0.01! 4 F 9=2 905 0.4436 0.0388 0.0104 328 3 14.5 0.02! 2 H 11=2 1394 0.0006 0.1600 0.1100 10 3.7 0.002 G 9=2 ! 4 I 15=2 365 0.0000 0.2416 0.1235 2034 5.0 1.00 0.492 G 7=2 ! 4 I 15=2 358 0.0000 0.0174 0.1163 839 1.6 1.00 1.132 P 3=2 ! 4 I 15=2 T1 320 0.0000 0.0000 0.0260 403 0.3 0.12 0.31! 4 I 13=2 T4 397 0.0000 0.0000 0.1600 1242 1.8 0.38! 4 I 11=2 T5 470 0.0000 0.1300 0.0250 936 2.2 0.29! 4 I 9=2 524 0.0000 0.0440 0.0092 230 0.8 0.07! 4 F 9=2 T9 616 0.0000 0.0560 0.0045 164 0.9 0.05! 4 S 3=2 763 0.0847 0.0000 0.0000 259 2.6 0.092 K 13=2 ! 4 I 15=2 302 0.0032 0.0029 0.0152 167 0.3 1.00 5.99
693.6 Upconversion Fluorescence <strong>and</strong> 1.5 m LasingFigure 3.3 shows an energy level diagram for Er 3+ indicating the radiative <strong>and</strong> nonradiativetransitions that are responsible for the thirteen emissions observed in Fig.3.9. The upconversion spectrum is recorded coincidentally to the C-b<strong>and</strong> lasing spectrum(c.f. Fig. 3.6). Thirteen discrete peaks have been noted in the scatteringspectrum <strong>and</strong> are numbered from T1-T13 along with their centre wavelengths. Approximately700 W <strong>of</strong> 980 nm pump light was coupled into the microsphere. Thetotal power <strong>of</strong> the scattered light outcoupled to the spectrometer is a few nW for thegreen transitions (T7 <strong>and</strong> T8).The limited resolution <strong>of</strong> the spectrometer used to study the upconversion, combinedwith the smaller microsphere FSR at shorter wavelengths, means that the whisperinggallery mode structure is only visible for emissions at wavelengths longer thanabout 800 nm. The mode structure for the 849 nm (T13) emission is distinguishablein the inset <strong>of</strong> Fig. 3.9.Our results demonstrate a broad range <strong>of</strong> emission from 320 nm to 849 nm in additionto the C-b<strong>and</strong> lasing. We suggest that the combination <strong>of</strong> high cavity qualityfactor - typically 1 ¢ 10 7 , measured at 780 nm - <strong>and</strong> low whispering gallery modevolume - approximately 1,000-2,000 m 3 - serves to signicantly enhance the probability<strong>of</strong> excited state absorption by enhancing the pump eld strength ( 10 3 V/mper photon) within the microsphere. This is reected in the fact that a large number<strong>of</strong> the observed transitions are likely the result <strong>of</strong> 3-photon <strong>and</strong> 4-photon absorptionevents for what is a relatively modest pump power (sub mW) coupled into themicrosphere.Even though it is energetically possible for several emissions to originate from the
70Figure 3.9: Observed Er 3+ :ZBLALiP microsphere upconversion spectrum for 976 nm pumping.Inset: whispering gallery mode structure about T13 with a FSR <strong>of</strong> 2.3 nm.same level, the branching ratios predicted in the JO theory can help determine themost likely emissions from a particular level. For example, it is energetically possiblefor both the 383 nm <strong>and</strong> 616 nm emissions to originate from radiative decay from the4G 11=2 level to lower levels. However, the ratio <strong>of</strong> the measured emission intensities,1:3, disagrees substantially from the calculated ratios, 1:22, thereby indicating thatboth emissions cannot arise from the 4 G 11=2 level.In fact, the 618 nm emission is due to the 2 P 3=2 ! 4 F 9=2 decay. In this way, we can
71use a combination <strong>of</strong> the energy gaps between the energy levels <strong>and</strong> the calculatedbranching ratios to determine what levels are involved in the radiative emissions.Four emissions in Fig. 3.9 (618 nm, 470 nm, 403 nm <strong>and</strong> 320 nm) are attributed tothe transitions 2 P 3=2 ! 4 F 9=2 (= 0.05), 2 P 3=2 ! 4 I 11=2 (= 0.29), 2 P 3=2 ! 4 I 13=2 (=0.39), <strong>and</strong> 2 P 3=2 ! 4 I 15=2 ( = 0.12) respectively. The branching ratio calculationspredict the ratio <strong>of</strong> emission intensities for each <strong>of</strong> the levels to be 1 (616 nm):5.8(470 nm):7.8 (403 nm), which is in reasonable agreement with the measured ratios <strong>of</strong>1:5.3:6.6. We have excluded the emission intensity <strong>of</strong> the 320 nm emission from thiscomparison, because uorozirconate glasses have very substantial absorption losses inthe UV region [76].The 4 F 3;5=2 levels in Er 3+ :ZBLALiP have unusually long radiative lifetimes <strong>of</strong> 1.45ms <strong>and</strong> 1.15 ms compared to other glasses, such as Er 3+<strong>doped</strong> uoroindate glass,which has a lifetime <strong>of</strong> 0.50 ms [77]. As can be seen from the energy level diagram, thisis critically important for the UV <strong>and</strong> violet emissions from the 2 P 3=2 level because itfacilitates the third ESA, 4 F 3;5=2 ! 2 K 13=2 , by maintaining a large 4 F 3;5=2 population.This is in sharp contrast to Er 3+ <strong>doped</strong> uoroindate glass, where nonradiative decayrapidly depletes the 4 F 3;5=2 population, eectively preventing any further ESA.The emission line centred at 320 nm (T1) is most likely a 4-photon process populatingthe 2 P 3=2 state, which in turn radiatively relaxes to the 4 I 15=2 ground state.Three pump photons populate the 2 G 7=2 state. The 2 G 7=2 - 2 P 3=2 energy gap <strong>of</strong> 3600cm 1 , combined with a phonon energy <strong>of</strong> 600 cm 1 , is such that the 2 P 3=2 state is unlikelyto be populated by thermalisation, <strong>and</strong>, as such, we suggest that the absorption<strong>of</strong> a fourth pump photon is necessary to explain T1. This transition has previouslybeen reported in Er-<strong>doped</strong> glass, but was identied as a 3-photon process following
72pumping at 637 nm [77]. The same authors also reported emissions correspondingto the transitions T4, T5, <strong>and</strong> T8. Transition T1 has also been reported [78] in aEr 3+ :Yb 3+ co-<strong>doped</strong> material, although, in that case, the excitation process involvedsuccessive energy transfers from Yb 3+ . It should be noted that this is very dierentfrom our work, which involves a single dopant, does not rely on a sensitiser ion, <strong>and</strong>ETU probably does not play a major role due to the low dopant concentration.The transitions 2 P 3=2 ! 4 I 13=2 (T4) <strong>and</strong> 2 P 3=2 ! 4 I 11=2 (T5) are also thoughtto involve 4-photon excitations. Transitions T1, T4, <strong>and</strong> T5 have previously beenobserved following pumping at 545 nm [79]. Transitions T7, T8, T10, <strong>and</strong> T13 havebeen reported following 980 nm pumping [80]. The ultraviolet line at 383 nm (T2)<strong>and</strong> the 492 nm emission (T6) have been reported under 973 nm excitation [81].The Er 3+ emission at 700 nm has been attributed to the transition 4 F 7=2 ! 4 I 13=2following absorption <strong>of</strong> three pump photons at 1480 nm in reference [82]. We presumethis assignment was on the basis <strong>of</strong> the 3-photon resonance 4 F 7=2 ! 4 I 15=2 . We havealso observed emission about 700 nm (T11) but propose it to follow the transition2H 9=2 ! 4 I 11=2 , based on the observed intensity ratio compared with the branchingratios calculated from JO theory.Finally, we have observed emissions centred at618 nm (T8) <strong>and</strong> 667 nm (T10). We are currently unaware <strong>of</strong> other reports on suchemissions from Er 3+ .3.7 Radiative <strong>and</strong> Multi-phonon DecayFluorozirconate glass, with its low phonon energies, has a comparatively high probability<strong>of</strong> radiative decay to lower levels. This probability is dependent on the energygap, E, between levels J <strong>and</strong> the lower level J 0 . For most energy levels, multi-phonon
73decay is dominant, except for the case <strong>of</strong> the nine radiating levels identied in theenergy level diagram. The rate <strong>of</strong> multi-phonon decay, A mp , scales exponentially withthe number <strong>of</strong> phonons, P , required to bridge the energy gap, ¡E. In general, thisrate is an increasing function <strong>of</strong> temperature, governed by Bose-Einstein statistics,<strong>and</strong> is given by [38]A mp (T ) = C exp( [¡E 2:6~! max ]) [1 exp( ~! max =k B T )]P ; (3.11)where P = ¡E=~! max , ~! max is the maximum phonon energy, which is assumedto be the same as in ZBLAN, i.e. 600 cm1 , <strong>and</strong> C <strong>and</strong> are material dependentconstants. 4Using Eqn. 3.11 <strong>and</strong> the radiative transition rates calculated in Table3.5, the fraction <strong>of</strong> the ion population undergoing radiative decay can be determined.Figure 3.10 shows the estimated fraction for each <strong>of</strong> the 13 observed emissions plustwo weaker emissions at 556 nm <strong>and</strong> 520 nm.The gure bears considerable resemblance to the uorescence spectrum in terms<strong>of</strong> the relative amplitude <strong>of</strong> the emissions resulting from each ESA. The two otheremissions at 556 nm ( 2 H 9=2 ! 4 I 13=2 ) <strong>and</strong> 520 nm ( 2 P 3=2 ! 4 I 9=2 ) predicted by theJO theory, are overwhelmed by the strong green emissions in Fig. 3.10 <strong>and</strong> are notobserved as a result; consider, for example, the missing transition between 4 F 9=2 <strong>and</strong>4I 11=2 in the energy level diagram corresponding to a weak 520 nm emission.The dominance <strong>of</strong> the IR lasing transition is conrmed in Fig. 3.10. Even thoughthe fraction <strong>of</strong> ions contributing to radiative upconversion emissions is at least a factor<strong>of</strong> ten smaller than the metastable 4 I 13=2 level, the calculation predicts they should stillbe observable for energies up to 32 ¢10 3 cm1 , in support <strong>of</strong> the measurements in Fig.4The model can only serve as an approximation as it excludes any mention <strong>of</strong> the spectral nature<strong>of</strong> the phonons <strong>and</strong> the Stark energy levels.
74Figure 3.10: Calculated fraction <strong>of</strong> radiative decay, A= P A, for the observed emissions.The parameters C <strong>and</strong> are 1:99 ¢ 10 5 s 1 <strong>and</strong> 2:11 ¢ 10 3 cm respectively, taken forZBLAN at 300 K [38]. The fraction for 4 I 13=2 ! 4 I 15=2 at 1.5 m is 0.93 (not shown).3.9. The low value for 2 H 11=2 at 520 nm is counter-balanced by rapid thermalisation<strong>of</strong> the level by 4 S 3=2 at 540 nm.3.8 Power-law UpconversionsFurther underst<strong>and</strong>ing <strong>of</strong> the upconversion (<strong>and</strong> downconversion) dynamics can beobtained by studying the intensity dependence <strong>of</strong> the uorescence at a particularwavelength. The intensity <strong>of</strong> an upconversion uorescence is related to the sequentialabsorption <strong>of</strong> q pump photons.Two possible outcomes can arise: (i) In the vastmajority <strong>of</strong> glasses, the relationship between the pumping <strong>and</strong> emission intensities, I,tends to show a I signal / I q pump relationship where upconversion rates are insignicant,<strong>and</strong> (ii) in some cases, the presence <strong>of</strong> strong upconversion modies the power law so
75that uorescence slopes less than q are observed. Measurements <strong>of</strong> this dependencefor the case <strong>of</strong> six upconversion emissions are presented in Fig.3.11, where thesignal intensity was determined for increasing powers as an LL (light in - light out)logarithmic plot.Case (ii) is sometimes regarded as undesirable as it hinders the identication <strong>of</strong>the levels from which emissions originate. The rate equation analysis performed in[83] describes how to relate the slope <strong>of</strong> the uorescence emission LL plot from arbitraryenergy levels to the possible upconversion mechanisms. Given the low dopantconcentration <strong>of</strong> 0.2 mol% Er 3+in our glass sample, ETU can be assumed to benegligible, <strong>and</strong> the dominant mechanism is ESA. 5Figure 3.11 shows linear slopes on a log-log scale with values ranging from 0.78 to1.10. Strong upconversion rates explain the departure from the power law prediction[83]. For slopes close to 1, which is due to the I i=q dependence <strong>of</strong> level i, the inuence<strong>of</strong> upconversion is large, with ESA being the dominant upconversion mechanism. Thepredominant decay route is to the next lowest level, <strong>and</strong> the fraction <strong>of</strong> pump powerabsorbed is large. The data for T2 at 383 nm is comparable with the backgroundnoise, which results in a large error in the slope <strong>of</strong> 0:78 ¦ 0:15.The proceeding sections have shown qualitatively that Er 3+ :ZBLALiP has a highupconversion rate, which indicates that the power law relationship relaxes to I signal /I 1 pump <strong>and</strong> less, for levels that are populated through multi-phonon relaxations. Furthermore,this power dependence relies on whether ETU or ESA is dominant [83].5ETU processes cannot be strictly rejected because <strong>of</strong> the possibility <strong>of</strong> clustering <strong>of</strong> ions. Sucheects have a sixth power dependence on the inter-ion separation (c.f. Section 4.3.1 for a morethorough discussion <strong>of</strong> ETU in IOG-2 glass). In the case where only ETU is present, the uorescenceslope changes from Ipump q to Ipump 1 for lower pump powers. For isolated ions, the uorescence slopewill be linear for all pump powers.
76Figure 3.11: Light in-Light out logarithmic graph for the uorescence emissions. All emissionsshow a slope <strong>of</strong> approximately 1. Note the lines are an aid for the eye.The issue governing the observed uorescence is an interplay between the linear decay<strong>and</strong> upconversion; for increasing pump power, the upconversion rate changes fromI q pump to I 1 pump, while the GSA rate changes from I 1 pump to < I 1 pump.3.9 Microsphere Characterisation3.9.1 EccentricitySuccessful excitation <strong>of</strong> the 4 I 13=2 ! 4 I 15=2 transition results in whispering gallerymode lasing resonances within the microsphere, as shown in Fig. 3.6. The gureshows a typical lasing spectrum, in addition to four other modes, obtained for a 70m diameter sphere.As already outlined in Section 1.3, the number n gives thenumber <strong>of</strong> radial modes, <strong>and</strong> modes with increasing value <strong>of</strong> n have lower l <strong>and</strong>
77longer resonance wavelength. In a perfect sphere, with l = jmj, these polar modes aredegenerate. For practical microspheres this degeneracy is lifted because there will besome small degree <strong>of</strong> eccentricity; the microsphere will be either slightly prolate oroblate. The wavelength separation between the modes is proportional to the degree <strong>of</strong>deformation, <strong>and</strong> is given by ¡ ( 2 =2)(¡a)=(a 2 ). The microsphere eccentricityis determined from" =¡!ecc¡! nml l2jmj1; (3.12)2where l <strong>and</strong> m are the angular mode numbers, <strong>and</strong> ! nml is the angular frequency <strong>of</strong>the mode. This is calculated to be 2:1% for the corresponding azimuthal modesplitting, ¡! ecc , <strong>of</strong> 11 GHz. Analysis <strong>of</strong> the lasing peaks enables us to measurethe free spectral range, F SR , between successive mode groups with a dierence inangular mode number l <strong>of</strong> 1, to be 7:8 nm (0.97 THz).Theoretically, we c<strong>and</strong>etermine the diameter <strong>of</strong> the sphere from D = c=n s F SR , where c is the speed <strong>of</strong>light in a vacuum, <strong>and</strong> n s is the refractive index <strong>of</strong> the material. Using n s = 1.49 at1.5 m, we nd that the FSR = 7.8 nm indicates a microsphere diameter <strong>of</strong> 66 m,which is reasonably close to the (70 ¦ 2) m determined using an <strong>optical</strong> microscope.The peak power <strong>of</strong> the lasing peaks presented here is 30 nW, although we havealso observed lasing in a single mode with a peak value <strong>of</strong> 500 nW. The spacingbetween TE <strong>and</strong> TM modes ( T ET M ) <strong>of</strong> 6.8 nm agrees well with the calculated value<strong>of</strong> 6.4 nm.A rough estimate <strong>of</strong> the quality factor at the signal wavelength, Q signal , can beobtained by determining the ratio <strong>of</strong> resonance wavelength at 1.5 m to peak FWHM,yielding a value typically higher than 5 ¢ 10 4 , limited by the spectral resolution <strong>of</strong>the OSA. Even with an accurate measurement <strong>of</strong> Q signal this cannot be regarded as
78representing the Q <strong>of</strong> the cavity. This is obvious when you consider that the denition<strong>of</strong> Q relies on the energy stored in the mode, which, in the case <strong>of</strong> a <strong>doped</strong> cavity, isproportional to the dopant concentration. At the lasing threshold, the Q signal valueapproaches innity! The next section describes how to measure the cavity Q value ata pump wavelength <strong>of</strong> 780 nm.3.9.2 Quality Factor MeasurementThe Q factor was measured using a commercial, tuneable narrow linewidth (SacherLasertechnik, Tiger TEC-300-0780-0750, 100 kHz linewidth with 750 mW power)laser at 780 nm <strong>and</strong> saturable absorption spectroscopy <strong>of</strong> Rb atoms. Figure 3.12 showsthe experimental setup. Several hundred mW is passed through the polarising beamsplitter to the Rb cell, <strong>and</strong> the remainder ( 100 mW) is sent to a GRIN lens brecoupler (OZ Optics, LPC-03-780-5/125-S-0.72-2.6GR-25-X-3-1.5). The light coupledinto the bre is evanescently coupled into a microsphere <strong>and</strong> the light transmittedpast the taper-microsphere coupling junction is detected on a photodiode (PD2). Thelight sent through the Rb cell only saturates the Rb atoms on the reected pass afterwhich another photodiode (PD1) detects the absorption peaks for both 85 Rb <strong>and</strong> 87 Rbisotopes. A function generator scans the laser frequency via the piezo element in theexternal cavity <strong>of</strong> the laser. It is important to ensure the <strong>optical</strong> table is vibrationallyisolated because the microsphere cavity resonance becomes very unstable otherwise.The isotope 87 Rb has crossover peaks for F = 2 ! F = 3 0 <strong>and</strong> F = 1 ! F = 3 0 ,separated by 78.5 MHz. One can also measure the crossover peaks for 85 Rb which areF = 2 ! F 0 = 4 <strong>and</strong> F = 3 ! F 0 = 4, separated by 31.5 MHz. These peaks providethe frequency scale on the x-axis <strong>of</strong> the oscilloscope. A single cavity resonance dip
79Figure 3.12: Experimental setup to perform Q factor measurement. Legend - PBS: polarisingbeam splitter, QWP: quarter wave plate, PD: photodiode. The black dotted lineindicates electronic data/control signals.is shown in the upper trace <strong>of</strong> Fig.3.13 with a linewidth <strong>of</strong> 39 MHz at FWHM,corresponding to a Q factor <strong>of</strong> 1 ¢ 10 7 at 780 nm. Up to 17% <strong>of</strong> the light is coupledinto the microsphere when in the on-resonance position.3.10 ConclusionsIn conclusion, a multiwavelength microsphere light source is demonstrated with possiblemicrophotonic applications. The Er 3+ transitions involved in the thirteen upconversionemissions have been identied with the aid <strong>of</strong> JO analysis. This devicecould nd many uses as a miniature multicolour light source with, for example, applicationto evanescent wave sensing based on excitation <strong>of</strong> transitions in target moleculesadsorbed on to the microsphere surface. Our results for the violet emissions
80Figure 3.13: Quality factor measurement.The upper trace represents the transmissionpast the taper-sphere coupling junction. The lower trace is the Rb saturation absorptionmeasurement used to calibrate the x-axis in terms <strong>of</strong> frequency.
81in Er 3+ :ZBLALiP indicate an attractive alternative to Er 3+ :ZBLAN for informationstorageapplications, where even very small powers are sucient for data retrievaloperations [77]. Future work will need to focus on improving the outcoupling eciency<strong>of</strong> the device using waveguide technology for integrated optics [84].
82Chapter 4Thermally Induced OpticalBistability in Er 3+ :Yb 3+ Co-<strong>doped</strong>Phosphate Glass4.1 Introduction 1The presence <strong>of</strong> <strong>optical</strong> bistability in <strong>doped</strong> glasses <strong>and</strong> crystals holds promise fortelecommunications <strong>and</strong> <strong>optical</strong> computing applications. A miniature bistable lasersource would be ideal for microchip integration, especially if it can be mounted witha waveguide such as a stripline pedestal anti-resonant reecting <strong>optical</strong> waveguide(SPARROW) [85].We experimentally demonstrate <strong>optical</strong> bistability in Er 3+ :Yb 3+ <strong>phosphate</strong> glassmicrospheres at 295 K. Bistability is associated with both Er 3+ uorescence <strong>and</strong> lasingbehaviour, <strong>and</strong> wavelength/chromatic behaviour.The chromatic switching resultsfrom an intrinsic mechanism exploiting the thermal coupling <strong>of</strong> closely-spaced energylevels, <strong>and</strong> occurs simultaneously with the intensity switching. A contrast ratio, as1 This chapter has appeared in \Optical Bistability in Er-Yb co-<strong>doped</strong> <strong>phosphate</strong>glass microspheres at room temperature," J. Appl. Phys., 102, 023104, (2007).
83measured as the ratio between upper <strong>and</strong> lower switching positions, <strong>of</strong> 2.8 has beenobtained for chromatic switching. The intensity switching shows ratios <strong>of</strong> 2.9 <strong>and</strong> 4.6for the two green uorescence emissions at 520 nm <strong>and</strong> 550 nm respectively, 3.1 forthe red uorescence emission at 660 nm, <strong>and</strong> 4.7 for the IR lasing at 1.5 m. Theinuences <strong>of</strong> the host matrix on lasing <strong>and</strong> uorescence mechanisms are highlighted.A system is said to exhibit bistability when there are two possible output statesfor the same input state <strong>and</strong> the choice <strong>of</strong> output state depends on the history <strong>of</strong> theinput.4.2 Er 3+ :Yb 3+ Co-doping <strong>of</strong> Phosphate GlassIn our work, an Er 3+ :Yb 3+co-<strong>doped</strong> <strong>phosphate</strong> glass (Schott IOG-2) was used todemonstrate chromatic <strong>and</strong> intensity <strong>optical</strong> bistability (OB) simultaneously.Theglass is <strong>doped</strong> with 2 wt% Er 2 O 3 (1:7 ¢ 10 20 ions/cm 3 ) <strong>and</strong> co-<strong>doped</strong> with 3 wt%Yb 2 O 3 (2:5 ¢ 10 20 ions/cm 3 ). The concept <strong>of</strong> an Er 3+ :Yb 3+ co-<strong>doped</strong> glass laserwas demonstrated [86] in 1965 as a means <strong>of</strong> optimising the Er 3+emission crosssection,while simultaneously ensuring an optimum Yb 3+absorption cross-section.This overlap alleviates the diculty <strong>of</strong> trying to directly pump the narrow Er 3+absorption b<strong>and</strong> [87]. Phosphate glass has been investigated as a host matrix for <strong>rare</strong><strong>earth</strong>ions due to its favourable properties, such as: (i) the possibility <strong>of</strong> obtaininglarge dopant concentrations (up to 1:8¢10 21 ions/cm 3 for Yb 3+ , <strong>and</strong> 10 19 ions/cm 3for Er 3+ ) compared to silicate, borate, <strong>and</strong> uoride glasses, (ii) its large absorptionb<strong>and</strong> in the near-inf<strong>rare</strong>d region, (iii) its large emission cross-section at 1.5 m, <strong>and</strong>(iv) the low back energy transfer from Er 3+ ions to Yb 3+ ions [88]-[90].The energy level diagram is shown in Fig. 4.1. The spectral characteristics are also
84especially benecial for C-b<strong>and</strong> lasing; the intermediate lasing level, 4 I 11=2 , has a highnon-radiative relaxation rate (< 1 s lifetime, maximum phonon energy <strong>of</strong> 1300 cm 1 )to the 4 I 13=2 level compared with silica (maximum phonon energy <strong>of</strong> 1190 cm1 ), <strong>and</strong>the long lifetime <strong>of</strong> the 4 I 13=2 level <strong>of</strong> about 8.45 ms facilitates population inversion<strong>and</strong> high gain [91]. The larger phonon energy <strong>of</strong> <strong>phosphate</strong> glass has a negative eecton the upconversion eciency compared to uoride glass (with a maximum phononenergy <strong>of</strong> 600 cm1 ). This, however, is partially counter-balanced by the large dopantconcentrations <strong>and</strong> wide absorption cross-section <strong>of</strong> the Yb 3+ sensitiser. In addition,<strong>phosphate</strong> glass has better optomechanical properties compared to other glasses usedfor OB, such as CsCdBr 3 . 2Here, we present experimental OB results on lasing around 1.5 m <strong>and</strong> proposesuitable upconversion mechanisms for the observed three colour emission b<strong>and</strong>s.4.3 Experimental DetailsWe study lasing <strong>and</strong> upconversion uorescent emissions following CW pumping witha tunable 980 nm laser diode (spectral width 1 nm) identical to the one describedin Section 3.3. IOG-2 glass, with a low glass transition temperature <strong>of</strong> around 648 K[92], is ideal for producing microspheres with diameters <strong>of</strong> between 30-70 m using amicrowave plasma torch [93] as described in Chapter 1. A detailed description <strong>of</strong> theexperimental setup is identical to that in Chapter 3, except for the fact that a dierentactive material is used for the microspheres. Microsphere coupling is again done witha 1 m diameter, 1550 nm SMF-28 bre. The lasing emissions around 1.5 m are2It must be noted here that CsCdBr 3 , <strong>and</strong> other materials, are <strong>of</strong> interest for their ability to showintrinsic bistability, in contrast to the extrinsic, self-induced bistability described in the present work.
85Figure 4.1: Energy level diagram <strong>and</strong> uorescence mechanisms with radiative (solid lines)<strong>and</strong> non-radiative transitions (wiggly lines).monitored by connecting one end <strong>of</strong> the bre taper to an OSA. All upconversionuorescence spectra were acquired by free space coupling into an Ocean Optics 2000CCD spectrometer.4.3.1 Lasing <strong>and</strong> Fluorescence in IOG-2In our rst experiments, the 980 nm pump power was set to a constant value <strong>of</strong>about 10 mW. There is a clear dierence in the visible emission spectra (c.f. Fig.4.2) obtained for the two sphere depending on the presence <strong>of</strong> 1.5 m lasing. We
86note three distinct emission b<strong>and</strong>s corresponding to erbium transitions at 520 nm( 2 H 11=2 ! 4 I 15=2 ), 550 nm ( 4 S 3=2 ! 4 I 15=2 ), <strong>and</strong> 660 nm ( 4 F 9=2 ! 4 I 15=2 ). Thered emission is stronger than red emissions produced in other singly <strong>doped</strong> glassesinvestigated in our laboratory, such as Er 3+ :ZBLALiP <strong>and</strong> Er 3+ :ZBNA, due to themuch larger Yb 3+ absorption cross-section compared to Er 3+ .Note that, on occasion, we have also observed a very weak, but distinct fourthemission b<strong>and</strong> in the UV corresponding to an erbium transition at 405 nm ( 2 H 9=2 ! 4I 15=2 ).Figure 4.2(b) shows a uorescence spectrum representing the violet to redupconversions for a xed pump power <strong>of</strong> 8 mW <strong>and</strong> a 35 m sphere. Such violetemissions are only observed in spheres that do not lase around 1.5 m due to acompetition between processes involved .The ESA from 4 I 13=2 feeding the 4 F 9=2 level depletes the intermediate 4 I 11=2 level<strong>and</strong> the metastable 4 I 13=2 level, thereby placing the 1.5 m emission in competitionwith the red emission <strong>and</strong> the other upconversion processes. This process is shownin the energy level diagram in Fig. 4.1. We nd that the power <strong>of</strong> the red emissionis, typically, twice as high in microspheres that exhibit no lasing (due to excessiveinhomogeneities in the cavity) compared to those that do exhibit lasing.For ions excited to the 2 F 5=2 level in Yb 3+ , IOG-2 has a quantum defect, defect = pump = signal , <strong>of</strong> about 60%, resulting in the remaining 40% being dissipated in thehost matrix as heat.This statement can be taken further by noting that energytransfer from Yb 3+ to Er 3+ depends on three parameters: the energy migration rateamong the Yb 3+ ions (which depends on the inter-ion separation as discussed laterin this section), the back transfer rate from Er 3+to Yb 3+ , <strong>and</strong> the multiphononrelaxation rate from 4 I 11=2 to 4 I 13=2 in Er 3+ . The overall laser eciency, laser , is
87Figure 4.2:Upconversion uorescence spectrum for two dierent IOG-2 microspheres.Strong red uorescence is dependent on whether lasing is present in the microsphere. Thegure in (a) shows that a larger proportion <strong>of</strong> the population is involved in the C-b<strong>and</strong>lasing compared to (b), where upconversion is strong <strong>and</strong> lasing is absent. An additionalweak violet emission from a 35 m diameter microsphere is shown, for a pump power <strong>of</strong> 8mW. The violet emission has been scaled up by a factor <strong>of</strong> ve for clarity.
88therefore a combination <strong>of</strong> the intrinsic quantum eciency, quantum = = R (theratio between the calculated <strong>and</strong> measured radiative rates), <strong>and</strong> the eciency <strong>of</strong> theenergy transfer, ET , [94] laser = quantum ET ; (4.1)where ET = ( Y b f )= Y b , Y b is the lifetime <strong>of</strong> the 2 F 5=2 excited state when thereis no ET ( 1:3 ms), <strong>and</strong> f is the lifetime <strong>of</strong> the same level with ET. In practicalsystems with high dopant concentrations, the laser slope eciency can approach thequantum eciency.The 2 H 11=2 level <strong>and</strong> the 4 S 3=2 level can be considered to be in quasi-thermalequilibrium since the energy gap is 740 cm1 <strong>and</strong> is comparable to the maximumphonon energy <strong>of</strong> 1300 cm 1 for <strong>phosphate</strong> glass [91]. As such, only one phononis required to bridge the energy dierence between the two green levels, therebypopulating the 2 H 11=2 level at room temperature. The thermalisation <strong>of</strong> the 2 H 11=2level by the 4 S 3=2 level has a temperature dependent eect on the ratio <strong>of</strong> the radiativeemissions from these two levels as well as on the excited state lifetimes [95]. Themulti-phonon emission rate between these levels at a temperature, T , is ' ~!K mp (T ) = K mp (0) 1 exp; (4.2)k B Twhere k B is Boltzmann's constant, ! is the phonon frequency, <strong>and</strong> ' is the number<strong>of</strong> phonons required to bridge the energy gap, ¡E, between the levels <strong>and</strong> is given by¡E=~!, where ~! is the phonon energy [96]. For <strong>phosphate</strong> glass, this multiphononemission rate is K mp (295K) 10 11 s1 , which is signicantly higher than the value<strong>of</strong> 10 3 s1 for radiative emissions [96]. The energy dierence between the 4 S 3=2 level<strong>and</strong> the next lowest level, 4 F 9=2 , requires three phonons, therefore making this levelfar less likely to be populated from the 4 S 3=2 level.
89The emissions detected from the IOG-2 microsphere, as shown in Fig. 4.2, aredue to upconversion processes involving multiple pump laser photons <strong>and</strong>/or latticephonons. There are two upconversion mechanisms which must be considered whentrying to underst<strong>and</strong> the origin <strong>of</strong> the uorescence results; excited state absorption<strong>and</strong> energy transfer. These are shown in the energy level diagram in Fig. 4.1, inwhich we identify a number <strong>of</strong> dierent groups <strong>of</strong> transition processes that play a rolein the generation <strong>of</strong> the emission spectra.Transition groups 1 <strong>and</strong> 2 in Fig. 4.1 are associated with the ground state (GSA)<strong>and</strong> excited state absorptions respectively. As mentioned, there is a resonant energytransfer (ET) from the Yb 3+ sensitiser ( 2 F 5=2 ! 2 F 7=2 ) to the Er 3+ ion ( 4 I 15=2 ! 4I 11=2 ) followed by 980 nm ESA from the 4 I 11=2 level to the 4 F 7=2 level indicated in group1. Transition group 2 deals with the radiative <strong>and</strong> non-radiative decay processesfor the erbium ion. For example, rapid, non-radiative relaxation from 4 I 11=2 ! 4 I 13=2is possible <strong>and</strong> falls within this group. In spite <strong>of</strong> a large energy mismatch <strong>of</strong> about1450 cm 1 for the 4 I 13=2 ! 4 F 9=2 transition, the long lifetime <strong>of</strong> the 4 I 13=2 state <strong>and</strong>associated large population ensures that the ESA mechanism is adequately ecient[97, 98]. Due to the close spacing <strong>of</strong> the 4 F 7=2 <strong>and</strong> 4 S 3=2 levels, the population <strong>of</strong> 4 F 7=2readily decays non-radiatively to the 4 S 3=2level, whereby the thermal mechanismdescribed previously populates the 2 H 11=2 level. Finally, a second ESA from the 4 S 3=2level up to the 2 G 7=2 level is followed by non-radiative relaxation down to the 2 H 9=2level, <strong>and</strong> the subsequent radiative decay to the ground state generates a photon at410 nm (violet).At the high concentrations <strong>of</strong> Er 3+ <strong>and</strong> Yb 3+ in this work the inter-ion separationreaches a critically small radius <strong>of</strong> 3 nm for Er 3+ ions <strong>and</strong> 2 nm for Yb 3+ ions.
90This is close to the value <strong>of</strong> 2.12 nm for Yb 3+ -Yb 3+ ET's <strong>and</strong> an estimated 1.5 to2.0 nm for Yb 3+ -Er 3+ ET's as determined from Forster-Dexter theory [99], therebydramatically enhancing the probability <strong>of</strong> Yb 3+ -Yb 3+ , Yb 3+ -Er 3+ <strong>and</strong>, possibly, Er 3+ -Er 3+ energy transfers. The critical radius, R sx , is determined by the overlap <strong>of</strong> theemission <strong>and</strong> absorption cross-sections <strong>and</strong> is given byRsx 6 =3c s8 4 n 2 sZ s ems() x abs()d; (4.3)where s = 1.4 ms is the uorescence decay time <strong>of</strong> the unperturbed sensitiser, n sis the refractive index, the script s st<strong>and</strong>s for the sensitiser, i.e. the Yb 3+ ions,the script x st<strong>and</strong>s for either the sensitiser or the Er 3+acceptor ions, ems is theemission cross-section, <strong>and</strong> abs is the absorption cross-section.The emission <strong>and</strong>absorption cross-sections for this material are shown in Fig. 4.3, <strong>and</strong> are determinedfrom absorption measurements with a bulk sample <strong>of</strong> IOG-2 (c.f.Section 3.4 fordetails <strong>of</strong> the calculation). 3For non-radiative dipole-dipole interactions the energytransfer rate rapidly increases according to the inverse <strong>of</strong> the ion separation to thesixth power.Figure 4.4 shows the observed IR lasing spectrum around 1.5 m in a 50 mdiameter microsphere pumped with 10 mW <strong>of</strong> launched pump power at 980 nm.Two lasing peaks are excited, presumably due to excitation <strong>of</strong> polar modes.Theinset shows uorescing whispering gallery modes in a dierent 50 m diameter microsphere.The more intense lasing line has a peak power <strong>of</strong> 45 W which, whentaken into account with the approximately 1 mW <strong>of</strong> absorbed power, translates toa quantum eciency (QE) <strong>of</strong> 4.5%. This value is far greater than for singly <strong>doped</strong>glasses where the QE is normally < 0:1%. Analysis <strong>of</strong> the whispering gallery modes3The absorption measurements were provided by P. Feron in ENSSAT, Lanion, France.
91Figure 4.3: Absorption <strong>and</strong> emission cross-sections for Er 3+ :Yb 3+co-<strong>doped</strong> IOG-2 bulkglass.in the uorescence spectrum enables us to measure the FSR <strong>of</strong> the sphere modesto be 1.32 THz ( 10:4 nm), indicating a microsphere diameter, D = c=(n s F SR ),<strong>of</strong> 48 m, where F SR is the FSR from the data. This agrees reasonably well withan <strong>optical</strong> microscope measurement <strong>of</strong> 50 ¦ 2m. The refractive index <strong>of</strong> IOG-2 atroom temperature is 1.508 at 1540 nm. The measured spacing between TE <strong>and</strong> TMmodes <strong>of</strong> 9.0 nm around 1550 nm agrees well with the calculated value <strong>of</strong> 8.50 nm.Eccentricity in the microsphere results in splitting <strong>of</strong> the azimuthal modes by about15 GHz, corresponding to an eccentricity <strong>of</strong> around 2.7%.4.3.2 Intensity SwitchingThe usual power law dependence, I signal / I q pump, as described in Section 3.8, fails inthe presence <strong>of</strong> OB. In order to study the bistability <strong>of</strong> the microspheres, we measured
92Figure 4.4: Lasing spectrum for a 50 m diameter IOG-2 microsphere for 10 mW pumppower. The inset shows whispering gallery mode structure for a dierent 50 m diametermicrosphere.the emission intensity as a function <strong>of</strong> launched pump power for the same sphere as insection 4.3.1 at the lasing wavelength <strong>of</strong> 1.5 m. Similarly, we studied the intensity <strong>of</strong>uorescence emissions for a dierent sphere at three emission wavelengths: 520 nm,567 nm, <strong>and</strong> 660 nm. (Note: we used a dierent sphere simply because the rst spherefell o the mount <strong>and</strong> was lost). The launched pump power was increased from 0 mWto about 22 mW <strong>and</strong> back to 0 mW while recording the spectra. The results for 1.5m are shown in Fig. 4.5. As the pump power was increased, the emission intensitiesremained almost constant until a critical power (17 mW for the IR lasing in Fig.4.5) was reached, beyond which a sudden <strong>and</strong> dramatic rise in emission intensity wasobserved. Increasing the pump power beyond the critical point caused the emissionto level out once more. A subsequent reduction in pump power clearly demonstrates
93hysteretic behaviour <strong>and</strong> a wide bistable region, where the emission can have twointensity values depending on the history <strong>of</strong> the input power. The sudden jumps (orintensity switching) between the higher <strong>and</strong> lower branches <strong>of</strong> the hysteresis loopsare characteristic <strong>of</strong> the <strong>optical</strong> bistability <strong>of</strong> the spheres. A bistable response wasalso observed in the uorescence emissions shown in Fig. 4.6. The critical switchingpower depends on the taper-sphere coupling eciency <strong>and</strong> sphere size, <strong>and</strong> diers forthe two dierent spheres in Figs. 4.5 <strong>and</strong> 4.6. Possible reasons for the presence <strong>of</strong>the large peak at about 9 mW for the IR gure <strong>and</strong> its absence in the uorescencegures will be discussed in Section 4.6.Figure 4.5: Intensity bistability for the C-b<strong>and</strong> in a 50 m diameter sphere.A very promising feature <strong>of</strong> these microcavity resonators is the high contrastintensity switching observed; the ratio <strong>of</strong> the relative change in emission powers before<strong>and</strong> after the bistable region is 2.9 for the 4 S 3=2 green, 4.6 for the 2 H 11=2 green, 3.14 for
94Figure 4.6: Intensity bistability for the two green states 2 H 11=2 <strong>and</strong> 4 S 3=2 , <strong>and</strong> the red 4 F 9=2state, for a 60 m diameter, non-lasing sphere. The launched pump power is varied from0 to about 10 mW. The switching positions for the green <strong>and</strong> red emissions in this guredier from the 1.5 m lasing emission in Fig. 4.5 due to spheres <strong>of</strong> dierent sizes beingused. The corresponding spectra for the visible uorescence are shown in Fig. 4.2(a).
95the 4 F 9=2 red, <strong>and</strong> 4.7 for the 4 I 13=2 IR. These contrast ratios could be further increasedby selecting higher quality microspheres <strong>and</strong> improving the coupling eciency.4.3.3 Green Chromatic SwitchingAs referred to earlier, the strong temperature dependence in IOG-2 is due to the loss<strong>of</strong> about 40% <strong>of</strong> the laser power as heat in the glass, in conjunction with its low thermalconductivity. There is a sudden increased pump absorption in the microsphereassociated with the sudden increase in heat generation, <strong>and</strong> visa versa. The increasedabsorption occurs simultaneously with the sudden rise in the 520 nm ( 2 H 11=2 ) emissionintensity as compared to the 550 nm ( 4 S 3=2 ) intensity that was observed whenthe pump power was increased above the upper switching position <strong>of</strong> 7.8, as shownin Figs. 4.6 <strong>and</strong> 4.7. As the pump power was reduced below the lower switchingposition <strong>of</strong> 5.3 units, there was a sudden decrease in intensity ratio due to the drop inpump absorption (<strong>and</strong> heat generation). One <strong>of</strong> the fortunate properties <strong>of</strong> erbium isthe very close spacing between the 2 H 11=2 <strong>and</strong> 4 S 3=2 levels. This, combined with theecient population <strong>of</strong> the 4 S 3=2 level by 976 nm pumping, <strong>and</strong> the subsequent population<strong>of</strong> the 2 H 11=2 level by thermal coupling with 4 S 3=2 , provides an indirect measure<strong>of</strong> the internal temperature <strong>of</strong> the microsphere. Figure 4.7 reveals this connectionbetween intensity ratio <strong>and</strong> internal microsphere temperature.Using the methods outlined by Qiao et al. [100], Boltzmann statistics can be usedto describe the strong thermal coupling <strong>and</strong> the population redistribution between thetwo green levels. The intensity ratio is a function <strong>of</strong> the internal cavity temperature<strong>and</strong> is described by I( 2 H 11=2 )I( 4 S 3=2 ) = r Hg H ~! H ¡Eexp ; (4.4)r S g S ~! S k B T
96Figure 4.7: Chromatic switching for the green uorescence emissions at 2 H 11=2 (520 nm)<strong>and</strong> 4 S 3=2 (550 nm). The inversion ratio is proportional to the temperature <strong>of</strong> the modevolume. The jump in intensity ratio from 1.1 to 2.3 indicates a temperature increase <strong>of</strong> 178K. The corresponding spectra for the visible uorescence are shown in Fig. 4.2(a).
97where I is the integrated emission intensity for a particular level, r is the total spontaneousemission rate, g is the (2J + 1) multiplicity (or degeneracy) <strong>of</strong> each manifold,~! H (~! S ) is the energy <strong>of</strong> level 2 H 11=2 ( 4 S 3=2 ), <strong>and</strong> ¡E is the energy separation betweenthe levels. According to Eqn. 4.4, as the temperature is increased, the 2 H 11=2level is more eciently populated, <strong>and</strong> an increasingly larger fraction <strong>of</strong> the 4 S 3=2population is rapidly promoted to this upper level, <strong>and</strong>, consequently, the ratio <strong>of</strong> theemissions from the two states inverts so that the 520 nm emission becomes stronger.For a ratio <strong>of</strong> 2.3 on the y-axis in Fig. 4.7, the corresponding temperature is 575K. The chromatic switching can yield intensity ratios <strong>of</strong> up to 2.8 (data not shown).From Eqn. 4.4, this indicates a temperature <strong>of</strong> 642 K, just below the glass transitionvalue <strong>of</strong> 648 K [92]. This temperature seems exceptionally high, although therewas no evidence <strong>of</strong> thermal stresses, fracturing <strong>of</strong> the glass or other defects in themicrosphere. However, it is important to emphasise that the temperature calculatedusing this method does not represent the temperature <strong>of</strong> the entire sphere, but ratherjust the temperature <strong>of</strong> the mode volume. Heat dissipation from this region throughthe remainder <strong>of</strong> the material would account for no thermal stress on the sphere itself,which is likely to be at a much lower temperature.4.3.4 IR Wavelength SwitchingIn a cold cavity, with no heating, the resonance at a wavelength obeys the stationarywave condition l = 2n s (2a), where l denes the equatorial mode number, n s is therefractive index <strong>of</strong> the glass, <strong>and</strong> a is the microsphere radius. This resonance conditionmust change when there is pump-induced heating. Both the cavity dimensions <strong>and</strong>refractive index are temperature dependent <strong>and</strong> must be included in the modied
98equation, given byl = 2n s d 1 + 1 @n sn s @T1 + 1 @dd @T; (4.5)where we dene d = 2a [93]. The rst term in the brackets gives the fraction bywhich the refractive index must change, <strong>and</strong> the term in the second brackets gives thefraction by which the cavity length must change. From this denition we can writethe wavelength shift as a function <strong>of</strong> temperature as¡ 1¡T = @n sn s @T + 1 d@d@T: (4.6)Figure 4.8: Wavelength switching in the C-b<strong>and</strong> lasing at 1.5 m. The gure correspondswith the intensity bistability measurements in Fig. 4.5. The switching positions are thesame for both.From this discussion we can reach the conclusion that the temperature <strong>and</strong> size<strong>of</strong> the mode volume are also bistable. By extension, the wavelength <strong>of</strong> the lasing
99emission has a bistable response. Figure 4.8 shows a dierence <strong>of</strong> 1.2 nm betweenupper <strong>and</strong> lower wavelength values, measured in the middle <strong>of</strong> the bistable region,corresponding to a temperature dierence <strong>of</strong> 94 K. Here, we have taken the cavityexpansion coecient to be 145 ¢ 10 7 /K from the manufacturer's specications [92]<strong>and</strong> the thermo-optic variation coecient is taken to be 63 ¢ 107 /K from a similarglass, QE-7S [101]. A more accurate model <strong>of</strong> the wavelength shift would have toinclude the complex behaviour <strong>of</strong> stress-induced refractive index changes (photoelasticeect), especially since the mode volume <strong>of</strong> the 980 nm pump is more than 1.5 timessmaller than in the 1.5 m lasing mode as shown in Fig. 1.5.4.4 Power-law UpconversionsOur microspheres tend to exhibit bistability only when the current to the pump laser,<strong>and</strong>, hence, the pump frequency, are adjusted to a precise setting for each sphere. Wehave plotted the emission power for three wavelengths as a function <strong>of</strong> pump powerin Fig. 4.9. Unlike the previous data, Fig. 4.9(a) shows linear slopes for a 30 mdiameter, nonlasing microsphere.Lasing action is always absent for microspheres<strong>of</strong> this size, presumably due to the expected lower Q factor (c.f. the microspheresize dependence <strong>of</strong> Q in Fig. 1.4(b)). The slopes <strong>of</strong> the three plots indicate thattwo pump photons produce each uorescence photon emitted, as predicted by thepower law dependence. A notable feature in the spectrum in Fig. 4.9(b) is the poorerthermalisation <strong>of</strong> the 2 H 11=2 level compared to other, larger, microspheres discussed inthis chapter. This implies there is a relatively low amount <strong>of</strong> heating in this particularmicrosphere.We expect the reason for the quadratic response to be a combination <strong>of</strong> poorer
100Figure 4.9: Fluorescence slopes <strong>and</strong> spectrum for the two green levels <strong>and</strong> the red levelfor a 30 m diameter nonlasing sphere. The slopes in (a) follow a power law dependence<strong>and</strong> indicate two pump photons produce a photon at either <strong>of</strong> the three wavelengths. Thespectrum in (b) corresponds to the last data point in (a).
101phase matching between the 1 m diameter taper coupler <strong>and</strong> the 30 m diametermicrosphere, greater cavity losses due to a lower Q value, greater heat dissipation ratedue to the smaller cavity size compared to the size <strong>of</strong> the supporting post holding themicrosphere, <strong>and</strong> a larger FSR. The culmination <strong>of</strong> these factors impacts dramaticallyon the microsphere's ability to demonstrate self-induced thermal bistability.Thisobservation may set a lower limit on the range <strong>of</strong> microsphere diameters that canexhibit bistability, if the wavelength <strong>of</strong> the pump laser is not adjusted appropriately.It is expected that phase matching with a bre taper will set an upper limit <strong>of</strong> roughly100 m on the microsphere diameter for a useful device.4.5 DiscussionOptical bistability previously demonstrated in passive silica [10, 102] was attributedto nonlinearities arising from the Kerr eect <strong>of</strong> the resonance line, together withhigh Q factors (Q > 10 8 ) <strong>and</strong> a tunable, narrow linewidth laser. OB, due to the largethermo-optic eect in Silicon (a factor <strong>of</strong> 30 bigger in magnitude than in IOG-2 glass),was also observed in a 5 m diameter ring resonator with a Q factor <strong>of</strong> only 10 4 [22].The results presented here clearly show that IOG-2 microspheres exhibit bistableswitching behaviour under vastly dierent conditions; we use co-<strong>doped</strong> <strong>phosphate</strong>glass microspheres, <strong>and</strong> the pump laser has a linewidth <strong>of</strong> 1 nm <strong>and</strong> is not locked toa specic cavity resonance.In principle, a number <strong>of</strong> processes may be responsible for the observation <strong>of</strong> <strong>optical</strong>bistability, depending on whether the observed eect is temperature dependentor independent. Experiments performed in our lab have shown that the switchingpositions depend on the ambient temperature, thereby excluding photon avalanche
102<strong>and</strong> the Kerr eect immediately, both <strong>of</strong> which are temperature independent. Temperaturedependent mechanisms that may be responsible include material eects like(i) strong Yb 3+ -Yb 3+coupling, i.e. non-linear energy transfer [103], (ii) nonlinearupconversion rates [104], <strong>and</strong> (iii) thermal avalanche [16], <strong>and</strong> cavity eects, such as(iv) dispersive bistability mediated by the thermo-optic eect <strong>and</strong> cavity expansion[22, 105].Guillot-Noel et al. [103] have described a mechanism that could be responsiblefor bistability in the regime <strong>of</strong> strong Yb 3+ -Yb 3+ coupling, in which case cooperativeluminescence would be expected. In order to be appreciable, the distance betweenthe ions would need to be <strong>of</strong> the order <strong>of</strong> several A, i.e. signicantly smaller than forIOG-2 (21 A) assuming there is no clustering, <strong>and</strong>, therefore, this eect is unlikely toplay a key role. However, if it is present, the luminescence would likely be very weakcompared to the single ion Er 3+ transitions. It is reasonable to assume that the backtransfer rate is negligible due to the high phonon energy <strong>of</strong> the host lattice, <strong>and</strong> is,therefore, unlikely to be the source <strong>of</strong> nonlinearity in our measurements.Another possible explanation includes a nonlinear upconversion rate either forYb 3+ -Yb 3+ , Yb 3+ -Er 3+ or Er 3+ -Er 3+ energy transfers [104]. This has been observedin high concentration Er 3+ <strong>doped</strong> bres, where the nonlinearity is dependent on populationinversion <strong>of</strong> the lasing levels, <strong>and</strong> the signal <strong>and</strong> emission rates. Temperaturedependent eects in the upconversion uorescence in Er 3+ :Yb 3+ Ga 2 S 3 :La 2 O 3 chalcogenideglass <strong>and</strong> germanosilicate <strong>optical</strong> bres have been attributed to an exponentialincrease in the Yb 3+ absorption cross-section elsewhere [106]. However, there havebeen no reports <strong>of</strong> bistability relying on these mechanisms.Thermal avalanche was used to explain bistability in Yb 3+ -<strong>doped</strong> bromide lattices
103by Gamelin et al.[16] at cryogenic temperatures. This theory relies on nonlinearabsorption in the Yb 3+ ions with increasing temperature <strong>and</strong> predicts bistable powerabsorbance in the microsphere as a function <strong>of</strong> pump power in the taper. As phononsare released into the lattice from Yb 3+ excited <strong>and</strong> ground states, the temperatureincreases, thereby increasing absorbance <strong>and</strong> leading to a further increase in temperature.This cyclic process causes a thermal avalanche for high enough pump power. Inorder to determine whether thermal avalanche is truly responsible, it would be necessaryto perform measurements <strong>of</strong> the dependence <strong>of</strong> the Yb 3+ absorption coecient<strong>and</strong> to ascertain whether it is a nonlinear function <strong>of</strong> internal microsphere temperatureabove 295 K. However, the results presented in Lei et al.[107] for dierentYb 3+ -<strong>doped</strong> <strong>phosphate</strong> glasses do not show a suitable nonlinear absorption coecientnecessary for thermal avalanche. This suggests that thermal avalanche theoryis also unsuitable to describe the behaviour <strong>of</strong> IOG-2.We suggest that dispersive bistability [105] - a mechanism commonly used toexplain bistability in Fabry-Perot etalons - can predict our results.The generaltheory states that as the pump laser frequency is scanned across a high-Q cavityresonance the cavity intensity rapidly rises, <strong>and</strong> when the pump frequency movesaway from the cavity resonance the cavity intensity rapidly falls. In addition, thisdescription is complicated by the fact that the frequency <strong>of</strong> the cavity resonance scalesapproximately linearly with the cavity intensity, leading to a bistable response. Inour case, the cavity resonance could be shifted by a temperature-dependent refractiveindex - the thermo-optic eect - <strong>and</strong> thermal expansion <strong>of</strong> the cavity [93]. As alreadymentioned in the previous section, we nd that in order to observe bistability thecurrent to the pump laser, <strong>and</strong>, hence, the pump frequency, need to be adjusted to
104a precise setting for each sphere. The corollary <strong>of</strong> this adjustment is the positioning<strong>of</strong> the laser frequency near a cavity resonance. For the experimental conditions here,a threshold power <strong>of</strong> about 100 W in the cavity mode is enough to cause switching- a value which is well below our estimated 10-15% <strong>of</strong> pump power coupled into thesphere (< 1mW). Firm evidence <strong>of</strong> this eect would be possible by probing individualcavity resonances with a narrow linewidth, 980 nm external cavity diode laser, whilerecording the power transmitted past the taper-sphere coupling junction as describedby Rokhsari et al. [102].4.6 Dispersive Optical BistabilityThermal nonlinearities will aect the resonance condition in a high-Q cavity.In<strong>phosphate</strong> glass, the combined eect <strong>of</strong> the thermo-optic eect <strong>and</strong> cavity expansionred-shifts the resonance frequency. The direction in which the resonance frequencyscans across the pump laser frequency, or visa versa, produces two distinct responsesgoverned by the thermal properties <strong>of</strong> the cavity.Two time constants describe the cavity dynamics: the fast mode volume response<strong>and</strong> the slow microsphere response. The mode volume quickly dissipates heat into themicrosphere volume with a time constant Mode = (2b) 2 =, where b is the half-width<strong>of</strong> the mode volume given by b = 0:84al2=3 , <strong>and</strong> = 0:57 W/mK is the thermalconductivity [92].This time constant for the mode volume is about 2 s for ourmicrospheres, while the time constant for the whole sphere volume is on the order <strong>of</strong>a few milliseconds [108]. A picture <strong>of</strong> the heat generation <strong>and</strong> loss mechanisms in amicrosphere is shown in Fig. 4.10. Conduction is viewed as the primary mechanismaecting the thermal diusion [109].
105Figure 4.10: Schematic <strong>of</strong> the heat conduction from the mode volume to the rest <strong>of</strong> the microsphere<strong>and</strong> the tapered bre (not shown). The microsphere dissipates its heat primarilythrough the supporting stem/post.It was shown in [109] <strong>and</strong> [110] that cavities with thermal nonlinearity are describedby a nonlinear dierential equation for the internal eld amplitude, e,_e + e [¡x + i(! + )] = I inc (t)_ + = jej 2 ;(4.7)where ¡x is the linewidth <strong>of</strong> the mode, ! is the resonance frequency <strong>of</strong> the mode, is the shift in resonance frequency giving the amount <strong>of</strong> detuning, I inc (t) is the pumpeld, is the relaxation rate, <strong>and</strong> is the thermal nonlinearity coecient whichcomes from the part in the brackets in Eqn. 4.6. Fig. 4.11 describes how the cavityresonance is scanned across the laser frequency from two dierent perspectives; (a)frequency detuning, <strong>and</strong> (b,c) input pump power.The plot in Fig. 4.11(a) is the internal cavity eld given by the Lorentzian [105],jc j 2 =jc 0 j 21 + 4x x 0 ¡x 2; (4.8)where jc j 2 is the shifted cavity eld coecient, jc 0 j 2 is the unshifted cavity eld,<strong>and</strong> x 0 is the unshifted resonance position. Since our bistability is self-induced, the
106Figure 4.11: Graphical description <strong>of</strong> dispersive <strong>optical</strong> bistability due to thermal nonlinearitiesin a cavity. The green circles mark out corresponding points on each <strong>of</strong> the threeplots. Figure (a) shows the Lorentzian <strong>of</strong> the 980 nm pump, Fig. (b) shows the cavitycoecient, i.e. the region over which the cavity resonance scans over the pump Lorentzian,as a function <strong>of</strong> input power, <strong>and</strong> Fig. (c) shows the internal cavity eld as a function <strong>of</strong>input power.
107detuning can be written as a function <strong>of</strong> the input pump intensity, x x0 2= + KI inc jc j 2 ; (4.9)¡xwhere K is a constant dening the amount <strong>of</strong> spatial overlap between the perturbation<strong>and</strong> the energy distribution <strong>of</strong> the mode. This equation produces the black line inthe gure which scans across jc j 2 with increasing values <strong>of</strong> incident pump I inc . Theintersection points between the line <strong>and</strong> jc j 2 are solutions to the cubic equation inEqn. 4.7. The cubic equation in Eqn. 4.7 produces a response similar to that shownin Fig. 4.11(b). In reality, these intersections describe the positioning <strong>of</strong> the cavityresonance relative to the pump frequency (c.f. the movie linked in Fig. 4.11). In caseswhere the line intersects at three points for increasing I inc , the most stable positionis that with minimum detuning. Alternatively, for decreasing I inc , the most stableposition is that with maximum detuning. There are no stable solutions where the lineintersects two points. The internal microsphere intensity amplitude is jc j 2 E 2 o whereI inc / E 2 o. A theoretical bistable plot <strong>of</strong> the internal sphere eld is plotted in Fig.4.11(c) <strong>and</strong> clearly mimics the results in Fig. 4.6.Comparison <strong>of</strong> the bistability plots for IR lasing in Fig. 4.5 <strong>and</strong> uorescence in Fig.4.6 indicates somewhat unusual behaviour around the switch-low position. The IRlasing suddenly peaks at 10 mW launched power before switching to the lower state.All spheres have demonstrated this behaviour to a greater or lesser degree. Despitethis, the uorescence never shows a sudden jump before switching to the lower state.In particular, a sudden increase in absorption (as determined from the ratio <strong>of</strong> thetwo green emissions discussed in Section 4.3.3) in the sphere at this point, is neverobserved. There seems to be no similar eect observed in Fabry-Perot cavities <strong>and</strong>other resonators, which might have shed some insight onto the problem. A possible
108explanation for the peak in the IR lasing bistability plots, <strong>and</strong> its notable absence inuorescence plots, may be related to thermal lensing (c.f. Section 1.10) <strong>and</strong> the twodierent methods used to detect the light, i.e. a tapered bre is used for the lasingemissions <strong>and</strong> a high NA bre is used to collect scattered uorescence. In order t<strong>of</strong>ully underst<strong>and</strong> this behaviour it needs to be investigated further by analysing theeect <strong>of</strong> thermal lensing in microspheres, <strong>and</strong> by imaging the mode propagation pathin the microsphere.4.7 ConclusionsIn conclusion, a multi-wavelength, microsphere light source with <strong>optical</strong> bistability hasbeen demonstrated in an Er 3+ :Yb 3+ co-<strong>doped</strong> IOG-2 sphere, <strong>and</strong> the Er 3+ transitions<strong>and</strong> uorescence mechanisms involved have been identied.Factors aecting thedynamics <strong>of</strong> visible uorescence <strong>and</strong> C-b<strong>and</strong> lasing emission have been examined<strong>and</strong> show that the thermal properties <strong>of</strong> IOG-2 glass play an important role in themicrosphere performance. In particular, the high loss <strong>of</strong> pump power to the glassas heat, in conjunction with the low thermal conductivity have a pronounced eecton the green emissions from levels 2 H 11=2 <strong>and</strong> 4 S 3=2 . Our calculations show that theclose proximity <strong>of</strong> the ions in our glass greatly enhances the probability <strong>of</strong> sensitisersensitiser<strong>and</strong> sensitiser-acceptor energy transfers.We have also reported on the simultaneous observation <strong>of</strong> chromatic <strong>and</strong> intensityOB in IOG-2 glass at room temperature.These results show that there are twopossible temperatures in the bistable region <strong>and</strong> that it is also possible to have twoemission intensities for the same excitation power. Chromatic bistability is dependenton the presence <strong>of</strong> intensity bistability due to the energy coupling between the green
109emitting levels 2 H 11=2 <strong>and</strong> 4 S 3=2 . Therefore, the switching positions are the same forboth types <strong>of</strong> bistability. The OB shows high contrast switching ratios. The intensityswitching shows ratios <strong>of</strong> 2.9 <strong>and</strong> 4.6 for the two green emissions, 3.1 for the reduorescence emissions, <strong>and</strong> 4.7 for the IR lasing, while the chromatic switching ratiosare as high as 2.8.Our observations may be tentatively explained in terms <strong>of</strong> dispersive bistability,where the temperature dependent refractive index <strong>and</strong> thermal expansion <strong>of</strong> <strong>phosphate</strong>glass causes the resonant cavity mode <strong>and</strong> the laser mode to behave nonlinearly,yielding a bistable response. Several other possible mechanisms (strong Yb 3+ -Yb 3+coupling, nonlinear upconversion rates, <strong>and</strong> thermal avalanche) were examined; however,all are considered unfavourable under our experimental conditions or else requirefurther measurements to study their inuence on the observed behaviour.Microcavity resonators oer substantial miniaturisation, greatly reduced powerfor switching, <strong>and</strong> allow for all emissions to be easily bre coupled [111]. In addition,the improved optomechanical properties <strong>of</strong> IOG-2 compared to other glasses used forOB, such as CsCdBr 3 , makes this glass appealing for all-<strong>optical</strong> logic elements in<strong>optical</strong> engineering applications. The expected low operating speed <strong>of</strong> a few hundredHz is likely to make this type <strong>of</strong> bistability unfavourable for all-<strong>optical</strong> computingapplications.There are, however, numerous engineering situations where this device will havesuperior performance. The advantage <strong>of</strong> using a non-electrical, bred device for industrialapplications is promising. Such applications might include a miniature temperaturelimit switch <strong>and</strong>/or a pressure limit switch where electrical noise limits traditionalelectrical devices. For example, it may not be possible to use a piezo-strain gauge -
110<strong>and</strong> the associated wheatstone bridge - near large, noisy switch gears or generators. Asimilar limitation exists with electrical resistance thermometers, which also require awheatstone bridge, when placed in noisy environments. In addition to electrical noiseimmunity, the switching thresholds can be controlled to give the desired performance.The upper temperature operating limit is only limited by the glass transition temperature<strong>of</strong> 649 K. Nanometre variations in the cavity radius are enough to exploit theswitching mechanism in the microsphere. Furthermore, recent work in our laboratoryhas demonstrated the mechanical robustness <strong>of</strong> such a system by thermally fusingthe bre taper to the microsphere at a specic point, thereby minimising drift in theswitching positions arising from changes in the coupling eciency [112], <strong>and</strong>, as aresult, the pump intensity.The functionality oered by the wavelength switching could be exploited for 1 ¢ 2ADD-DROP ltering. Details <strong>of</strong> a similar passive device have already been proposedin [113]. In our case, the 980 nm pump would serve as a control beam for either adding<strong>and</strong>/or dropping a wavelength by causing the cavity resonance frequency to shift. Thedevice would be largely independent <strong>of</strong> wavelength, except for those frequencies fallingwithin the material absorption b<strong>and</strong>s.
111Chapter 5Homemade External Cavity DiodeLaser5.1 IntroductionThe work in this thesis has focussed primarily on the exploitation <strong>of</strong> the materialproperties <strong>of</strong> dierent glasses <strong>and</strong> their dopants. Chapter 4 revealed the pr<strong>of</strong>oundimportance <strong>of</strong> the cavity modes in gain media. Future work in the group will departfrom the material science emphasis <strong>and</strong> will study novel cavity eects, such as coupledresonator induced transparency using Fano resonances in passive microspheres, <strong>and</strong>the eect <strong>of</strong> mutually coupled resonators on the lasing threshold or Q factor in eitheractive or passive microspheres respectively. The study <strong>of</strong> such phenomena requiresa narrow linewidth laser in order to controllably probe individual cavity resonances.For this purpose an external cavity diode laser (ECDL) with a Littrow congurationgrating was constructed using the Sussex <strong>and</strong> Melbourne designs [114, 115]. Thischapter describes the design, construction, <strong>and</strong> testing <strong>of</strong> the ECDL.Homemade ECDLs have been a mainstay <strong>of</strong> atomic physics <strong>and</strong> microcavityphysics for a number <strong>of</strong> decades [4, 116]. Their low cost <strong>and</strong> yet long term, high
112performance have made them an indispensable tool for studying specic resonances.The basic principle <strong>of</strong> the ECDL relies on the frequency selective feedback <strong>of</strong> part <strong>of</strong>the <strong>optical</strong> signal into the diode laser. This is achieved using a diraction grating tocreate an external cavity <strong>and</strong> can yield linewidths <strong>of</strong> a couple hundred kHz [115].5.2 Design <strong>and</strong> ConstructionIn our design we use a Littrow conguration for the grating that reects about 40%<strong>of</strong> the rst order diracted beam back into the laser diode cavity as shown in Fig.5.1. The Littrow conguration is shown in the zoomed image. The output beamfrom the ECDL is the zeroth order reection from the diraction grating. The angle<strong>of</strong> reection from the grating, , is wavelength dependent according to the gratingformula m = 2d sin(), where m is the order <strong>of</strong> diraction <strong>and</strong> d is the groovespacing on the grating. This formula dictates the necessary grating to purchase forthe chosen wavelength range. It also shows that one can selectively feedback a specicwavelength by simply adjusting the angle <strong>of</strong> the grating, . Unlike other ECDL designs[114, 116], the Melbourne design has an added mirror that exactly counteracts anytransverse displacements <strong>of</strong> the beam over the full range <strong>of</strong> adjustments. This isvitally important for bre coupling into a single mode bre.The construction follows the designs by Hawthorn et al. [115] <strong>and</strong> the associatedwebsite [117], where technical drawings <strong>and</strong> a parts list are available. The laser diodeis a 50 mW 980 nm Fabry-Perot cavity with no anti-reection (AR) coating, suppliedby Roithner Lasertechnik Gmbh (S9850MG). These diodes were found to operatevery well <strong>and</strong> are reasonably priced at 12 euro each. The lens in the collimation tubehas an AR coating. A small, replicated holographic grating with 1200 lines/mm from
113Figure 5.1: Schematic <strong>of</strong> the external cavity diode laser <strong>and</strong> the supporting hardware. Theangle in the zoomed imaged is dened as the angle between the normal to the grating <strong>and</strong>the <strong>optical</strong> axis <strong>of</strong> the beam from the laser diode. DSO: Digital storage oscilloscope, PZT:piezo-electric element, SMF28: single mode bre, angular displacements, ¡, are done withthe upper adjustment screw in the main gure.PTR Optics is the main feature <strong>of</strong> the ECDL. A PZT stack scans the grating angle at50-100 Hz, <strong>and</strong> a 1 mm thick PZT disk beneath the grating provides ultra-ne scans.All other design details, <strong>and</strong> electrical wiring are described in Appendix F.Alignment <strong>of</strong> the laser cavity is a two-step process. First, the beam is collimatedover a distance <strong>of</strong> about 3 m by adjusting the collimation lens. The second step is toprecisely align the rst order beam sent back into the Fabry-Perot cavity by notingthe threshold current for every adjustment <strong>of</strong> (i) the grating angle <strong>and</strong> (ii) the collimationlens. A reduction in threshold corresponds to improved alignment. Reference[114] suggests that the current to the laser should be set just below the thresholdwhile making the adjustments, however, it can be more convenient to operate the
114laser slightly above threshold. The advantage is that any degradation or improvementcan be immediately noticed in the output power measurement. Figure 5.2(a)shows a spectrum with a single 1.65 mW lasing peak after bre-coupling to an OSA.Figure 5.2(b) shows a plot <strong>of</strong> the lasing threshold, as the alignment is improved. Thecollimation lens should only be adjusted a few degrees <strong>of</strong> rotation in the threadedmount until the threshold is minimised. Very slight movements in the lens persist forabout one minute after each adjustment <strong>and</strong> this tends to aect the alignment <strong>and</strong>must be taken into consideration also.Figure 5.2: (a) Fibre coupled lasing peak as measured on the OSA, <strong>and</strong> (b) thresholdcurrents. The threshold currents were recorded at dierent stages <strong>of</strong> the collimation tubealignment.
115The ECDL is mounted on a heavy 5 kg steel block to provide vibration isolation<strong>and</strong> a large thermal sink. A layer <strong>of</strong> Sorbothane beneath the block damps the transmission<strong>of</strong> vibrations from the <strong>optical</strong> table through to the ECDL. Thermal paste isapplied to each <strong>of</strong> the joints between the laser cavity <strong>and</strong> block to improve conductivity.In addition, an aluminium enclosure surrounds the ECDL, combined with afurther clear plastic enclosure, adding two layers <strong>of</strong> thermal buering from air currentsas well as acoustic noise, thereby improving the stability <strong>of</strong> the laser (c.f. AppendixA).5.3 PerformanceThe ECDL must meet several requirements; xed direction output <strong>of</strong> the laser beamfor bre coupling compatibility, wide tunability over a range <strong>of</strong> one FSR for a typicalmicrosphere, i.e. about 10 nm, <strong>and</strong> narrow linewidth.As stated, the design is inherently optimised for xed direction output. The abilityto tune the laser over 30 nm, using the angular adjustment screw shown in Fig. 5.1,while maintaining at least 60 % laser power shows the advantage <strong>of</strong> the design. Sucha wide tuning range, from 965 - 995 nm, is <strong>of</strong> great benet when scanning across amicrosphere's FSR.As the angular adjustment screw is turned, the lasing mode is shifted from onespectral mode to the adjacent spectral mode, typically 0.5 nm apart, while alwaysmaintaining single mode output over the 30 nm range. Unfortunately, this wavelengthtuning requires the two enclosures to be removed <strong>and</strong> direct manual adjustment <strong>of</strong>the screw. The wavelength <strong>of</strong> the lasing peak can be shifted over this 0.5 nm rangeby varying the laser diode current from 15 - 75 mA. A LL curve for the full current
116range is shown in Fig. 5.3(a). Several mode hops start appearing for currents greaterthan 45 mA. Juxtaposed with these mode hops are those appearing when the piezostack is scanned. The piezo stack provides ne scans over a range <strong>of</strong> around 6 GHz,which is wider than a typical resonance width, i.e. < 1 GHz, <strong>and</strong> is shown in Fig.5.3(b). Ultra-ne scans over a range <strong>of</strong> around 0.4 GHz are possible by scanning thepiezo disk beneath the diraction grating. AR coated LDs, while considerably moreexpensive, can improve the continuous tuning range to several hundred GHz up to afew THz. These measurements were performed by connecting the bre-coupled laseroutput into a wavemeter (Burleigh Instruments, WA 1100), which has a resolution <strong>of</strong>0.001 nm.Homemade ECDLs compare favourably with commercial counterparts, <strong>and</strong> typicallyhave linewidths ranging from 100 kHz to around 5 MHz. Hawthorn et al. [115]quote a linewidth <strong>of</strong> 370 kHz over 100 s for their 780 nm ECDL, measured by lookingat the beat signal <strong>of</strong> two identical lasers locked to atomic resonances in rubidiumusing a fast photodiode. Initial attempts to nd a resonance in an Er 3+ :ZBLALiPmicrosphere with the ECDL built here have been unsuccessful. This may be becausethe linewidth is several tens <strong>of</strong> MHz, i.e. greater than the width <strong>of</strong> a microsphereresonance.The identication <strong>of</strong> resonances is compounded by the appearance <strong>of</strong>many narrow mode hops over piezo-stack tuning range. These mode hops are <strong>of</strong>tenmisleading due to their narrow width, giving the false impression <strong>of</strong> a microsphereresonance.Nevertheless, these misleading mode hops can be eliminated from theidentication process with some experience. An actual linewidth measurement usingthe self-homodyne technique may be necessary to conrm the laser performance infuture work.
117(a) Light-in light-out curve for the ECDL.(b) ECDL wavelength as a function <strong>of</strong> PZT scanning <strong>of</strong> the grating angle.Figure 5.3: Mode hopping with both (a) laser diode current tuning <strong>and</strong> (b) PZT scanning.The wavelength in (a) is 990 nm <strong>and</strong> the laser diode temperature is 23 C. The solid greenline in (b) represents increasing voltage across the piezo stack <strong>and</strong> the dashed blue linerepresents decreasing voltage.
118Chapter 6ConclusionsThis project has investigated the emission characteristics <strong>of</strong> an Er 3+ <strong>doped</strong> uorozirconateglass <strong>and</strong> an Er 3+ :Yb 3+ co-<strong>doped</strong> <strong>phosphate</strong> glass microspheres resonators. Amethod for fabricating <strong>and</strong> characterising adiabatic bre tapers as coupling devicesinto microsphere resonators was presented. The tapers used for this thesis normallyexcite more than one cavity mode, resulting in multimode lasing at 1.5 m, however,single mode lasing is sometimes observed when the taper <strong>and</strong> microsphere areoptimally aligned.Our results on the erbium-<strong>doped</strong> uorozirconate glass, ZBLALiP, build on earlierwork by Mortier et al. [24] <strong>and</strong> show very ecient upconversions over a broad range.Thirteen discrete emissions ranging from 320 to 850 nm have been observed in theupconversion spectrum. The absorption <strong>and</strong> uorescence properties are studied, <strong>and</strong>the processes responsible for the generation <strong>of</strong> the observed wavelengths are outlined.To the best <strong>of</strong> our knowledge, no other singly <strong>doped</strong> glass has been shown to generatesuch a range <strong>of</strong> emissions from the UV to the near-IR, including Er 3+ <strong>doped</strong> ZBLANmicrospheres [118].
119Scorching or blackening <strong>of</strong> the microspheres during fabrication in the plasma chamberis a problem. In order to exploit ZBLALiP's very low absorption in the mid-IR,the fabrication process would need to be improved so as not to degrade the materialquality. Mid-IR lasing has been observed at 2.7 m from the 4 I 11=2 ! 4 I 13=2 transitionin bulk samples <strong>of</strong> ZBLALiP by Mortier [119]. Mid-IR lasing in a ZBLALiPmicrosphere would be a very exciting development since other glass hosts, such assilica, typically do not transmit at this wavelength. Unfortunately, we do not have aspectrum analyser for these wavelengths in our laboratory. A pr<strong>of</strong>ound implication<strong>of</strong> the attenuation graph presented in Fig. 3.1, is the suggestion that if uorozirconateglasses can become an aordable, practical, <strong>and</strong> ultra-low-loss alternative tosilica <strong>optical</strong> bres, there will be a race to develop lasers at 2.6 m.An erbium<strong>doped</strong> ZBLALiP microsphere would serve as a laser source around this wavelength.Furthermore, it has been suggested [24] that <strong>optical</strong> bre fabrication issues such asre-crystallisation defects may be partially remedied by using ZBLALiP rather thanthe more conventional glass, ZBLAN.Fluorozirconate glasses such as ZBLALiP are ideal for upconversion lasing due totheir lower phonon energy (600 cm 1 max.) compared with silica (1190 cm 1 max.),for example. Green upconversion lasing with a very low threshold <strong>of</strong> 30 W absorbedpower at 801 nm pumping was observed in Er 3+ <strong>doped</strong> ZBLAN microspheres [118].Green lasing was also observed in an Er 3+ <strong>doped</strong> ZBLAN microsphere following threeESAs when pumped at 800 nm [120]. All these experiments were performed with theoutdated techniques <strong>of</strong> free beam coupling <strong>and</strong> prism coupling using microspheres <strong>of</strong>unstated Q values. Upconversion lasing in ZBLALiP microspheres, when pumped at800 nm, seems very probable given the high upconversion rates observed in the present
120work. The reason for choosing 800 nm rather than 980 nm is that the metastable4I 13=2 level can be readily depopulated via an ESA to the green level at 4 S 3=2 . Afurther ESA from this long-lived level could then populate the 2 P 3=2 level, <strong>and</strong> theresulting violet <strong>and</strong> UV emissions would follow.To the best <strong>of</strong> our knowledge, the work in this thesis presented the rst systematicstudy <strong>of</strong> <strong>optical</strong> bistability in a glass microspherical laser.Dispersive <strong>optical</strong>bistability in an Er 3+ :Yb 3+ co-<strong>doped</strong> IOG-2 microspherical cavity has been studied.The thermal properties <strong>of</strong> IOG-2 glass play an important role in the microsphereperformance. In particular, the high loss <strong>of</strong> pump power to the glass as heat, in conjunctionwith the low thermal conductivity, have a pronounced eect on the cavityresonance. As such, we have seen self-induced switching in the intensity at C-b<strong>and</strong>lasing <strong>and</strong> visible uorescence wavelengths, <strong>and</strong> chromatic/wavelength switching atgreen <strong>and</strong> C-b<strong>and</strong> lasing wavelengths. The dispersive bistability model seems to correctlypredict our results. It cannot, however, explain the spike observed in the lasingbistable plots while decreasing the pump power; thermal lensing was suggested as acontributing factor aecting the mode propagation path <strong>and</strong>, thus, causing variablelight collection eciency. Lifetime measurements <strong>of</strong> the excited states are needed toconrm or reject the inuence <strong>of</strong> ETU. Switching speeds are expected to be limitedby the energy level lifetimes in the Er 3+ ions; however, measurements are needed toconrm this.In comparison to other bistable glasses <strong>and</strong> crystals, IOG-2 microspheres havelarge contrasts between the two bistable states <strong>and</strong> require very low switching powers.In addition, their size <strong>and</strong> room temperature operation make them interestingfor miniature devices. These results are <strong>of</strong> immediate importance for applications
121requiring co-<strong>doped</strong> laser glasses <strong>and</strong> crystals, such as all-<strong>optical</strong> processing. A compactlaser source would be ideal for microchip integration, especially if it can bemounted with a waveguide such as a stripline pedestal anti-resonant reecting <strong>optical</strong>waveguide (SPARROW) [85]. A microdisk or microtoroid geometry would be evenmore appealing due to their smaller dimensions <strong>and</strong> tighter mode connement. It is,perhaps, industrial applications that may benet most from the unique properties <strong>of</strong>a bistable microsphere. Non-electrical solutions are <strong>of</strong>ten sought for noisy applications.An all-<strong>optical</strong>, miniature, high sensitivity temperature limit switch <strong>and</strong>/or apressure limit switch, such as a co-<strong>doped</strong> microcavity, has particular advantages overother commercial systems. There is also the option <strong>of</strong> choosing from either intensityor wavelength switching, both <strong>of</strong> which occur simultaneously.All in all, the two glasses investigated in this thesis work oer new <strong>and</strong> interestingavenues <strong>of</strong> research for a wide variety <strong>of</strong> applications.Our group will, no doubt,continue to study these glasses in the future.
122Appendix ASpectral Characterisation <strong>of</strong>Erbium-Doped MicrosphericalLasers
Spectral <strong>characterisation</strong> <strong>of</strong> erbium <strong>doped</strong> microspherical lasersBrian J. Shortt ♦ , Jonathan Ward, Danny O’Shea <strong>and</strong> Síle Nic ChormaicDepartment <strong>of</strong> Applied Physics <strong>and</strong> Instrumentation, Cork Institute <strong>of</strong> Technology<strong>and</strong> Tyndall National Institute, Prospect Row, Cork, Irel<strong>and</strong>.ABSTRACTWe present continuing theoretical <strong>and</strong> experimental investigations into the <strong>characterisation</strong> <strong>of</strong> fibre taper coupledmicrospherical lasers. We investigate the spectral emissions <strong>of</strong> these micro resonators as a function <strong>of</strong> the wavelength<strong>and</strong> power <strong>of</strong> the pump radiation. We also consider various means <strong>of</strong> efficiently coupling radiation into <strong>and</strong> out <strong>of</strong> thesedevices. We are particularly interested in studying emissions about 1.55 µm with the aim <strong>of</strong> exploiting potentialtelecommunications applications <strong>of</strong> these devices. We study microspheres with diameters in the range 40-150 µm.Pump light about 980 nm or 1480 nm is coupled into the microsphere through evanescent wave coupling betweenmicrosphere <strong>and</strong> <strong>optical</strong> fibre. The resulting spatial <strong>and</strong> spectral distribution <strong>of</strong> radiation within the spheres is describedby whispering gallery modes. Half <strong>and</strong> full-taper <strong>optical</strong> fibres are used to both couple the pump light into the sphere<strong>and</strong> to out couple the resulting infra red lasing. The physics <strong>of</strong> whispering gallery modes <strong>and</strong> the challenges <strong>of</strong> couplingto such modes is discussed. Experimental techniques <strong>and</strong> results will be presented <strong>and</strong> future directions indicated.Keywords: Lasers, microspheres, erbium <strong>doped</strong> glass, whispering gallery modes, evanescent coupling, fibre taper1. INTRODUCTIONThe first demonstration <strong>of</strong> a spherically symmetric <strong>rare</strong> <strong>earth</strong> <strong>doped</strong> solid microcavity undergoing laser action waspresented over forty years ago. 1 Samarium <strong>doped</strong> CaF 2 glass spheres with diameters <strong>of</strong> a few millimetres were pumpedby xenon flashtube. Upon exceeding a threshold pump power the output power grew quickly indicating the presence <strong>of</strong>stimulated emission. Interest in the study <strong>and</strong> application <strong>of</strong> these microcavities as potential laser sources developedfrom this point. The first continuous wave laser oscillation in a solid state medium was demonstrated in Nd:YAGspheres with a diameter <strong>of</strong> 5 mm <strong>and</strong> lasing threshold <strong>of</strong> 100 mW. 2 Current lasing thresholds st<strong>and</strong> at the microwattlevel, while, simultaneously, the size <strong>of</strong> the spheres has decreased dramatically. A more complete introduction tomicrocavity laser devices has been presented in an earlier paper <strong>and</strong> the interested reader is directed to it <strong>and</strong> thereferences contained therein. 3The capture <strong>and</strong> propagation <strong>of</strong> radiation in circular microlasers is based on multiple total internal reflections (TIR) <strong>of</strong>light within the resonant cavity structure. The resulting spatial <strong>and</strong> spectral electromagnetic field distributions have beentermed whispering gallery modes (WGMs) or morphology dependent resonances (MDRs). WGMs in micro resonatorshave attracted much attention in recent years due to the intrinsic high Q-factors <strong>and</strong> the very low mode volumes <strong>of</strong>typically a few hundred µm 3 that can be achieved. 4 Q-factors as high as 10 11 have been reported. 5 This coupling <strong>of</strong> lowmode volume with high Q-factor can lead to sufficiently high light intensities within the sphere such that non lineareffects come into play. 6 The development <strong>of</strong> such microresonators is <strong>of</strong> interest for both fundamental (e.g. cavityquantum electrodynamics 7,8 ) <strong>and</strong> applied studies (e.g. the development <strong>of</strong> <strong>optical</strong> networks 5 ). Recent work 9 has reportedon the coupling between quantum dots <strong>and</strong> microspheres with the result being lasing at wavelengths between 1240 <strong>and</strong>1780 nm at sub microwatt threshold. Applications have also been identified in chemical <strong>and</strong> biological sensing wherebythe evanescent portion <strong>of</strong> the electromagnetic field interacting with target species on or near the microsphere surfacegives rise to a shift in the resonant wavelength <strong>of</strong> a sphere mode. 10,11 This shift can be calibrated to yield theconcentration <strong>of</strong> the target analyte. The high Q-factor <strong>of</strong> the passive microspheres used in these studies leads to a cavityenhancement effect equating to effective interaction path lengths <strong>of</strong> up to tens <strong>of</strong> metres.♦ Tel: +353 21 490 4897, fax: +353 21 490 4880, email: brian.shortt@cit.iePhoton Management II, edited by John T. Sheridan, Frank Wyrowski, Proc. <strong>of</strong> SPIE Vol. 6187,618708, (2006) · 0277-786X/06/$15 · doi: 10.1117/12.662831Proc. <strong>of</strong> SPIE Vol. 6187 618708-1
In this paper we will give an overview <strong>of</strong> the whispering gallery mode depiction <strong>of</strong> the electromagnetic field within adielectric microsphere. Particular attention will be drawn to the description <strong>of</strong> the spatial distribution <strong>of</strong> theelectromagnetic energy including the evanescent portion <strong>of</strong> the field. We will describe how we use a suitably sized silicafibre taper to efficiently couple light into <strong>and</strong> out <strong>of</strong> the microsphere via evanescent wave coupling <strong>and</strong> the potential <strong>of</strong>using angle polished fibres to achieve similar coupling results. The fabrication <strong>of</strong> the spheres used in this work will bebriefly discussed. We are working with microspheres fabricated from two different erbium <strong>doped</strong> glasses. The firstmaterial is a novel heavy metal <strong>fluoride</strong> glass, ZBNA, optimised for its ability to act as a host for erbium. The secondmaterial is a commercial Schott glass IOG-2, a potassium-barium-alumino <strong>phosphate</strong> glass with doping levels <strong>of</strong> 2 %Er 2 O 3 <strong>and</strong> 3 % Yb 2 O 3 by weight. We have constructed a fibre taper production rig based on a scanning mirror <strong>and</strong> a CO 2laser heat source. Practical considerations <strong>and</strong> techniques involved in the production <strong>of</strong> low loss adiabatic fibre tapers bythis method will be discussed. Finally results from our investigations into microspherical lasers fabricated from the two<strong>doped</strong> glass materials will be presented <strong>and</strong> future avenues <strong>of</strong> investigation discussed.2. THEORETICAL CONSIDERATIONSIn this paper we will provide some insight into electromagnetic resonances existing in a microsphere. Efficient couplingto a microsphere requires that the propagation modes <strong>of</strong> light in the coupling element match the WGMs within thesphere. The use <strong>of</strong> quantum tunnelling via an evanescent wave component <strong>of</strong> the light field is used for this purpose <strong>and</strong>we present how one can ensure that the coupling technique satisfies the mode-matching requirements when a half-taperfibre is used as the coupling component. Finally, we examine a second coupling technique based on angle-polishedfibres.2.1 Whispering gallery modesIn the geometrical-optic model, if a ray strikes the microsphere glass-air interface at an angle <strong>of</strong> incidence greater thanthe critical angle, TIR will occur. The ray is reflected <strong>and</strong> due to the symmetry <strong>of</strong> the cavity strikes the glass-airinterface again at the same angle. In the case <strong>of</strong> large microspheres i.e. radius >> wavelength <strong>of</strong> trapped light (a >> λ),the light ray will be trapped by this mechanism <strong>and</strong> can propagate continuously around the inside wall giving rise to ast<strong>and</strong>ing wave, hence the concept <strong>of</strong> resonant modes. The integer number <strong>of</strong> these wavelengths around a singlerevolution can be denoted by the equatorial mode number, l.arφθ(a)(b)Fig. 1. WGM in a microsphere. (a) Ray propagation around the sphere by TIR; (b) Spherical coordinate system.The momentum p <strong>of</strong> a photon is p = ħk = 2πħ/λ where ħ is Planck’s constant divided by 2π <strong>and</strong> k is the wavenumberinside the sphere. The angular momentum, ħl, <strong>of</strong> the photon when it strikes the surface with near glancing incidence is ħl= 2πrħn/ λ where n is the refractive index <strong>of</strong> the sphere. We see that the integer l is the angular momentum <strong>of</strong> the photon<strong>of</strong> unit ħ <strong>and</strong> is going into the page in Fig. 1 (a). An important variable describing the resonance condition is the sizeparameter, x l (n) = 2πa/ λ.A realistic mathematical description <strong>of</strong> the electromagnetic field patterns in a microsphere begins with the solution <strong>of</strong> theHelmholtz equation in spherical coordinates. 12 The solution is obtainable from the scalar wave equation22 2∇ ψ ( r)+ n k ψ ( r)= 0(1)Proc. <strong>of</strong> SPIE Vol. 6187 618708-2
y assuming the polarization is constant. There are four solutions to Eqn. (1) corresponding to the transverse electric(TE) <strong>and</strong> transverse magnetic (TM) components <strong>of</strong> the sphere electric <strong>and</strong> magnetic fields. Spherical Bessel (Hankel)functions describe the radial field inside (outside) the sphere which are given byrrTEjl( nkr)X ( θ,φ)r ≤ a⎧lm( , ⎨E r θ,φr) =(1)(1)j ( nkr)h ( kr) / h ( ka)X ( θ,φ)r > a⎩B TErrBTMlr1( r,θ,φ)= − ∇ × E(r,θ,φ)kr θ φ⎧llm( , , ) =(1)(1)j ( nkr)hlllrj ( nkr)Xl( kr) / hl( θ,φ)r( ka)Xlmlm( θ,φ)r ≤ ar > a⎨⎩1E TMrr( r,θ,φ)= − ∇ × B(r,θ,φ)rε () kwhere j l (h (1) l ) are spherical Bessel functions (Hankel functions <strong>of</strong> the first kind) <strong>of</strong> order l <strong>and</strong> X lm <strong>and</strong> Y lm are vectorspherical harmonic functions. These latter two functions describe the sinusoidal nature <strong>of</strong> the field corresponding toreflections <strong>of</strong> the ray <strong>of</strong>f the sphere surface.Three mode numbers n, l, <strong>and</strong> m are used to characterise the radial, equatorial <strong>and</strong> polar components <strong>of</strong> theelectromagnetic field. Mode number n (n = 1, 2, 3,…) gives the number <strong>of</strong> maxima in the radial electromagnetic fielddistribution. The fundamental (n = 1) TM radial mode is depicted in Fig. 2 (a). The second mode number, m (m = −l, −l+ 1,…, 0,…, l − 1, l), describes the number <strong>of</strong> maxima in the sinusoidal variation in field intensity in the equatorial orlatitudinal direction. Finally the mode number, l, describes the field intensity distribution in the polar or longitudinaldirection <strong>and</strong> can take values l = 0, 1, 2,… with the number <strong>of</strong> maxima present in the polar field distribution been givenby l − |m| + 1.(2)0.50.5I.00—-0.5-0.5—1-1-1 -fl 0 fl 1-1 -05 0 05(a)(b)Fig. 2. Calculated intensity distribution <strong>of</strong> the TM mode in the equatorial plane (a) for n = 1 <strong>and</strong> l = 30 with x =24.623 (b) <strong>and</strong> for n =2 <strong>and</strong> l = 30 with x = 27.978. The wavelength is 1.55 µm <strong>and</strong> the sphere radius is normalized to unity in both cases.For a perfect sphere (zero ellipticity), modes with the same l but different m values have a 2l+1 degeneracy <strong>and</strong> so themode numbers n <strong>and</strong> l are sufficient to describe the WGM. In reality some ellipticity exists in the sphere which removesthis degeneracy. For minimal mode volumes one wants n to be small <strong>and</strong> m ≈ l as seen in Fig. 3. The spheres used in thepresent studies have radii in the range 50-250 µm with
1.:1.21.21.11.10.90.60.70.60.90.60.70.6(a)0 0.5(b)0 0.51.21.21.11.10.90.80.70.60.90.60.70.60 0.50 0.5(c)(d)Fig. 3. Azimuthal intensity distribution for TM modes with (a) n = 2, l-|m| = 1, (b) n = 1, l-|m| = 1, (c) n = 1, l - |m| = 2,(d) n = 1, l - |m| = 0. The wavelength is 980 µm <strong>and</strong> the sphere radius is normalized to unity.The fundamental mode in Fig. 3 (d) is located on the equatorial plane <strong>of</strong> the sphere. Although modes with l - |m| > 0travel with greater inclinations with respect to the equator, they still have the same resonant wavelength as thefundamental mode since the curvature <strong>of</strong> the sphere precisely compensates. The path length for l - |m| > 0 modes in (a)to (d) are all equal i.e. they are degenerate. Therefore the equatorial mode number, m, is superfluous when describing theresonance wavelength⎤⎡The quantum mechanical analogy <strong>of</strong> morphology dependent resonances 13 is shown in Fig. 4 (a). An effective radialpotential, comprising <strong>of</strong> the well potential <strong>and</strong> centrifugal potential at the surface, ensures that the propagating photonsremain confined to the well near the sphere surface. Classically, as long as the energy <strong>of</strong> the bound state photon is belowthe level <strong>of</strong> the potential barrier the photon cannot leak out <strong>of</strong> the potential well <strong>and</strong> into the forbidden regions.However, the wave function has a non-zero probability outside the potential well, thus giving rise to whispering gallerymode losses. The radial Schrödinger equation is <strong>of</strong> the form2d ψ ( r)− +l(l + 1)V ( r)+ − E ψ ( r)= 0(3)dr2⎢⎣where V(r) is the total effective potential, l is the equatorial mode number <strong>and</strong> E is the total energy (equal to k 2 ). Theeffective potential is a function <strong>of</strong> the radial position <strong>and</strong> is governed by the local refractive index <strong>and</strong> the wavelength.The effective potential in Fig. 4 (a) is given by2 22k (1 ⎧ − n ) + l(l + 1) / rr ≤ aV l( r)= (4)⎨2l(l + 1) / rr > a⎩r2⎥⎦Proc. <strong>of</strong> SPIE Vol. 6187 618708-4
⎛⎜⎝1.61.611.41.20.60.6Nk\IMicrosphere/airinterface—EffscflvsPctsItL,UI1IR= 0.8 micronsI = 100= 980 nmo =n =1.4507o =1Arb. normalisationsMicrosphere/Fiber Interface0.43.5 4 4.5 5 5.5 6 6.5 7 7.5Radial Position, (rn)r/r(a)(b)Fig. 4. (a) Effective potential for a silica microsphere with l = 24. The wavefunction (dashed) is only representative. (b) Overlap <strong>of</strong>the microsphere TM mode <strong>and</strong> fibre taper evanescent fields (fibre diameter, 2a = 1.6 µm, l = 100).Turning points are defined where the difference between the total energy <strong>and</strong> effective potential is zero. These aredefined asR1= ( l + 1/ 2) / kn(5)R2= ( l + 1/ 2) / k(6)Photons between R 1 <strong>and</strong> the sphere-air interface are the classically predicted bound photons, while those photons outsidethe sphere, between R 2 <strong>and</strong> the sphere-air interface, are evanescent.The continuity <strong>of</strong> the tangential components <strong>of</strong> the electric <strong>and</strong> magnetic fields at the sphere surface (see Eqn. (2)) mustsatisfy a characteristic equation. 14 The position <strong>and</strong> width <strong>of</strong> the resonances are obtained by numerically solving thischaracteristic equation.′(1) ′−2b[ nkajl( nka)] [ kahl( ka)]n=(7)(1)jl( nka)hl( ka)where b is the polarization (equal to 1 for TM modes <strong>and</strong> 0 for TE modes). The prime denotes differentiation withrespect to the argument. The solution yields discrete values <strong>of</strong> frequency at which resonances are possible. In practice,the locations <strong>of</strong> these resonances are found by scanning a tuneable diode laser over the free spectral range <strong>of</strong> the sphere.The solution to Eqn. (7) requires a significant amount <strong>of</strong> computational time as the resonances have sharp Lorentzianline-shapes. Schiller 15 has used asymptotic formulas to yield an approximation for the resonance frequency in terms <strong>of</strong>the size parameter, x (n) l , up to order α = 81/ 3⎞8( n)ν ζ= − +/n νdα( m,ζn)xl (8)α 3 2 ( α +⎟1) / 2m mv ( m −⎠1)2 α 0=∑where ν = l + ½, m = n s /n a , where n s is the refractive index <strong>of</strong> the sphere <strong>and</strong> n a is the refractive index <strong>of</strong> the surroundingmedium, ζ n is the nth zero <strong>of</strong> the Airy function. The coefficients <strong>of</strong> the expansion are given by the polarizationdependant term d α (m, ζ n ). Identification <strong>of</strong> these resonances is achieved by measuring the separations <strong>of</strong> the resonancefrequencies x (n) l - x (n) l-1 . The widths <strong>of</strong> the resonances, Γ (n) l , are given at FWHM by Lam 16 as2 2 −[ Nx n ( x)] 1⎧⎨⎩( n)Γl = 2l(9)where n l is the spherical Neumann function, <strong>and</strong>2n −1TEN =2 2 2 2( n −1)[µ + ( µ / n −1)]TM(10)where µ = ν/x with x evaluated at x (n) l .Proc. <strong>of</strong> SPIE Vol. 6187 618708-5
⎥⎦2.2 Mode matching between a microsphere <strong>and</strong> fibre taperIn order to effectively couple light into a microsphere, the angular momentum <strong>and</strong> propagation constant <strong>of</strong> the pumpbeam must match that <strong>of</strong> the WGMs within the sphere such that there is phase matching at the point <strong>of</strong> closest contact.We achieve this by using a suitably sized silica fibre taper to couple light into <strong>and</strong> out <strong>of</strong> the microsphere via evanescentwave coupling.22[ ] 2The eigenvalue equations <strong>of</strong> the Helmholtz equation for the fibre are 17( ) ( ) ( ⎡⎡ ⎤J ′ ′′nha Knqa ncoreJnha)⎡ n ⎤ ⎤ β−2−2⎢⎣haJn+( ha)qaKn( qa)⎢ ⎥⎦ ⎣haJn( ha)=⎢⎣k⎥⎦( qa)+ ( ha)for HE nm <strong>and</strong> EH nm modes where J n (K n ) is a Bessel function (modified Hankel function <strong>of</strong> the second kind) <strong>of</strong> order n, βis the propagation constant, n core is the index <strong>of</strong> the core, n clad is the index <strong>of</strong> the cladding, h 2 =n 2 corek 2 -β 2 is the radialpropagation constant in the core, q 2 =n 2 cladk 2 -β 2 is the radial propagation constant in the cladding, <strong>and</strong> the prime denotesdifferentiation with respect to the argument. We use the Sellmeier dispersion formula to determine refractive indices atroom temperature. The transcendental equation in Eqn. (11) is solved numerically for the fundamental HE 11 fibre modefor specific taper diameters. The propagation constant <strong>of</strong> the sphere is β=kl/x nlm where x nlm is the size parameterdetermined from Eqn. (6). The taper <strong>and</strong> sphere are phase matched when the difference between propagation constantsis zero.If efficient coupling is to be achieved using tapers or half-tapers, it is imperative that the taper be only a few microns indiameter. Taper coupling provides a simple <strong>and</strong> potentially compact method <strong>of</strong> exciting the sphere. We fabricate lowloss3 to 4 µm diameter tapers using a 25 W CO 2 Synrad laser. Fibre taper coupling efficiencies <strong>of</strong> more than 99 % havebeen reported 18 which depends on the refractive index <strong>of</strong> the sphere, sphere dimensions, taper fibre dimensions <strong>and</strong> therelative position <strong>of</strong> the components.2.3 End-polished fibresWe have recently begun investigating how end-polished fibres can be used to excite resonant modes in microspheres.This device is a hybrid <strong>of</strong> the more traditional prism <strong>and</strong> taper couplers. 19 The fabrication consists <strong>of</strong> polishing the end<strong>of</strong> a single mode fibre to an angle sufficient to obtain efficient coupling into the sphere. By placing the sphere at thepolished surface TIR conditions will be met, just as in the case <strong>of</strong> prism coupling. Therefore the phase matchingcondition is controlled by the polish angle, θ=sin -1 (n sphere /n fibre ). The effective index <strong>of</strong> the resonant mode in the sphere isfound from n sphere =ln s / x (n) l where n s is the refractive index <strong>of</strong> the sphere material, for example silica, as determined fromthe Sellmeier dispersion formula. The effective index <strong>of</strong> the fibre is assumed to be β/k where β is evaluated from Eqn.(11) for the fundamental HE 11 mode. Fig. 5 shows the required polish angle as a function <strong>of</strong> sphere radius for n = 1 <strong>and</strong>n = 2 modes at wavelengths <strong>of</strong> 980 nm <strong>and</strong> 1480 nm.(11)= 980 nnNA = 0.18N =1R = 2.16 micronsN =1.4507= I .4395IndexDifference— 0.78%V = 2.4879N =1.4456= 1480 rrrrrNA = 0.31N =1R l.84rrN =1.4449N =1.4112IrrdexDiffererrce— 2.38%V = 2.4073N =1.4290(a)Fig. 5. Calculated polish angle for wavelengths <strong>of</strong> (a) 980 nm, <strong>and</strong> (b) 1480 nm in silica.Sphere Radius (rrr)(b)Among the advantages <strong>of</strong> end-polished fibres are their robustness <strong>and</strong> small package size. One disadvantage <strong>of</strong> usingfibre tapers is the competing requirement <strong>of</strong> small diameter to maximise the evanescent field against a suitably largeProc. <strong>of</strong> SPIE Vol. 6187 618708-6
diameter for good phase matching. For example, a silica fibre diameter <strong>of</strong> 6 µm is required to phase match anEr:ZBLAN sphere <strong>of</strong> diameter 100 µm. 20 The fraction <strong>of</strong> the field in the core <strong>of</strong> the fibre is almost 100 % for thisdiameter taper. Further advantages <strong>of</strong> end-polished fibres are in ease <strong>of</strong> alignment <strong>of</strong> the sphere <strong>and</strong> fibre as theinteraction region is larger <strong>and</strong> good coupling efficiencies <strong>of</strong> up to 60 %. 193.1 Experimental setup3. EXPERIMENTWe are working towards the <strong>characterisation</strong> <strong>of</strong> microspherical lasers fabricated from two different erbium <strong>doped</strong>glasses. The first material is a novel heavy metal <strong>fluoride</strong> glass, ZBNA 21 with 0.1% Er 3+ doping. The second material isa commercial Schott glass IOG-2, a potassium-barium-alumino <strong>phosphate</strong> glass 22 with doping levels <strong>of</strong> 2 % Er 2 O 3 <strong>and</strong> 3% Yb 2 O 3 by weight. Microspheres with diameters between 10 µm <strong>and</strong> 200 µm are formed using a 2 kW microwaveplasma torch. 23 The system can be optimised for different glass materials by changing the plasma gas feed ratio <strong>and</strong>discharge power.The experimental arrangement is presented schematically in Fig. 6. Excitation <strong>of</strong> the erbium active medium within themicrospheres is achieved using tuneable diode lasers operating at 980 <strong>and</strong> 1480 nm. The pump light is sent through an<strong>optical</strong> isolator to prevent back reflections into the laser. It then passes through a manual variable attenuator, whichenables us to study the lasing characteristics <strong>of</strong> the microsphere as a function <strong>of</strong> the pump beam power.DL980 nm1480 nmIsolatorOSAVariable10: 90 90%attenuatorcouplerFibre 10%WDMPowermeterHalf/full taperxyzstageSphereGSFPD/DSOFig. 6. Experimental set-up. Full line indicates 980/1480 nm. Dashed line indicates 1.55 µm. DL: Diode laser, WDM: Wavelengthdivision multiplexer, OSA: Optical spectrum analyser, GS: Grating spectrometer, FPD: Fast photo diode, DSO: Digital storageoscilloscope.An IDIL 10:90 coupler is used to split the light into a 10% channel for monitoring the pump power <strong>and</strong> a 90% channelwhich is used as the source <strong>of</strong> WGM excitation in the microsphere. This is coupled into the fibre taper via a wavelengthdivision multiplexer (WDM). Efficient coupling between sphere <strong>and</strong> taper is achieved by aligning the microsphereequator precisely with the taper via the use <strong>of</strong> piezo controlled precision translation stages. Cooperative upconversion inthe microsphere is evident from visible green light strong enough to be observed with the naked eye. A Zeissmicroscope connected to a monitor via a CCD camera is used for general imaging in the experiment <strong>and</strong> also formonitoring the alignment position <strong>of</strong> the taper <strong>and</strong> microsphere. Experiments as a function <strong>of</strong> sphere-taper gap areunderway but the results presented in this paper are for the case <strong>of</strong> sphere <strong>and</strong> taper in physical contact.The 1.55 µm radiation within the microsphere is evanescently coupled out into the exciting fibre or a separate secondtaper aligned at the sphere equator but on the opposite side <strong>of</strong> the sphere. The light passes through the WDM, whichseparates out the reflected pump component at 980/1480 nm from the lasing component at 1.55 µm. The 1.55 µm lasersignal is sent to an Anritsu <strong>optical</strong> spectrum analyser (OSA) for analysis <strong>of</strong> its spectral properties. A gratingspectrometer (Horiba Jobin Yvon Triax 190, resolution 0.3 nm or Ocean Optics USB 4000, resolution 0.5 nm) witheither free space or fibre coupling is used to measure the microsphere visible emission spectrum.3.2 Low cost fibre taper productionThe three most widely exploited means <strong>of</strong> achieving micron-sized tapers are by flame, 18,24 CO 2 laser, 25 <strong>and</strong> to a lesserextent by fusion splicer. 20 CO 2 lasers present a largely stable <strong>and</strong> easily controllable method <strong>of</strong> heating a fibre. AirProc. <strong>of</strong> SPIE Vol. 6187 618708-7
Puill lengtln (iuniuncurrents or other deleterious environmental effects bear no consequence on the power output or the ability to scan thebeam across the fibre with a galvanometer mirror. The benefit <strong>of</strong> precise control <strong>of</strong> the hot-zone on a fibre yields theoption <strong>of</strong> producing any desired taper pr<strong>of</strong>ile. 26 The physical process <strong>of</strong> heating a fibre with a laser beam involves thefibre absorbing the radiation <strong>and</strong> heating from the inside, while for a flame, the process involves heating the surface <strong>of</strong>the fibre. This ultimately places a stricter limit on the minimum taper diameter attainable for a given CO 2 laser power ascompared with a flame. 27 Previous attempts <strong>of</strong> producing tapers using the CO 2 technique have achieved a diameter <strong>of</strong> 4.6µm with a CO 2 laser power <strong>of</strong> 13 W <strong>and</strong> FWHM spot size <strong>of</strong> 820 µm using a galvanometer-scanning mirror. 253.2.1 MethodWe have developed a low cost method for fabricating fibre tapers which <strong>of</strong>fers good reproducibility. This method relieson a geared stepper motor rather than a galvanometer to scan the laser beam across the fibre taper with a mirror. Afuture publication 28 will describe in detail the procedure <strong>and</strong> requirements for pulling adiabatic tapers 17,26 with lossestypically in the range <strong>of</strong> 0.1 to 0.3 dB. A 12.5 cm focal length Zn-Se lens focuses the laser beam onto the fibre with aspot size (1/e 2 ) <strong>of</strong> approximately 500 µm that is 5.5 cm in front <strong>of</strong> the scanning mirror. The stepper motor has aresolution <strong>of</strong> 1.8×10 -3 degrees/step, which corresponds to a length <strong>of</strong> ~1.7 µm/step on the fibre. The discrete nature <strong>of</strong> thestep size is smeared-out by the size <strong>of</strong> the beam at the focus. Two motorised translation stages pull the fibre with aresolution <strong>of</strong> 1 µm. As the taper is being drawn, the transmission loss through the fibre is monitored with a photodiode<strong>and</strong> oscilloscope. In t<strong>and</strong>em with the taper pull, the laser power is ramped in a manner which follows a fourth-orderpolynomial optimised to produce 3 <strong>and</strong> 4 µm diameter tapers.3.2.2 ResultsFig. 7 shows the power transmission through a length <strong>of</strong> fibre as a taper is drawn. In Fig. 7(a) there are oscillationsduring the middle section <strong>of</strong> the pull. These oscillations are thought to be mode coupling between the core <strong>and</strong> claddingmodes. Fig. 7(b) shows that is it possible to eliminate this modal coupling with a sight decrease in laser power duringthe pull. There is no significant difference in the final transmission loss with values <strong>of</strong> 0.15 dB <strong>and</strong> 0.21 dB for Fig. 7(a)<strong>and</strong> (b) respectively. Examination <strong>of</strong> these tapers reveals that the taper angle is well below that required to meet theadiabatic criteria as depicted by the delineation curve. 17 A typical measured taper pr<strong>of</strong>ile is shown in Fig 7(c) with finaldiameter <strong>of</strong> 3 µm.ci 4030(a) (b) (c)5 10 15 20 25 30 30 40Pull length lmml0 10 20 30 40 50 60 70 80Distance eleng tben axis, (mm)Fig. 7. Transmission loss measurements: (a) with <strong>and</strong> (b) without multi-mode coupling during the middle portion <strong>of</strong> the pull. (c)typical taper pr<strong>of</strong>ile, 3µm diameter, pull length 40mm, scan length 7mm <strong>and</strong> initial taper diameter 125 µm.903.3 ZBNA microsphere resultsThis section presents results obtained through the pumping <strong>of</strong> a 0.1% erbium <strong>doped</strong> ZBNA microsphere <strong>of</strong> diameter 60µm. Pump light about 980 nm was coupled in to the sphere via a half tapered <strong>optical</strong> fibre <strong>of</strong> diameter ~ 2 µm at thepoint <strong>of</strong> contact. The sphere <strong>and</strong> taper were in physical contact. The same taper was used to probe for 1.55 µm radiationby evanescent outcoupling, through a WDM <strong>and</strong> into an <strong>optical</strong> spectrum analyser. Despite the study <strong>of</strong> several differentsphere-taper combinations we failed to observe any infra-red emissions from this heavy metal <strong>fluoride</strong> glass sample.Proc. <strong>of</strong> SPIE Vol. 6187 618708-8
During all experiments the microsphere was observed to fluoresce in the green with sufficient intensity as to be visible tothe naked eye. This is the well known two-photon process <strong>of</strong> cooperative upconversion 4,29 Absorption <strong>of</strong> a laser photonat 980 nm pumps the erbium atom from the ground state 4 I 15/2 to the 4 I 11/2 excited state (lifetime < 1 µs). From thisexcited state the atom can either a) undergo non-radiative relaxation to the metastable 4 I 13/2 state (lifetime ~10 ms) or b)absorb a second pump laser photon to enter the 4 F 7/2 excited state – excited state absorption. In the case <strong>of</strong> a) the atomcan return to the ground state after ~10 ms via the spontaneous emission <strong>of</strong> an infra-red photon at 1.55 µm. Alternativelythe atom can relax to the ground state via stimulated emission <strong>and</strong> this forms the basis for 1.55 µm lasing in themicrosphere. The multiphoton process described in b) is a source <strong>of</strong> possible quenching <strong>of</strong> the lasing at 1.55 µm. If the980 nm pump intensity is too high the two photon absorption rate will lead to efficient population <strong>of</strong> the 4 F 7/2 state. Thisstate can relax to either the 2 H 11/2 or 4 S 3/2 states <strong>and</strong> these states further decay to the ground state with photon emission at520 <strong>and</strong> 540 nm respectively.Evidence <strong>of</strong> the efficient population <strong>of</strong> these two states is provided in Fig. 8. Fig. 8(a) presents wavelength scans <strong>of</strong> themicrosphere fluorescence from 475 to 625 nm as a function <strong>of</strong> pump power launched in to the taper. As a half taper wasused, no measure <strong>of</strong> the coupling efficiency between taper <strong>and</strong> sphere was possible. The peak at 520 nm is attributed toerbium relaxations to the ground state from the 2 H 11/2 excited state <strong>and</strong> the peak at 540 nm corresponds to the 4 S 3/2 state.Confirmation <strong>of</strong> the multiphoton nature <strong>of</strong> the cooperative upconversion process in found in Fig. 8(b) where theintegrated green intensity for the 2 H 11/2 state as a function <strong>of</strong> launched pump power is presented. The linear fit has slope<strong>of</strong> two as expected from the power law dependence <strong>of</strong> n-photon processes.amplitude (arb. units)10080604020Er:ZBNA250 µW350 µW450 µW550 µW650 µW(a)fluorescence intensity (arbitrary units)100001000Integrated green fluorescence intensityLinear fit(b)0475 500 525 550 575 600 625wavelength (nm)100100 1000launched pump power (µW)Fig. 8. (a) Upconversion green fluorescence spectrum as a function <strong>of</strong> power launched into half-taper fibre. (b) Integrated greenfluorescence intensity as a function <strong>of</strong> launched pump power.3.4 IOG-2 microsphere resultsA second commercial <strong>phosphate</strong> glass (Schott IOG-2) with doping levels <strong>of</strong> 2 % Er 2 O 3 <strong>and</strong> 3 % Yb 2 O 3 by weight wasalso studied. A previous report 30 has shown this material to be suitable for sustaining continuous-wave oscillation in amicrosphere laser. Again half-taper coupling was employed to couple pump light about 980 nm into a 130 µm diameterIOG-2 microsphere. Fig. 9 shows a laser emission spectrum from the microsphere as detected by the exciting taper.Proc. <strong>of</strong> SPIE Vol. 6187 618708-9
1.6x10 -71.4x10 -7IOG-2intensity (arb. units)1.2x10 -71.0x10 -78.0x10 -86.0x10 -84.0x10 -82.0x10 -80.01562 1563 1564 1565 1566 1567 1568wavelength (nm)Fig. 9. IOG-2 spectrum showing infra-red laser emission about 1.56 µm.Three distinctive lasing modes can be seen in Fig. 9. Similar multimode lasing has been reported previously. 20 Work iscontinuing to determine the lasing threshold power for a microspherical laser fabricated from IOG-2 glass. Thesemeasurements require adiabatic full tapers <strong>and</strong> a single mode narrow linewidth pump source which are currently beenintegrated in to our experimental setup.4. CONCLUSIONSSome subtleties <strong>of</strong> evanescent wave coupling between <strong>optical</strong> fibre components <strong>and</strong> microcavities have been presented.A low cost CO 2 laser based fibre taper production method which we believe will be <strong>of</strong> interest to other researchers hasbeen described. We have observed inf<strong>rare</strong>d radiation in IOG-2 <strong>phosphate</strong> glass microspheres pumped at 980 nm. Thecompetition between cooperative upconversion leading to green emissions <strong>and</strong> inf<strong>rare</strong>d generation in a ZBNAmicrosphere has been discussed. Future plans include the study <strong>of</strong> the interaction <strong>of</strong> a microspherical laser array <strong>and</strong> theinteraction between the evanescent field <strong>of</strong> a microsphere with a cloud <strong>of</strong> cold atoms. In studying a laser array, weintend to study coupled oscillators including synchronisation <strong>and</strong> coherence 31 <strong>and</strong> enforced chaotic behaviour. 32ACKNOWLEDGEMENTSWe wish to acknowledge Patrice Féron for the supply <strong>of</strong> bulk glass <strong>and</strong> the subsequent fabrication <strong>of</strong> microspheres. Thiswork is supported by Science Foundation Irel<strong>and</strong> project number 02/IN1/I28. DOS acknowledges support from IRCSETthrough the Embark Initiative.REFRENCES1. C. G. B. Garrett, W. Kaiser <strong>and</strong> W. L. Bond, “Stimulated emission into <strong>optical</strong> whispering modes <strong>of</strong> spheres”,Phys. Rev. 124, 1807-1809, 1961.2. T. Baer, “Continuous-wave laser oscillation in a Nd:YAG sphere”, Opt. Lett. 12, 392-394, 1987.3. B. Shortt, R. Carey <strong>and</strong> S. Nic Chormaic, “Characterisation <strong>of</strong> Er:ZBNA microsphere lasers”, Proc. SPIE 5827,47-57, Dublin, 2005.4. W. von Klitzing, E. Jahier, R. Long, F. Lissillour, V. Lefèvre-Seguin, J. Hare, J-M. Raimond <strong>and</strong> S. Haroche,“Very low threshold green lasing in microspheres by up-conversion <strong>of</strong> IR photons”, J. Opt. B: QuantumSemiclass. Opt. 2, 204-206, 2000.5. T. Bilici, S. Isci, A. Kurt <strong>and</strong> A. Serpengüzel, “Microsphere based channel dropping filter with an integratedphotodetector”, IEEE Photon. Technol. Lett., 16, 476-478, 2004.Proc. <strong>of</strong> SPIE Vol. 6187 618708-10
6. T. J. Kippenberg, S. M. Spillane, B. Min <strong>and</strong> K. J. Vahala, “Theoretical <strong>and</strong> experimental study <strong>of</strong> stimulated <strong>and</strong>cascaded Raman scattering in ultra-high Q <strong>optical</strong> microcavities”, IEEE J. <strong>of</strong> Selected Topics in Quant. Electron.10, 1219-1228, 2004.7. J. Campillo, J. D. Eversole <strong>and</strong> H-B Lin, “Cavity quantum electrodynamics enhancement <strong>of</strong> stimulated emissionin microdroplets”, Phys. Rev. Lett. 67, 437-440, 1991.8. F. Treussart, J. Hare, L. Collot, V. Lefèvre, D. S. Weiss, V. S<strong>and</strong>oghdar, J. M. Raimond <strong>and</strong> S. Haroche,“Quantized atom-field force at the surface <strong>of</strong> a microsphere”, Opt. Lett. 19, 1651-1653, 1994.9. S. I. Shopova, G. Farca, A. T. Rosenberger, W. M. S. Wickramanayake <strong>and</strong> N. A. Kotov, “Microspherewhispering-gallery-mode laser using HgTe quantum dots”, Applied Physics Letters 85, 6101-6103, 2004.10. I. White, N. Hanumegowda <strong>and</strong> X. Fan, “Subfemtomole detection <strong>of</strong> small molecules with microsphere sensors”,Optics Letters 30, 3189-3191, 2005.11. F. Vollmer, D. Braun, A. Libchaber, M. Khoshsima, I. Teraoka <strong>and</strong> S. Arnold, “Protein Detection by Opticalshift <strong>of</strong> a Resonant Microcavity”, Applied Physics Letters 80, 4057-4059, 2002.12. T. Mashide, “Study <strong>of</strong> spherical microlasers levitated in an ion trap”, Ph.D. Thesis, Kochi University <strong>of</strong>Technology, 2002.13. B.R. Johnson, “Theory <strong>of</strong> morphology-dependent resonances: shape resonances <strong>and</strong> width formulas”, J. Opt. Soc.Am. A 10, 343-352, 1993.14. S.M. Spillane, “Fibre-coupled ultra-high-Q microresonators for nonlinear <strong>and</strong> quantum optics”, Ph.D. Thesis,California Institute <strong>of</strong> Technology, 2004.15. S. Schiller, "Asymptotic expansion <strong>of</strong> morphological resonance frequencies in Mie scattering", Appl. Opt. 32,2181-2185, 1993.16. C.C. Lam, P.T. Leung <strong>and</strong> K. Young, “Explicit asymptotic formulas for the positions, widths, <strong>and</strong> strengths <strong>of</strong>resonances in Mie scattering”, J. Opt. Soc. Am. B 9, 1585-1592, 1992.17. A.W. Snyder <strong>and</strong> J.D. Love, Optical Waveguide Theory, Kluwer Academic Publishers, 2000.18. S.M. Spillane, T.J. Kippenberg, O.J. Painter <strong>and</strong> K.J. Vahala, “Ideality in a fibre-faper-coupled microresonatorsystem for application to cavity quantum electrodynamics”, Phys. Lett. Rev. 91, 043902, 2003.19. V. S. Ilchenko, X. S. Yao <strong>and</strong> L. Maleki, “Pigtailing the high-Q microsphere cavity: a simple fibre coupler for<strong>optical</strong> whispering gallery modes”, Opt. Lett. 24, 723-725, 1999.20. F. Lissillour, D. Messager, G. Stéphan <strong>and</strong> P. Féron, “Whispering-gallery-mode laser at 1.56 µm excited by afibre taper”, Opt. Lett. 26, 1051-1053, 2001.21. M. Mortier, M. Génotelle, G. Patriarche, "Rare <strong>earth</strong> <strong>doped</strong> transparent glass-ceramics", presented at JournéeNanoparticule, Paris, 2000.22. G.C. Righini, C. Arnaud, S. Berneschi, M. Bettinelli, M. Brenci, A. Chiasera, P. Feron, M. Ferrari, M. Montagna,G. Nunzi Conti, S. Pelli, H. Portales, C. Siligardi, A. Speghini, L. Zampedri, “Integrated <strong>optical</strong> amplifiers <strong>and</strong>microspherical lasers based on erbium-<strong>doped</strong> oxide glasses”, Optical Materials 27, 1711-1717, 2005.23. P. Féron, "Whispering gallery modes as laser sources- a short review", in Quaderni di optica e fotonica, specialissue: Photonics & Optoelectronics, Winter School, Trento, 2001.24. L Tong, R.R. Gattass, J.B. Ashcom, S. He, J. Lou, M. Shen, I. Maxwell, <strong>and</strong> E. Mazur, “Subwavelength silicawires for lowloss <strong>optical</strong> wave guiding”, Nature 426, 816, 2003.25. T.E. Dimmick, G. Kakarantzas, T.A. Birks, <strong>and</strong> P.St.J. Russel, “Carbon dioxide laser fabrication <strong>of</strong> fused-fibrecouplers <strong>and</strong> tapers”, Appl. Opt. 38, 6845, 1999.26. T.A. Birks <strong>and</strong> Y.W. Li, “The Shape <strong>of</strong> Fibre Tapers”, J. Lightwave Technol. 10, 432, 1992.27. A. Grellier, N.K. Zayer, <strong>and</strong> C.N. Pannell, “Heat transfer modelling in CO laser processing <strong>of</strong> <strong>optical</strong> fibres”, Opt.Comm. 324, 152, 1998.28. J. Ward, D. O’Shea, B. J. Shortt <strong>and</strong> S. Nic Chormaic, “CO 2 laser based fabrication <strong>of</strong> tapered fibre devices”, (inpreparation for submission to Rev. Sci. Inst.).29. P. A. Krugh, M. G. Sceats, G. R. Atkins, S. C. Guy <strong>and</strong> S. B. Poole, “Intermediate excited-state absorption inerbium <strong>doped</strong> fibre strongly pumped at 980 mn”, Opt. Lett. 24, 1976-1978, 1991.30. C. Arnaud, M. Boustimi, M. Brenci, P. Féron, M. Ferrari, G. Nunzi Conti, S. Pelli amd G. Righini, “Microspherelaser in Er 3+ <strong>doped</strong> oxide glasses ”, Proc. SPIE 5622, 315-320, Venezuela, 2004.31. J. R. Terry, K. S. Thornburg, D. de Shazer, G. D. van Wiggeren, S. Zhu, P. Ashwin <strong>and</strong> R. Roy, “Synchronization<strong>of</strong> chaos in three lasers”, Phys. Rev. E 59, 4036-4043, 1999.32. K. S. Thornburg, M. Moller, R. Roy, T. W. Carr, R.-D. Li <strong>and</strong> T. Erneux, “Chaos <strong>and</strong> coherence in coupledlasers”, Phys. Rev. E 55, 3865-3869, 1997.Proc. <strong>of</strong> SPIE Vol. 6187 618708-11
134Appendix BA Heat-<strong>and</strong>-Pull Rig for FiberTaper Fabrication
REVIEW OF SCIENTIFIC INSTRUMENTS 77, 083105 2006Heat-<strong>and</strong>-pull rig for fiber taper fabricationJonathan M. Ward, Danny G. O’Shea, Brian J. Shortt, Michael J. Morrissey,Kieran Deasy, <strong>and</strong> Síle G. Nic ChormaicDepartment <strong>of</strong> Applied Physics <strong>and</strong> Instrumentation, Cork Institute <strong>of</strong> Technology, Bishopstown, Cork, Irel<strong>and</strong><strong>and</strong> Tyndall National Institute, Prospect Row, Cork, Irel<strong>and</strong>Received 6 April 2006; accepted 2 July 2006; published online 18 August 2006We describe a reproducible method <strong>of</strong> fabricating adiabatic tapers with 3–4 m diameter. Themethod is based on a heat-<strong>and</strong>-pull rig, whereby a CO 2 laser is continuously scanned across a length<strong>of</strong> fiber that is being pulled synchronously. Our system relies on a CO 2 mirror mounted on a gearedstepper motor in order to scan the laser beam across the taper region. We show that this system<strong>of</strong>fers a reliable alternative to more traditional rigs incorporating galvanometer scanners. We haveroutinely obtained transmission losses between 0.1 <strong>and</strong> 0.3 dB indicating the satisfactory production<strong>of</strong> adiabatic tapers. The operation <strong>of</strong> the rig is described in detail <strong>and</strong> an analysis on the producedtapers is provided. The flexibility <strong>of</strong> the rig is demonstrated by fabricating prolate dielectricmicroresonators using a microtapering technique. Such a rig is <strong>of</strong> interest to a range <strong>of</strong> fields thatrequire tapered fiber fabrication such as microcavity-taper coupling, atom guiding along a taperedfiber, <strong>optical</strong> fiber sensing, <strong>and</strong> the fabrication <strong>of</strong> fused biconical tapered couplers. © 2006American Institute <strong>of</strong> Physics. DOI: 10.1063/1.2239033I. INTRODUCTIONTechniques for evanescent coupling <strong>of</strong> light into microsphericalcavities include prism couplers, 1 <strong>optical</strong> fiber halfblockcouplers, 2 end-polished fibers, 3 <strong>and</strong> fiber tapers. 4 Fibertapers have proven to be the most attractive device forachieving near lossless coupling <strong>of</strong> light into microsphericalcavities <strong>and</strong> exciting the fundamental resonant mode. 4,5 Theoverlap <strong>of</strong> the taper <strong>and</strong> microsphere evanescent fields definesthe strength <strong>of</strong> this coupling. 6 The attainment <strong>of</strong> taperdiameters typically in the range <strong>of</strong> 1–4 m is critical tomaximize this coupling. For a 2 m diameter taper at awavelength <strong>of</strong> 1550 nm, the fraction <strong>of</strong> power in the core isnearly 96%. 7 Recent discussions on the form <strong>of</strong> the evanescentfield have shown the spatial extent <strong>of</strong> the radial component<strong>of</strong> the field to greatly increase for diameters less than3 m. 7,8 It has also been reported that efficient coupling <strong>of</strong>light into submillimeter sized silica microspheres is possiblefor taper diameters up to 4.5 m. 9The four most widely exploited means <strong>of</strong> achievingmicron-sized tapers are by flame, 5,10,11 CO 2 laser heating, 12micr<strong>of</strong>urnace, 13,14 <strong>and</strong>, to a lesser extent, fusion splicer. 4While subwavelength diameters have been shown to beachievable with the flame method, it presents significanttechnical challenges. 11 Firstly, the gas flow rate must be preciselyregulated in order to maintain a suitable temperature.The purity <strong>of</strong> the gas supply becomes increasingly importantfor smaller taper diameters due to contamination concerns.Air currents in the vicinity <strong>of</strong> the flame also pose a problem,thereby limiting the option <strong>of</strong> scanning the flame across alength <strong>of</strong> fiber <strong>and</strong> causing areas <strong>of</strong> uneven heating. Despitebeing able to produce submicron tapers with the micr<strong>of</strong>urnacemethod, the fibers cannot be controllably structured toproduce different taper pr<strong>of</strong>iles.As an alternative, CO 2 lasers present a largely stable <strong>and</strong>easily controllable method <strong>of</strong> heating a fiber. Air currents orother deleterious environmental effects bear no consequenceon the power output or the ability to scan the beam across thefiber with a mirror scanner. It is possible to precisely controlthe length <strong>of</strong> fiber to be heated i.e., the hot zone, therebyyielding any desired taper pr<strong>of</strong>ile. 15 The physical process <strong>of</strong>heating a fiber with a laser beam involves the fiber absorbingradiation <strong>and</strong> heating from the inside, whereas for a flame theprocess involves heating the surface <strong>of</strong> the fiber. There is aninverse square relationship between radius <strong>and</strong> heating for aCO 2 laser heat source, while for a flame heat source there issimply an inverse relationship between heating <strong>and</strong> radius.This ultimately places a stricter limit on the minimum taperdiameter attainable for a given CO 2 laser power as comparedwith a flame heat source. 16 Previous reported attempts <strong>of</strong>producing tapers using the CO 2 laser technique haveachieved a diameter <strong>of</strong> 4.6 m with a CO 2 laser power <strong>of</strong>13 W <strong>and</strong> full width at half maximum FWHM spot size <strong>of</strong>820 m using a galvanometer mirror scanner. 12 In this articlewe describe a reliable method <strong>of</strong> fabricating low loss3–4 m diameter tapers as well as the possibility <strong>of</strong> fabricatingbottle resonators using a 25 W CO 2 laser.In recent years, interest in the use <strong>of</strong> microsphericalresonators in cavity QED experiments has increased. 17 Theuse <strong>of</strong> such microcavities in these experiments requires thepossibility <strong>of</strong> tuning the resonance frequency <strong>of</strong> the microcavityto an atomic line. In principle, there are two mainmethods <strong>of</strong> achieving this: strain tuning <strong>and</strong> temperature tuning.Strain tuning can be used to sweep the resonant frequencythrough the cavity free spectral range FSR, whereastemperature tuning is limited to a fraction <strong>of</strong> the FSR. 18 Temperaturetuning is unsuitable as a st<strong>and</strong>-alone method <strong>and</strong> thefabrication <strong>of</strong> microspheres suitable for the strain tuning apparatusis difficult. A new type <strong>of</strong> prolate microcavity that0034-6748/2006/778/083105/5/$23.0077, 083105-1© 2006 American Institute <strong>of</strong> PhysicsDownloaded 13 Nov 2007 to 134.93.129.164. Redistribution subject to AIP license or copyright, see http://rsi.aip.org/rsi/copyright.jsp
083105-2 Ward et al. Rev. Sci. Instrum. 77, 083105 2006FIG. 1. Schematic <strong>of</strong> the taper fabrication rig. The dashed lines indicatecontrol lines or data transfer.<strong>of</strong>fers potentially greater flexibility in tuning the microcavityresonance frequency has recently been described theoreticallyin the literature. 19,20 Such cavities are termed bottleresonators. Strain tuning <strong>of</strong> these devices may tune the frequencyover several FSR, while temperature tuning over asingle FSR may only require a few tens <strong>of</strong> Kelvin. Anotherappealing feature compared with typical spherical microcavitiesis the stronger evanescent field at the bottle resonatorsurface due to the smaller resonator dimensions.Our fabrication method relies on the use <strong>of</strong> a gearedstepper motor to scan the laser beam rather than the moretraditional galvanometer. Implementation <strong>of</strong> our rig is trivial,requiring only interconnection <strong>of</strong> the stepper motor with thecontroller circuit. In contrast, galvanometer scanners requireproportional-derivative PD or proportional-integralderivativePID control, which can be tedious to tune correctly.From a mechanical perspective, the stepper motor hasa more robust design <strong>and</strong> better torque which negates anyeffects induced by the inertia <strong>of</strong> the mirror attached to theshaft <strong>of</strong> the motor <strong>and</strong> the overall scanning angle achievableis larger than that for a galvanometer scanner typically limitedto ±40°. Additionally, the stepper motor represents asignificant cost saving since the cost <strong>of</strong> a scanning galvanometersystem is typically in excess <strong>of</strong> US$1990, 21 whilethe cost <strong>of</strong> a Radionics hybrid stepper motor, gear box, <strong>and</strong>controller circuit is approximately US$210. 22 By choosingthe stepper motor scanner rather than a galvanometer scannerwe saved 15% on the total laser rig cost.The technique described is not only <strong>of</strong> interest for applicationsinvolving microresonator coupling; areas requiringthe fabrication <strong>of</strong> fused biconical tapered couplers will als<strong>of</strong>ind this inexpensive apparatus <strong>of</strong> use. This article describesthe procedure <strong>and</strong> requirements for pulling adiabatic fibertapers 15,23 with typical losses in the range <strong>of</strong> 0.1–0.3 dB at980 nm. We also report on successful attempts at fabricatingbottle resonators to suitable dimensions using a microtaperingtechnique.II. EXPERIMENTA schematic <strong>of</strong> the laser scanning rig is shown in Fig. 1.Custom designed s<strong>of</strong>tware automates the instrument control<strong>and</strong> data acquisition through serial <strong>and</strong> universal serial busFIG. 2. Power curve for the CO 2 laser for a pull length <strong>of</strong> 22 mm.USB interfaces, thereby ensuring ease <strong>of</strong> parameter adjustment<strong>and</strong> reproducibility. A 12.5 cm focal length ZnSe lensfocuses the laser beam onto the fiber with a FWHM spot size<strong>of</strong> approximately 500 m, 5.5 cm in front <strong>of</strong> the scanningmirror. The stepper motor used in conjunction with a 500:1gear box in half-step mode has a resolution <strong>of</strong> 1.810 −3 deg”half-step, which corresponds to a hot-spot translation<strong>of</strong> around 1.7 m” half-step on the fiber. The hot spotrefers to the point on the fiber which is being heated by thelaser beam at any instant. A 1 in. gold mirror <strong>and</strong> holder arevertically mounted on the shaft <strong>of</strong> the gear box. The CO 2laser beam is incident on the center <strong>of</strong> the mirror at an angle<strong>of</strong> 45° <strong>and</strong> is directed onto the fiber. A Thurlby Th<strong>and</strong>erTG250 function generator connected to the stepper motorcontroller circuit cyclically scans the mirror through a sweepangle <strong>of</strong> approximately 10°, thereby scanning the laser beamacross the fiber. Alternatively, we can use customized limitswitches to control the sweep angle <strong>of</strong> the mirror. Anotherfunction generator connected to the stepper motor controllercircuit provides the clocking pulses, which dictate the speedat which the mirror scans the laser beam. The discrete nature<strong>of</strong> the stepper motor step size is smeared out by the size <strong>of</strong>the beam at the focus. Two motorized translation stagesSt<strong>and</strong>a Ltd., Lithuania pull the ends <strong>of</strong> the fiber taperSM980 single mode fiber from Fibercore with a resolution<strong>of</strong> 1 m. As the taper is being drawn, the transmission loss<strong>of</strong> a 980 nm diode laser through the fiber is monitored with aThorlabs Si photodiode DET series connected to a digitalstorage oscilloscope.The computer provides an analog voltage signal to theUC-2000 laser controller based on the power curve shown inFig. 2. Although the power curve is an oversimplification, 16we find that it serves the application quite well. To determinethe initial settings for our s<strong>of</strong>tware, we manually increasedthe power <strong>of</strong> the laser while observing the inc<strong>and</strong>escent lightproduced at the hot spot. The laser power was recorded as afunction <strong>of</strong> pull length. A fourth-order polynomial fit to thesedata provides the laser power curve. An exponential fit wasalso attempted but the slope <strong>of</strong> the curve increased too rapidlytowards the end <strong>of</strong> the taper pull causing prematurebreaking <strong>of</strong> the fiber <strong>and</strong> limiting the minimum taper diam-Downloaded 13 Nov 2007 to 134.93.129.164. Redistribution subject to AIP license or copyright, see http://rsi.aip.org/rsi/copyright.jsp
083105-3 Heat-<strong>and</strong>-pull rig Rev. Sci. Instrum. 77, 083105 2006eter to 4 m. On the other h<strong>and</strong>, the polynomial power curvereadily produced 3 <strong>and</strong> 4 m diameter tapers.Since the taper pr<strong>of</strong>ile closely follows an exponentialpr<strong>of</strong>ile, we use this relationship to predict suitable scanlengths, L, <strong>and</strong> pull lengths, z, for any desired taper waistradius rz,rz = r 0 e −z/L ,1where r 0 is the initial fiber radius before tapering. 15 There issome flexibility in choosing z <strong>and</strong> L. Scan lengths rangingfrom 5 to 15 mm <strong>and</strong> pull lengths ranging from12 to 40 mm were examined <strong>and</strong> all yielded low transmissionlosses <strong>and</strong> taper diameters <strong>of</strong> 3–4 m. We found thatEq. 1 always gives an accurate prediction <strong>of</strong> the waist diameter.The pull speed is less flexible <strong>and</strong> a value <strong>of</strong>80–110 m”s provided the best results.Several preparatory steps are essential in ensuring thatthe finished taper is <strong>of</strong> satisfactory quality. Firstly, the fiber isliberally cleaned with acetone to remove inorganic substances.It is imperative that the laser beam <strong>and</strong> fiber behorizontal to within a few tens <strong>of</strong> microns so that the focus<strong>of</strong> the beam covers the fiber precisely throughout the scan.The fiber must also be slightly taut before attempting thisalignment. Failure to optimize the alignment before startingfabrication results in sagging <strong>and</strong> possible vibrations <strong>of</strong> thefiber, which tends to distort taper pr<strong>of</strong>iles leading to hightransmission losses. The polarization <strong>of</strong> the laser beam is setvertical to the fiber so that the absorption coefficient ismaximized. 16III. RESULTS AND DISCUSSIONAs a rule, tapers can only be produced with low losses iftheir pr<strong>of</strong>ile follows the adiabaticity criterion. 23 This criterionrequires the taper pr<strong>of</strong>ile to be such that the change in taperangle is small enough to prevent light propagation being eithercoupled from the fundamental mode, HE 11 , to higherorder parasitic modes in the fiber or being lost as radiation.The criterion can be stated as dr/dzz 1 z− 2 z/2, where dr/dz defines the local taper angle, z,by the trigonometric expression z=tan −1 dr/dz, z isthe local core radius, 1 z <strong>and</strong> 2 z are the local propagationconstants <strong>of</strong> the fundamental mode <strong>and</strong> the next closestmode, respectively, <strong>and</strong> z is along the fiber axis. 15,23 Thetranscendental equation for the propagation constants hasbeen solved numerically as a function <strong>of</strong> local taper diameter.Figure 3 shows a plot <strong>of</strong> this criterion <strong>and</strong> the core taperangle <strong>of</strong> a typical adiabatic taper as produced by the abovedescribedmethod. The taper curve is based on an optimumexponential fit <strong>of</strong> the measurements in Fig. 4 <strong>and</strong> has theform as described by Eq. 1.When the angle <strong>of</strong> the delineation curve is less than approximatelyten times the taper angle, the light in the propagatingmode will be lost to parasitic modes. While the fiberhas only a single propagating mode in the untapered region,the taper itself contains multiple modes since the light iscladding-air guided. For a taper waist radius, a, <strong>of</strong>1.5m,2 2the core guidance parameter Vka ncore −n clad 9.6692.405 at a wavelength <strong>of</strong> 980 nm, indicating the taper isFIG. 3. Approximated length-scale delineation curve.multimoded. 8 The refractive index <strong>of</strong> the core, n core , is actuallythe effective index <strong>of</strong> the fundamental mode determinedfrom 1 z/k where k is the free space wave number <strong>and</strong> therefractive index <strong>of</strong> the air cladding, n clad , is 1. However, oncethe taper is adiabatic, light only propagates in the fundamentalmode. A single-mode tapered fiber is only possible whenthe diameter is less than about 1 m.The delineation curve in Fig. 3 is read from right to leftwhen considering a decreasing taper diameter. Starting fromthe untapered region on the right, the initial taper transitionconsists <strong>of</strong> a core where the light propagates <strong>and</strong> a claddingwhere the refractive index difference is=n core −n clad /n clad 7.810 −3 . An approximation for thecore guidance curve is given in Ref. 23 <strong>and</strong> is based on theassumption <strong>of</strong> an infinite cladding diameter. Gradually, thediameter <strong>and</strong> core guidance parameter decrease until the coreeffectively disappears <strong>and</strong> the propagating light becomescladding-air guided. At the taper waist, there is a large indexdifference <strong>of</strong> about 0.42 between the cladding <strong>and</strong> surroundingair causing the core guidance parameter to gradually increase;this is shown as an increase in the angle <strong>of</strong> the delin-FIG. 4. Taper pr<strong>of</strong>ile for a 3 m diameter taper. The pull length is 40 mm,scan length is 7 mm, <strong>and</strong> the initial taper diameter is 125 m. The insetshows a SEM image <strong>of</strong> a section <strong>of</strong> the taper with a diameter <strong>of</strong> 5.9 m. Thebar is 1.0 m.Downloaded 13 Nov 2007 to 134.93.129.164. Redistribution subject to AIP license or copyright, see http://rsi.aip.org/rsi/copyright.jsp
083105-4 Ward et al. Rev. Sci. Instrum. 77, 083105 2006FIG. 5. Transmission loss measurements for a 3 m diameter taper with0.20 dB loss.eation curve. For the cladding guidance curve, anapproximation is also given in Ref. 23 <strong>and</strong> is based on theassumption that the core diameter is vanishing. Figure 4shows a typical taper angle decreasing when approaching thetaper waist. Both core <strong>and</strong> cladding contribute to distinctregions in the delineation curve. The taper clearly meets theadiabaticity criterion since the angle <strong>of</strong> the taper transitionsis sufficiently below the delineation curve.Figure 5 shows power transmission loss for a taper witha3m diameter as a function <strong>of</strong> pull length. The powerremains constant except for minute oscillations that do notinfluence the final taper transmission. A final transmissionloss <strong>of</strong> 0.20 dB was measured <strong>and</strong> is quite acceptable forapplications involving microsphere coupling. For a set <strong>of</strong> 11taper pulls, the loss was 0.3±0.2 dB with some <strong>of</strong> the tapershaving losses as low as 0.04 dB. Losses lower than 0.04 dBwere not routinely observed, which is thought to be primarilydue to the fact that the taper curve is not strictly a factor <strong>of</strong>10 below the delineation curve for the whole taper pr<strong>of</strong>ile.Using a shorter wavelength diode laser would proportionatelyshift the delineation curve to the left <strong>and</strong> this wouldincrease the taper-delineation curve separation in Fig. 3, consequentlygiving lower losses. 23 Surface roughness on thetaper is negligible as evidenced by the scanning electron microscopySEM image in the inset <strong>of</strong> Fig. 4.The bottle resonator in Fig. 6 is produced with similardimensions to that described in the theoretical work <strong>of</strong>Louyer et al. 19 <strong>and</strong> Sumetsky. 20 The resonator has a midsectiondiameter <strong>of</strong> 12 m <strong>and</strong> length <strong>of</strong> approximately300 m. Shorter bottle resonators are limited by the size <strong>of</strong>the hot spot. Kakarantzas et al. 24 describe a bottle resonator160 m long with a diameter <strong>of</strong> 16 m. The fabrication beginswith tapering <strong>of</strong> the fiber down to a waist diameter <strong>of</strong>10–20 m, as described already. Each microtapered sectionon either side <strong>of</strong> the resonator is produced by pulling thetaper at a speed <strong>of</strong> 10 m”s for a length <strong>of</strong> about 0.2 mmFIG. 6. Optical micrograph <strong>of</strong> a bottle resonator with a diameter <strong>of</strong> 12 m<strong>and</strong> length <strong>of</strong> 300 m. The bar is 10 m.while keeping the hot spot stationary. The discrete rotation <strong>of</strong>the stepper motor shaft allows the scanning mirror to directthe beam onto exact locations where microtapering is to takeplace.Subwavelength diameters <strong>of</strong> below 100 nm have beenachieved with the micr<strong>of</strong>urnace method. 14 A20WCO 2 laserheats a small sapphire tube that surrounds the fiber ratherthan directly heating the fiber with the laser. Alignment <strong>of</strong>the beam focus with the taper is not as stringent as comparedto the direct laser heating method. A limitation <strong>of</strong> thismethod is that microstructuring <strong>of</strong> the fiber pr<strong>of</strong>ile cannot beachieved. Different taper shapes 15 may not be easily producedsince the hot zone cannot be precisely varied <strong>and</strong> istypically several millimeters in length. A very short hot zoneis vital for the microtapering step when producing bottleresonators. Furthermore, high losses <strong>of</strong> several decibels have,until now, been observed with the micr<strong>of</strong>urnace method becausethe taper transitions are nonadiabatic. 13 This is likelyto be detrimental when coupling to the fundamental mode <strong>of</strong>a microresonator.We have described a simple <strong>and</strong> reproducible method <strong>of</strong>fabricating 3–4 m diameter tapers using commercialsingle-mode SM980 fiber. A stepper motor <strong>and</strong> gear box canbe used to scan the laser beam across the fiber with sufficientprecision as a simpler <strong>and</strong> inexpensive alternative to themore traditional galvanometer scanners reported for flamesystems. Transmission losses <strong>of</strong> 0.3±0.2 dB at a wavelength<strong>of</strong> 980 nm are within acceptable limits <strong>of</strong> other tapering rigsdescribed in the literature. 25 We verify our <strong>optical</strong> microscopemeasurements <strong>of</strong> the taper diameter with SEM imaging.This rig is <strong>of</strong> interest for applications involving microresonatorcoupling <strong>and</strong> it can also be used to produce longperiod gratings 24 <strong>and</strong> fused biconical taper couplers. 25Apart from the simplicity <strong>and</strong> cost savings <strong>of</strong> such alaser scanning rig, we have shown its flexibility for producingbottle resonators. This technique involves microtaperinga fiber over a distance <strong>of</strong> about 0.2 mm <strong>and</strong> at a very slowspeed. The dimensions <strong>of</strong> this new type <strong>of</strong> resonator can beprecisely controlled. The discrete step size <strong>of</strong> the steppermotor can be used to control the length <strong>of</strong> the resonator witha resolution <strong>of</strong> approximately 1.7 m half-step given thecurrent rig configuration. The diameter <strong>of</strong> the bottle resonatorscan be as small as 3–4 m. Installation <strong>and</strong> operation <strong>of</strong>our laser scanning rig require a minimum amount <strong>of</strong> skillcompared with most other tapering methods.Smaller diameter tapers <strong>and</strong> shorter bottle resonatorswould, no doubt, be possible by first exp<strong>and</strong>ing the CO 2beam before focusing it through the 12.5 cm lens, therebyyielding a higher power density by virtue <strong>of</strong> the smaller size<strong>of</strong> the laser beam at the focus. This will be the subject <strong>of</strong>future investigations. Even though the micr<strong>of</strong>urnace taperingmethod can achieve any reasonable diameter required formicrocavity coupling, the technique we have described isstill required for bottle resonator fabrication. We intend touse these tapers to couple light into active microspheresmade from <strong>doped</strong> <strong>phosphate</strong> <strong>and</strong> ZBNA glass. 26 We are alsointerested in studying the interactions between cold, rubidiumatoms <strong>and</strong> the evanescent field at the taper region foratom manipulation <strong>and</strong> guiding purposes. 27Downloaded 13 Nov 2007 to 134.93.129.164. Redistribution subject to AIP license or copyright, see http://rsi.aip.org/rsi/copyright.jsp
083105-5 Heat-<strong>and</strong>-pull rig Rev. Sci. Instrum. 77, 083105 2006ACKNOWLEDGMENTSThis work is supported by Science Foundation Irel<strong>and</strong>Project No. 02/IN1/128. The authors thank Dr. AnthonyGrant <strong>of</strong> Cork Institute <strong>of</strong> Technology for his help with theSEM measurements. One <strong>of</strong> the authors D.G.O.S. acknowledgessupport from IRCSET through the Embark Initiative.Another author K.D. is supported by Cork Institute <strong>of</strong>Technology <strong>and</strong> one <strong>of</strong> the authors M.J.M. acknowledgessupport from the Council <strong>of</strong> Directors <strong>of</strong> the Institutes <strong>of</strong>Technology.1 S. Götzinger, O. Benson, <strong>and</strong> V. S<strong>and</strong>oghdar, Appl. Phys. B: Lasers Opt.73, 8252001.2 G. Griffel, S. Arnold, D. Taskent, A. Serpengüzel, J. Connolly, <strong>and</strong> N.Morris, Opt. Lett. 21, 6951996.3 V. S. Ilchenko, X. S. Yao, <strong>and</strong> L. Maleki, Opt. Lett. 24, 723 1999.4 F. Lissillour, D. Messager, G. Stéphan, <strong>and</strong> P. Féron, Opt. Lett. 26, 10512001.5 S. M. Spillane, T. J. Kippenberg, O. J. Painter, <strong>and</strong> K. J. Vahala,Phys. Rev. Lett. 91, 043902 2003.6 B. E. Little, J.-P. Laine, <strong>and</strong> H. A. Haus, J. Lightwave Technol. 17, 7041999.7 L. Tong, J. Lou, <strong>and</strong> E. Mazur, Opt. Lett. 12, 10252004.8 F. Le Kien, J. Q. Liang, K. Hakuta, <strong>and</strong> V. I. Balykin, Opt. Commun. 242,445 2004.9 J. C. Knight, G. Cheung, F. Jacques, <strong>and</strong> T. A. Birks, Opt. Lett. 22, 11291997.10 L. Tong, R. R. Gattass, J. B. Ashcom, S. He, J. Lou, M. Shen, I. Maxwell,<strong>and</strong> E. Mazur, Nature London 426, 816 2003.11 G. Brambilla, V. Finazzi, <strong>and</strong> D. J. Richardson, Opt. Express 12, 22582004.12 T. E. Dimmick, G. Kakarantzas, T. A. Birks, <strong>and</strong> P. St. J. Russel,Appl. Opt. 38, 6845 1999.13 M. Summetsky, Y. Dulashko, <strong>and</strong> A. Hale, Opt. Express 12, 35212004.14 M. Sumetsky, Y. Dulashko, J. M. Fini, A. Hale, <strong>and</strong> D. J. DiGiovanni,J. Lightwave Technol. 24, 242 2006.15 T. A. Birks <strong>and</strong> Y. W. Li, J. Lightwave Technol. 10, 4321992.16 A. Grellier, N. K. Zayer, <strong>and</strong> C. N. Pannell, Opt. Commun. 152, 3241998.17 F. Treussart, J. Hare, L. Collot, V. Lefèvre, D. S. Weiss, V. S<strong>and</strong>oghdar,J. M. Raimond, <strong>and</strong> S. Haroche, Opt. Lett. 19, 1651 1994.18 W. von Klitzing, R. Long, V. S. Ilchenko, J. Hare, <strong>and</strong> V. Lefèvre-Seguin,New J. Phys. 3, 14.1 2001.19 Y. Louyer, D. Meshede, <strong>and</strong> A. Rauschenbeutel, Phys. Rev. A 72,031801R 2005.20 M. Sumetsky, Opt. Lett. 29, 82004.21 Laser 2000 UK Ltd., Britannia House, Denford Road, Ringstead,Northants NN14 4DF, United Kingdom. 671XX series drive card <strong>and</strong>6210H series moving magnet galvanometer scanner.22 Radionics Ltd., Glenview Industrial Estate, Herberton Road, Rialto, Dublin12, Irel<strong>and</strong>. Hybrid stepper motor, stock No. 440-436; 500:1 gear box,stock No. 718-925; <strong>and</strong> controller circuit, stock No. 217-3611.23 J. D. Love, W. M. Henry, W. J. Stewart, R. J. Black, S. Lacroix, <strong>and</strong> F.Gonthier, IEE Proc.-J: Optoelectron. 138, 343 1991.24 G. Kakarantzas, T. E. Dimmick, T. A. Birks, R. Le Roux, <strong>and</strong> P. St. J.Russel, Opt. Lett. 26, 1137 2001.25 C. McAtamney, A. Cronin, R. Sherlock, G. M. O’Connor, <strong>and</strong> T. J. Glynn,Proceedings <strong>of</strong> the Third International WLT Conference on Lasers inManufacturing, Munich, 2005, p.673.26 B. J. Shortt, J. Ward, D. O’Shea, <strong>and</strong> S. Nic Chormaic, Proc. SPIE 6187,618708 2006.27 F. Le Kien, V. I. Balykin, <strong>and</strong> K. Hakuta, Phys. Rev. A 70, 063403 2004.Downloaded 13 Nov 2007 to 134.93.129.164. Redistribution subject to AIP license or copyright, see http://rsi.aip.org/rsi/copyright.jsp
140Appendix CUpconversion Channels inEr:ZBLALiP: a Multi-ColorMicrospherical Light Source
EPJ Applied Physics pro<strong>of</strong>s(will be inserted by the editor)Upconversion channels in Er 3+ :ZBLALiP <strong>fluoride</strong> glassmicrospheresD.G. O’Shea 1,2 ,J.M.Ward 2,3 , B.J. Shortt 2,3 ,M.Mortier 4 ,P.Féron 5 , <strong>and</strong> S. Nic Chormaic 1,2,a1 Physics Department, University College Cork, Cork, Irel<strong>and</strong>2 Photonics Centre, Tyndall National Institute, Prospect Row, Cork, Irel<strong>and</strong>3 Department <strong>of</strong> Applied Physics <strong>and</strong> Instrumentation, Cork Institute <strong>of</strong> Technology, Bishopstown, Cork, Irel<strong>and</strong>4 LaboratoiredeChimiedelaMatière Condensée de Paris, ENSCP, 11 rue Pierre et Marie Curie, 75005 Paris, France5 ENSSAT-FOTON (CNRS-UMR 6082) Université de Rennes 1, 6 rue de Kerampont, BP 80518, 22305 Lannion Cedex, FranceReceived: 29 May 2007 / Received in final form: 21 August 2007 / Accepted: 28 August 2007Published online (Inserted Later) – c○ EDP SciencesAbstract. We present results on the realization <strong>of</strong> a multicolour microspherical glass light source fabricatedfrom the erbium <strong>doped</strong> <strong>fluoride</strong> glass ZBLALiP. Whispering gallery mode lasing <strong>and</strong> upconversion processesgive rise to laser <strong>and</strong> fluorescent emissions at multiple wavelengths from the ultraviolet to the inf<strong>rare</strong>d.Thirteen discrete emissions ranging from 320 to 849 nm have been observed in the upconversion spectrum.A Judd-Ofelt analysis was performed to calculate the radiative properties <strong>of</strong> Er 3+ :ZBLALiP microspheres,including the radiative transition probabilities, the electric dipole strengths, the branching ratios <strong>and</strong> theradiative lifetimes <strong>of</strong> the transitions involved. We have also identified the primary processes responsiblefor the generation <strong>of</strong> the observed wavelengths <strong>and</strong> have shown that this material has an improved range<strong>of</strong> emissions over other erbium <strong>doped</strong> <strong>fluoride</strong> glasses.PACS. 42.55.Sa Microcavity <strong>and</strong> microdisk lasers – 42.70.Hj Laser materials – 42.70.Ce Glasses, quartz1 IntroductionMicrospherical resonators have attracted significant attentionin recent years due to their interesting <strong>optical</strong> properties<strong>and</strong> the range <strong>of</strong> applications for which they can beused including quantum optics [1–3] <strong>and</strong> <strong>optical</strong> communications[4,5]. In particular, microspheres fabricated from<strong>rare</strong>-<strong>earth</strong> ion <strong>doped</strong> materials have been shown to operateas miniature laser devices [6,7]. Recently, there havebeen significant breakthroughs in the exploitation <strong>of</strong> upconversionmechanisms in <strong>rare</strong>-<strong>earth</strong> ion <strong>doped</strong> materialsto yield wavelengths from the near inf<strong>rare</strong>d to the near ultraviolet.The spectral properties <strong>of</strong> the emissions from thematerials depend on (i) the choice <strong>of</strong> dopant (e.g. Er 3+ ,Yb 3+ ) <strong>and</strong> (ii) the host matrix (e.g. <strong>fluoride</strong> or <strong>phosphate</strong>glass) in which the dopant is embedded. The close proximity<strong>of</strong> numerous energy levels in triply-ionized <strong>rare</strong> <strong>earth</strong>ions is advantageous for obtaining fluorescent <strong>and</strong> lasingemissions through various upconversion mechanisms suchas excited state absorption (ESA), energy transfer upconversion(ETU) <strong>and</strong> photon avalanche (PA) [8].Three-photon upconversion lasing yielding red <strong>and</strong>blue emissions about 480 nm <strong>and</strong> 800 nm in thulium<strong>doped</strong>fluorozirconate (ZBLAN) glass microspheres hasbeen reported [9]. The same authors also observed red <strong>and</strong>ae-mail: s.nicchormaic@ucc.iegreen upconversion lasing in erbium <strong>doped</strong> ZBLAN glassmicrospheres [10]. In both cases, 1064 nm free-space laserpulses focused on the microsphere surface acted as thepump source. The first microspherical laser pumped usinga fibre taper was demonstrated when an Yb:Er-<strong>doped</strong><strong>phosphate</strong> glass microsphere was pumped at 980 nm [11].The microsphere lased in the inf<strong>rare</strong>d about 1550 nm witha threshold power <strong>of</strong> 60 μW, <strong>and</strong> emitted green fluorescenceattributed to a two-photon ESA process. Severalgroups [6,7,12,13] have also made considerable progress inthe development <strong>of</strong> microspherical lasers operating in theinf<strong>rare</strong>d region, in particular with emission wavelengthsfalling in the C- <strong>and</strong> L-b<strong>and</strong>s.The suitability <strong>of</strong> <strong>fluoride</strong> glasses as <strong>rare</strong>-<strong>earth</strong> hostmaterials has been known for some time [14] due to theirlow phonon energies which determine multiphonon relaxationrates <strong>and</strong>, subsequently, the efficiency <strong>of</strong> any upconversionprocesses present. In this paper, we report on anumber <strong>of</strong> upconversion processes identified in an erbium<strong>doped</strong><strong>fluoride</strong> glass (Er 3+ :ZBLALiP) microsphere, usinga 980 nm pump laser coupled via a fibre taper. Preliminarywork on Er 3+ :ZBLALiP was presented in [7], includingevidence <strong>of</strong> 1550 nm lasing in 1480 nm pumped microspheres.In this paper, we provide a more systematicstudy <strong>of</strong> the upconversion processes involved in 980 nmpumping <strong>of</strong> Er 3+ :ZBLALiP microspheres. We identify the
2 The European Physical Journal Applied PhysicsFig. 2. Experimental setup. OSA – <strong>optical</strong> spectrum analyser.The absorption spectra were recorded using a doublebeamCary 17 spectrometer (Varian) with a resolutionbetter than 0.1 nm.Fig. 1. Absorption spectrum <strong>of</strong> 0.2 mol% Er 3+ :ZBLALiP bulkglass.transitions involved <strong>and</strong> analyse the dominant processesthat give rise to the observed emissions. In addition, wecalculate associated material properties through McCumber<strong>and</strong> Judd-Ofelt theories. We have observed upconversionemissions from the ultraviolet to the inf<strong>rare</strong>d <strong>and</strong> weidentify several new emissions including the first observation<strong>of</strong> a 320 nm upconversion following 980 nm pumping<strong>of</strong> Er 3+ . This arises due to the exceptionally long lifetimes<strong>of</strong> the 4 F 3,5/2 levels within Er 3+ :ZBLALiP comparedto other glasses [15]. The identification <strong>and</strong> analysis<strong>of</strong> the numerous upconversions enable us to attributethe emissions to particular erbium transitions <strong>and</strong> suggestthe processes responsible. In addition, the efficiency<strong>of</strong> the ultraviolet upconversion processes <strong>and</strong> the stability<strong>of</strong> erbium <strong>doped</strong> ZBLALiP microspheres (permitting high<strong>optical</strong> quality to be achieved during fabrication) makethis material suitable for information storage applicationswhere short wavelengths are desirable [16].2 ExperimentAn initial study <strong>of</strong> some fundamental material properties<strong>of</strong> Er 3+ <strong>doped</strong> ZBLALiP (ZrF 4 -BaF 2 -LaF 3 -AlF 3 -LiF-PbF 2 ) glass was reported earlier [7], where the improvedstability <strong>of</strong> ZBLALiP with respect to similar fluorozirconateglasses <strong>and</strong> its suitability as a host for <strong>rare</strong>-<strong>earth</strong>ions was discussed. Here, we present additional materialproperties <strong>and</strong> extend the range <strong>of</strong> functionality <strong>of</strong>Er 3+ :ZBLALiP as a material suitable for <strong>optical</strong> communications<strong>and</strong> <strong>optical</strong> sensing. Figure 1 shows the measuredabsorption spectrum for a 5.8 mm thick bulk sample<strong>of</strong> 0.2 mol% Er 3+ :ZBLALiP in which twelve absorptionb<strong>and</strong>s can be identified. These represent the transitionsfrom the ground state 4 I 15/2 → A N with A 1 = 2 G 9/2 +2 K 15/2 + 2 G 7/2 ,A 2 = 4 G 11/2 ,A 3 = 2 H 9/2 ,A 4 = 4 F 3/2 ,A 5 = 4 F 5/2 ,A 6 = 4 F 7/2 ,A 7 = 2 H 11/2 ,A 8 = 4 S 3/2 ,A 9 = 4 F 9/2 ,A 10 = 4 I 9/2 ,A 11 = 4 I 11/2 <strong>and</strong> A 12 = 4 I 13/2 .The fabrication techniques for the Er 3+ :ZBLALiP microsphereswas described elsewhere [17]. We use glass withan erbium concentration <strong>of</strong> 0.2 mol%, which equates to4 × 10 19 Er 3+ ions/cm 3 . Note that, at this concentration,energy transfer (ET) should not play a major role in theupconversion processes <strong>and</strong>, therefore, excited state absorption(ESA) is the dominant mechanism [18]. Nevertheless,due to the non-trivial problem <strong>of</strong> distinguishingthe two mechanisms, some authors have suggested thatET may play a role even when the dopant concentrationis below the critical value <strong>of</strong> about 1 mol% [19–21].In our work, the C-b<strong>and</strong> lasing characteristics <strong>and</strong> upconversionspectra are investigated at room temperatureusing a single mode, 980 nm laser diode pump with aspectral width <strong>of</strong> about 1 nm <strong>and</strong> under CW pumpingconditions. The experimental setup is depicted in Figure2. A fibre-<strong>optical</strong> isolator is placed immediately afterthe 980 nm pump laser in order to avoid <strong>optical</strong> feedback.The pump light then passes through a 10:90 coupler,whereby 10% is monitored using a power meter <strong>and</strong>the larger fraction is sent through a fibre taper <strong>and</strong> coupledinto the microsphere via evanescent wave coupling.The 980 nm light transmitted through the fibre taper isseparated from the C-b<strong>and</strong> emissions using a WDM <strong>and</strong>an <strong>optical</strong> spectrum analyser is used to detect the lasingaround 1550 nm. The UV to IR emissions are detectedby free-space coupling <strong>of</strong> the scattered radiation from themicrosphere into an <strong>optical</strong> spectrometer. To achieve efficientcoupling <strong>of</strong> the pump into the microsphere <strong>and</strong> efficientcollection <strong>of</strong> the inf<strong>rare</strong>d lasing spectrum, the fibretaper is manufactured using 1550 nm SMF-28 fibre thatis adiabatically tapered to 1 μm diameterusingadirectheating technique [22]. The transmission loss <strong>of</strong> these tapersis typically less than 0.1 dB/cm. Optimum mechanicalalignment <strong>of</strong> the taper <strong>and</strong> microsphere is achieved bytranslating the microsphere to different locations along thetaper until the lasing about 1550 nm is maximized. Thetransmission through the pump fibre is also monitoredduring the alignment <strong>and</strong> around 10–15% <strong>of</strong> the pumplight is coupled into the microsphere. This relatively lowcoupling efficiency is, in part, due to the broad spectralnature <strong>of</strong> the pump laser relative to the whispering gallerymode resonances <strong>of</strong> the microsphere <strong>and</strong> can be improvedby the use <strong>of</strong> a narrow linewidth pump source [23].
D.G. O’Shea et al.: Upconversion channels in Er 3+ :ZBLALiP <strong>fluoride</strong> glass microspheres 3Fig. 3. 70 μm diameter microsphere lasing spectrum (intensepeaks) about 1550 nm showing whispering gallery mode structure.3ResultsFigure 3 shows a typical lasing spectrum obtained for a70 μm sphere pumped under the aforementioned conditions.Characteristic whispering gallery mode b<strong>and</strong>s aboutthe sphere equator are also observed. The intense peaksrepresent multimode lasing <strong>and</strong> the smaller signals indicatefluorescence emissions. The microsphere eccentricityis determined from ε =(Δω ecc /ω nml ) ( l 2/ |m|−1/2 ) ,where l <strong>and</strong> m are the angular mode numbers, ω nml isthe angular frequency <strong>of</strong> the mode <strong>and</strong> Δω ecc is the azimuthalmode splitting. The eccentricity is calculated tobe ∼2.1% for l = |m| with corresponding azimuthal modesplitting, Δω ecc ,<strong>of</strong>∼11 GHz. Analysis <strong>of</strong> the lasing peaksenables us to measure the freespectralrange,ν FSR ,betweensuccessive mode groups with a difference in angularmode number l <strong>of</strong> 1, to be ∼7.8 nm (0.97 THz). Theoretically,we can determine the diameter <strong>of</strong> the sphere fromD = c/πpν VSR ,wherec is the speed <strong>of</strong> light <strong>and</strong> p isthe refractive index <strong>of</strong> the material. Using p =1.49 at1550 nm, we find that ν FSR =7.8 nm indicates a microspherediameter <strong>of</strong> 66 μm, which is reasonably close to the(70 ± 2) μm determined using an <strong>optical</strong> microscope.It can be seen from Figure 3 that each group <strong>of</strong> modescontains four distinct lasing peaks due to the excitation<strong>of</strong> multiple modes in the sphere. The peak power <strong>of</strong> thelasing peaks presented here is ∼30 nW, although we havealso observed lasing in a single mode with a peak value<strong>of</strong> ∼500 nW. The spacing between TE <strong>and</strong> TM modes(ν TETM ) <strong>of</strong> 6.8 nm in Figure 3 agrees well with the calculatedvalue <strong>of</strong> 6.4 nm. An estimate <strong>of</strong> the loaded cavityQ for this system yields a value in the region <strong>of</strong> 1 × 10 7 .The Er 3+ :ZBLALiP upconversion spectrum recordedcoincidently to the C-b<strong>and</strong> lasing spectrum (cf. Fig. 3)is shown in Figure 4. Approximately 700 μW <strong>of</strong> 980 nmpump light was coupled into the microsphere. The spectrumis detected by monitoring the free-space scatteringfrom the microsphere into a high numerical aperture fibrecoupled spectrometer (Ocean Optics USB2000). Due tothe limited dynamic linear range <strong>of</strong> the spectrometer thefluorescence spectrum is produced by splicing two separatespectra together. This also enables us to maximize thesignal-to-noise ratio <strong>of</strong> the lower intensity transitions. Thespectra about the green were recorded for a detector integrationtime reduced by a factor <strong>of</strong> 40. Thirteen discretepeaks have been noted in the spectrum <strong>and</strong> are numberedfrom T1–T13. The spectra have also been corrected for theresponsivity <strong>of</strong> the spectrometer detector as a function <strong>of</strong>wavelength. The total power outcoupled <strong>and</strong> detected is0.5 nW for the green transitions (T6 <strong>and</strong> T7) <strong>and</strong> 0.1 nWfor T13. The limited resolution <strong>of</strong> the spectrometer used,combined with the smaller microsphere free spectral rangeat shorter wavelengths, means that the whispering gallerymode structure is only visible for emissions at wavelengthsabove 800 nm. The mode structure for the 849 nm (T13)emission is distinguishable in the inset <strong>of</strong> Figure 4.3.1 Emission <strong>and</strong> absorption cross-sections <strong>of</strong>Er 3+ :ZBLALiPThe emission cross-section, σ ems , for Er 3+ :ZBLALiParound 1550 nm can be determined from the absorptionspectrum (Fig. 1). Using McCumber theory, under the assumption<strong>of</strong> a strongly phonon coupled system [24], theemission cross-section is given byσ ems (λ) =σ abs (λ) Z ( ) (L EULexp exp −Z U k B Thcλk B T), (1)where Z L (Z U ) is the partition function <strong>of</strong> the lower(upper) state given by a summation <strong>of</strong> continuous levels∑ i exp (ΔE i/k B T ), where ΔE i is the energy differencebetween the Stark split sublevels <strong>and</strong> the lowestenergy level in the lower (upper) manifold, E UL is theenergy difference between the lowest sublevels in the upper<strong>and</strong> lower manifolds, h is Planck’s constant, c is thespeed <strong>of</strong> light, k B is Boltzmann’s constant, <strong>and</strong> T is temperaturein Kelvin. From equation (1), the bulk sample<strong>of</strong> Er 3+ :ZBLALiP has a peak emission cross-section<strong>of</strong> 4.6 × 10 −21 cm 2 in the C-b<strong>and</strong>, which compares wellwith values <strong>of</strong> 4.9 × 10 −21 cm 2 measured for fluoroindateglasses [15] <strong>and</strong> 4.6 × 10 −21 cm 2 measured in other fluorozirconateglass bulk samples [25].Using the absorption data presented in Figure 1, itis also possible to determine the absorption cross-sectionusing the expression [20]σ abs = − log AlN ′ (2)where A is the absorbance, l is the sample thickness, <strong>and</strong>N ′ is the Er 3+ concentration <strong>of</strong> 3.76×10 19 cm −3 .Figure5presents the absorption <strong>and</strong> emission cross-sections for0.2 mol% Er 3+ :ZBLALiP in the C-b<strong>and</strong>. Emission spectrafor both bulk <strong>and</strong> powder ZBLALiP samples are shown.
4 The European Physical Journal Applied PhysicsFig. 4. Er 3+ :ZBLALiP microsphere upconversion spectrum. The spectrometer integration time was reduced by a factor <strong>of</strong> fortyabout the green transitions T6 <strong>and</strong> T7. Inset: whispering gallery mode structure about T13.Determination <strong>of</strong> the electric dipole line strength, S ed ,<strong>and</strong> the magnetic dipole line strength, S md , combinedwith the JO intensity parameters for our material, canbe used to predict significant radiative properties forEr 3+ :ZBLALiP such as the spontaneous radiative transitionrates, electric dipole line strengths, branching ratios<strong>and</strong> radiative lifetimes. S ed depends on the double reducedmatrix elements <strong>of</strong> the unit tensor operator, U, <strong>and</strong>theseare assumed to be independent <strong>of</strong> the host material [27].Following this argument we have taken average publishedmatrix elements [27,28] for our calculations <strong>and</strong> these arereproduced in Table 1 for convenience. S md depends onthe double reduced matrix elements <strong>of</strong> the L +2S operator,where L is the total orbital angular momentum <strong>and</strong>S is the total spin.The total spontaneous radiative transition rate betweentwo levels J <strong>and</strong> J ′ ,isgivenbyFig. 5. Absorption (bulk) <strong>and</strong> emission (bulk <strong>and</strong> powder)cross-section measurements for 0.2 mol% Er 3+ :ZBLALiP.3.2 Radiative properties <strong>of</strong> Er 3+ :ZBLALiPIn order to gain a thorough underst<strong>and</strong>ing <strong>of</strong> the emissionprocesses within Er 3+ :ZBLALiP its radiative propertiescan be determined through Judd-Ofelt (JO) analysis<strong>of</strong> the absorption data presented in Figure 1. TheJO intensity parameters Ω t (t = 2, 4, 6) are derivedfrom the electric-dipole contributions <strong>of</strong> the measuredline strengths by a least-squares-fitting approach to minimizethe root mean square deviation with the calculatedline strength. Values <strong>of</strong> Ω 2 =3.12 × 10 −20 cm 2 , Ω 4 =1.49 × 10 −20 cm 2 , <strong>and</strong> Ω 6 = 1.15 × 10 −20 cm 2 [7] areused throughout our calculations. A spectroscopic qualityfactor can be defined as Ω 4 /Ω 6 , which gives 1.30for the quoted intensity parameters. Note that the JOparameters for Er 3+ :ZBLALiP are slightly higher thanthose for Er 3+ :ZBLAN (Ω 2 =2.37 × 10 −20 cm 2 , Ω 4 =1.24 × 10 −20 cm 2 ,<strong>and</strong>Ω 6 =0.73 × 10 −20 cm 2 ) [26]. Ahigher Ω 2 indicates greater asymmetry <strong>of</strong> the host glass,while a higher Ω 6 has a dominant influence on the electricdipole line strength, S ed , <strong>of</strong> the lasing transition4 I 13/2 → 4 I 15/2 [27].A JJ ′ = A edJJ ′+Amd JJ = 64π 4 ( ′ χed3hλ 3 S ed + χ md S md) ,(2J +1)(3)where λ is the mean wavelength <strong>of</strong> the absorption, χ ed =p(p 2 +2) 2 /9 is the local field correction factor for electricdipole transitions, <strong>and</strong> χ md = p 3 is the local fieldcorrection factor for magnetic dipole transitions. We calculatethe magnetic dipole emission probabalities, A mdJJ ′,using published values [27] for LaF 3 (A ′ mdJJ ′) <strong>and</strong> correctedfor the refractive index difference using the relationA mdJJ ′ =(p/p′ ) 3 A mdJJ ′,wherep′ (p) is the refractive index<strong>of</strong> LaF 3 (ZBLALiP). The refractive index for ZBLALiPis 1.49 at 1550 nm, while that for LaF 3=0.86A′ mdJJ ′.A mdJJ ′is 1.57, henceThe radiative lifetime, τ R , <strong>of</strong> transitions between levelsJ <strong>and</strong> J ′ is related to the inverse <strong>of</strong> A JJ ′ by1τ R = ∑J ′ A JJ ′, (4)<strong>and</strong> the branching ratio, β, between J <strong>and</strong> J ′ is simplythe ratio <strong>of</strong> A JJ ′ for the initial level to the sum <strong>of</strong> A JJ ′for all the lower levels given byβ = A JJ ′τ R . (5)
D.G. O’Shea et al.: Upconversion channels in Er 3+ :ZBLALiP <strong>fluoride</strong> glass microspheres 5Table 1 shows our values for the radiative probabilities,electric dipole line strengths, branching ratios, <strong>and</strong> radiativelifetimes for the transitions involved in 980 nmpumped Er 3+ :ZBLALiP. Several levels have high branchingratios for transitions to the ground level <strong>and</strong> intermediatelevels, many <strong>of</strong> which have been observed in theemission spectrum in Figure 4. Where possible we haveidentified the transition associated with the emissions observedin Figure 3 <strong>and</strong> have indicated this correspondencein the average wavelength column. Note that the radiativeproperties for the observed 667 nm emission (T10) havenot been calculated due to limited data availability <strong>and</strong>,therefore, it does not appear in Table 1.4 DiscussionsIn Figure 6 we present an energy level diagram for erbiumindicating the radiative <strong>and</strong> non-radiative transitions thatare responsible for the thirteen emissions identified in Figure4. Even though it is energetically possible for severalemissions to originate from the same level, the branchingratios, β, predicted in the JO theory can help determinethe most likely emissions from a particular level. For example,it is energetically possible for both the 383 nm (T2)<strong>and</strong> 618 nm (T8) emissions to originate from the radiativedecay <strong>of</strong> 4 G 11/2 to lower levels. However, the ratio <strong>of</strong> themeasured emission intensities (1:3) disagrees substantiallyfrom the calculated ratios (1:21), thereby indicating thatboth emissions cannot arise from the 4 G 11/2 level. In fact,only the 383 nm emission is from 4 G 11/2 <strong>and</strong> the 618 nmemission is due to the 2 P 3/2 → 4 F 9/2 decay. In this way,we can use a combination <strong>of</strong> the energy gaps between theenergy levels <strong>and</strong> the calculated branching ratios to determinethe energy levels involved in the radiative emissions.Four emissions in Figure 4 are attributed to the decay<strong>of</strong> the 2 P 3/2 level. These are the 618 nm (T8) decayto 4 F 9/2 (β = 0.05), the 479 nm (T4) decay to 4 I 11/2(β =0.29), the 403 nm (T3) decay to 4 I 13/2 (β =0.39),<strong>and</strong> the 320 nm (T1) decay to 4 I 15/2 (β = 0.12). Thebranching ratio calculations predict the ratio <strong>of</strong> emissionintensities for each <strong>of</strong> the levels to be 1 (618 nm):5.8(470 nm):7.8 (403 nm), which is in reasonable agreementwith the measured ratios <strong>of</strong> 1:5.3:6.6. We have excludedthe intensity <strong>of</strong> the 320 nm emission from this comparisonbecause fluorozirconate glasses have very substantialabsorption losses in the UV region [29].Further underst<strong>and</strong>ing <strong>of</strong> the transition(s) responsiblefor a particular wavelength can be obtained by the intensitydependence behaviour <strong>of</strong> the fluorescence at a particularwavelength. The centre wavelength associated witheach transition is also shown in Figure 6. In the case <strong>of</strong>ESA, the dependence <strong>of</strong> the fluorescence intensity uponpump power <strong>of</strong>ten exhibits a simple power law dependencewith a slope, n, equal to the number <strong>of</strong> photonsabsorbed. Measurements <strong>of</strong> this dependence for the case<strong>of</strong> the observed green transitions 2 H 11/2 → 4 I 15/2 (T6)<strong>and</strong> 4 S 3/2 → 4 I 15/2 (T7) are presented in Figure 7, wherewe plot the intensity as a function <strong>of</strong> the absorbed pumppower in the fibre taper. From the energy diagram (cf.Fig. 6) both T6 <strong>and</strong> T7 are attributed to 2-photon absorption.Slopes corresponding to n =1.58 for T6 <strong>and</strong>n =1.66 for T7 have been recorded, whereas a slope <strong>of</strong>two would be expected. This discrepancy from the expectedresult can be understood as depletion <strong>of</strong> the 4 I 15/2ground state [9].Based on our analysis we predict that the 4 F 3,5/2 levels<strong>of</strong> Er 3+ :ZBLALiP have unusually long radiative lifetimes<strong>of</strong> 1.44 ms <strong>and</strong> 1.15 ms compared to other glasses, suchas Er 3+ -<strong>doped</strong> fluoroindate glass which has a lifetime <strong>of</strong>0.50 ms [15]. As can be seen from the energy level diagram(cf. Fig. 6), this is critically important for the generation<strong>and</strong> observation <strong>of</strong> UV <strong>and</strong> violet emissions from the 2 P 3/2level since it facilitates the third ESA, 4 F 3,5/2 → 2 K 13/2 ,by maintaining a large 4 F 3,5/2 population. In Er 3+ -<strong>doped</strong>fluoroindate glass, nonradiative decay rapidly depletes the4 F 3,5/2 population, effectively preventing any further ESA<strong>and</strong> prohibiting UV emissions.Our measurements demonstrate a broad range <strong>of</strong> emissionfrom 320 nm to 849 nm in Er 3+ :ZBLALiP, in additionto the IR lasing around 1550 nm. We suggest that the combination<strong>of</strong> high cavity quality factor <strong>and</strong> low whisperinggallery mode volume (approximately 2000 μm 3 ) significantlyenhances the probability <strong>of</strong> excited state absorptionby enhancing the pump field strength (∼10 3 V/m per photon)within the microsphere. This is reflected in the factthat a significant number <strong>of</strong> the observed transitions areattributed to 3-photon <strong>and</strong> 4-photon absorption events forwhat is a relatively modest pump power (sub mW) coupledinto the microsphere.The emission line centred at 320 nm (T1) is, mostlikely, due to a 4-photon process populating the 2 P 3/2state, which in turn radiatively relaxes to the 4 I 15/2ground state. Three pump photons populate the 2 G 7/2state. The 2 G 7/2 – 2 P 3/2 energy gap <strong>of</strong> ∼3600 cm −1 combinedwith a phonon energy <strong>of</strong> 650 cm −1 is such thatthe 2 P 3/2 state is unlikely to be populated by thermalisation<strong>and</strong>, as such, we suggest that the absorption <strong>of</strong>a fourth pump photon is necessary to explain T1. This320 nm transition has previously been reported in Er 3+ -<strong>doped</strong> glass, but was identified as a 3-photon process followingpumping at 637 nm [16]. The same authors alsoreported emissions corresponding to the transitions T3,T4, T7 <strong>and</strong> T9. Transition T1 has been reported [30] inan Yb 3+ :Er 3+ co-<strong>doped</strong> material although in that casethe excitation process involved successive energy transfersfrom Yb 3+ . It should be noted that this is very differentfrom our work which involves a single dopant i.e. erbium<strong>and</strong>, therefore, does not rely on a sensitizer ion. Additionally,ETU does not play a major role in our experimentsdue to the low dopant concentration.We believe that the transitions 2 P 3/2 → 4 I 13/2 (T3),2 P 3/2 → 4 I 11/2 (T4) <strong>and</strong> 2 P 3/2 → 4 F 9/2 (T8) also arisedue to 4-photon excitation. Transitions T1, T3 <strong>and</strong> T4have been observed following pumping at 545 nm [31].Transitions T6, T7, T12 <strong>and</strong> T13 have been reportedfollowing 980 nm pumping [32]. The ultraviolet line
6 The European Physical Journal Applied PhysicsTable 1. Predicted radiative transition probabilities electric dipole line strengths (S ed )(A edJJ ′<strong>and</strong>Amd JJ ′), branching ratios (β),<strong>and</strong> radiative lifetimes (τ R)forEr 3+ :ZBLALiP. Note that the number in brackets (T1, T2, ...) listed under the averagewavelength corresponds to the observed transitions in Figure 3.[TransitionAverage wavelength(nm)(×10 −20 cm 3 JJ ′ A md] U(2) 2[ ] U(4) 2[ ] U(6) 2S edA ed) (s −1 JJ ′ β τ R) (s −1 )(ms)4I 13/2 → 4 I 15/2 1542 0.0195 0.1173 1.4316 1.88 78 32.2 1.00 9.104I 11/2 → 4 I 15/2 975→ 4 I 13/2 27270.02820.02100.00030.11000.39531.04000.541.4398127.2 0.840.168.53793 (T12)4I 9/2 → 4 I 15/2→ 4 I 11/2 4663→ 4 I 13/216680.00000.00030.00300.17330.00810.06740.00990.64000.12710.270.750.261063211.0 0.760.230.017.14656 (T9)4F 9/2 → 4 I 15/2→ 4 I 9/2 3623→ 4 I 13/21025→ 4 I 11/219660.00000.00960.06710.09600.53540.15760.00880.00610.46180.08701.26110.01201.330.361.670.32947674415.12.20.890.060.050.000.938540 (T7)4S 3/2 → 4 I 15/2→ 4 I 9/2 1688→ 4 I 13/2849 (T13)→ 4 I 11/212120.00000.00000.00000.00000.00000.00000.00370.07290.22110.34810.07890.25600.250.400.100.4070029424360.660.280.020.030.949520 (T6)2H 11/2 → 4 I 15/2→ 4 F 9/2 2579→ 4 I 13/2792→ 4 I 11/21115→ 4 I 9/215070.70560.02300.03570.20770.36290.41090.06110.13820.06620.02240.08700.05270.03710.28580.00222.910.220.361.081.1734537543531154.581.500.20.920.030.030.010.000.265492 (T5)4F 7/2 → 4 I 15/2→ 4 F 9/2 1947→ 4 I 13/2727→ 4 I 11/2983→ 4 I 9/212450.00000.00000.00350.01630.01210.14670.33710.26480.09540.03420.62730.00010.15150.42770.01510.940.500.580.680.1119643161478640.780.130.060.030.000.3974F 5/2 → 4 I 15/2 450 0.0000 0.0000 0.2237 0.26 873 1.00 1.154F 3/2 → 4 I 15/2 443 0.0000 0.0000 0.1204 0.14 690 1.00 1.444092H 9/2 → 4 I 15/2→ 4 F 7/2 2485→ 4 I 13/2556→ 4 I 11/2697 (T11)→ 4 I 9/2823→ 4 F 9/21079→ 2 H 11/218540.00000.07800.04280.01470.00550.03080.10580.01900.11940.08240.00620.03140.18280.04880.22550.35350.11280.00430.03690.06710.02400.290.830.390.060.110.450.43831953226211841526131.10.936.50.90.70.330.380.100.010.090.060.020.400383 (T2)4G 11/2 → 4 I 15/2→ 2 H 11/2 1394→ 4 I 13/2505→ 4 I 11/2618→ 4 I 9/2724→ 4 F 9/29050.91780.10110.00020.06450.44360.00060.52710.26420.49300.01170.03880.16000.11970.25500.01440.04670.01040.11003.791.000.750.271.450.3711620130052712032837.90.10.62.610.20.840.100.040.010.020.000.0724G 9/2 → 4 I 15/2 365 0.0000 0.2416 0.1235 0.50 2034 1.00 0.4922G 7/2 → 4 I 15/2 358 0.0000 0.0174 0.1163 0.16 839 1.00 1.192320 (T1)2P 3/2 → 4 I 15/2→ 4 S 3/2 763→ 4 I 13/2403 (T3)→ 4 I 11/2470 (T4)→ 4 I 9/2524→ 4 F 9/2618 (T8)0.00000.00000.00000.00000.00000.08470.00000.00000.13000.04400.05600.00000.02600.16000.02500.00920.00450.00000.030.180.220.080.090.26403124293623016425919.5 0.120.390.290.070.050.090.3102K 13/2 → 4 I 15/2 302 0.0032 0.0029 0.0152 0.03 167 1.00 5.99
D.G. O’Shea et al.: Upconversion channels in Er 3+ :ZBLALiP <strong>fluoride</strong> glass microspheres 7centred at 618 nm (T8) <strong>and</strong> 667 nm (T10) that have notbeen observed elsewhere for 980 nm pumping <strong>of</strong> Er.5 ConclusionsFig. 6. Erbium energy level diagram with radiative (solidlines) <strong>and</strong> non-radiative transitions. The thick, red line at1540 nm indicates the C-b<strong>and</strong> lasing transition.In conclusion, we have demonstrated a multiwavelengthmicrosphere light source for microphotonic applications[35] fabricated using Er 3+ :ZBLALiP <strong>and</strong> we haveidentified the Er 3+ transitions involved in the materialthrough a combination <strong>of</strong> Judd-Ofelt analysis, the erbiumenergy level diagram <strong>and</strong> the published centre wavelengths.Upconversion emissions from 320 nm to 849 nm<strong>and</strong> 1550 nm lasing have been observed. We propose that anumber <strong>of</strong> the upconversion transitions are attributable to3- <strong>and</strong> 4-photon processes, in contrast to previous observationsfor erbium-<strong>doped</strong> glasses. This is due to the longerbium lifetimes within Er 3+ :ZBLALiP that favour higherorder photon absorptions <strong>and</strong>, consequently, emissions inthe UV at 320 nm have been observed. These results indicatethat Er 3+ :ZBLALiP is an attractive alternative toEr 3+ :ZBLAN for information-storage applications whereeven very small powers are sufficient for data retrieval operations[16] <strong>and</strong> its improved stability [7] promises easierfabrication <strong>of</strong> devices using ZBLALiP such as erbium<strong>doped</strong> fibres, microspheres <strong>and</strong> <strong>optical</strong> switches. Futurework will focus on using integrated optics for the devicebased on waveguide technology [36] that will enable usto improve the detection efficiency for the upconversionspectrum.This work is funded by Science Foundation Irel<strong>and</strong> under grant02/IN1/128. D. O’Shea acknowledges generous support fromIRCSET through the Embark Initiative.ReferencesFig. 7. Intensity dependence <strong>of</strong> 70 μm diameterEr 3+ :ZBLALiP microsphere green emissions T6 <strong>and</strong> T7.at 383 nm (T2) <strong>and</strong> the 492 nm emission (T5) have beenreported under 973 nm excitation [33].Notably, we have also observed emissions about 700 nm(T11). Previous Er 3+ emission at 700 nm has been attributedto the transition 4 F 7/2 → 4 I 13/2 following absorption<strong>of</strong> three pump photons at 1480 nm [34]. Thisseems unlikely in our case, since the JO theory suggeststhat a 492 nm emission would be more probablethan a 700 nm emission from 4 F 7/2 . We presume thisassignment was on the basis <strong>of</strong> the 3-photon resonance4 F 7/2 → 4 I 15/2 . As an alternative, we propose this emissionfollows the transition 2 H 9/2 → 4 I 11/2 , which is inbetter agreement with the energy gap between the levels<strong>and</strong> the JO theory. Finally, we have observed emissions1. L. Collot, V. Lefèvre-Sequin, M. Brune, J.M. Raimond, S.Haroche, Europhys. Lett. 23, 327 (1993)2. H. Mabuchi, H.J. Kimble, Opt. Lett. 19, 749 (1994)3. W. von Klitzing, E. Jahier, R. Long, F. Lissillour, V.Lefèvre-Seguin, J. Hare, J.-M. Raimond, S. Haroche, J.Opt. B 2, 204 (2000)4. M. Cai, G. Hunziker, K.J. Vahala, IEEE Photon. Technol.Lett. 6, 686 (1999)5. T. Bilici, S. Isci, A. Kurt, A. Serpengüzel, IEEE Photon.Technol. Lett. 16, 476 (2004)6. F. Lissillour, D. Messager, G. Stéphan G.P. Féron, Opt.Lett. 26, 1051 (2001)7. M. Mortier, P. Goldner, P. Féron, G.M. Stephan, H. Xu,Z. Cai, J. Non-Cryst. Sol. 326&327, 505 (2003)8. M.-F. Joubert, Opt. Mat. 11, 181 (1999)9. H. Fujiwara H.K. Sasaki, J. Appl. Phys. 86, 2385 (1999)10. H. Fujiwara, K. Sasaki, Jpn. J. Appl. Phys. 41, L46 (2002)11. M. Cai, O. Painter, K.J. Vahala, Opt. Lett. 25, 1430 (2000)12. X. Peng, F. Song, S. Jiang, N. Peyghambarian, M. Kuwata-Gonokami, L. Xu, Appl. Phys. Lett. 82, 1497 (2003)13. J. Wu, S. Jiang, T. Qua, M. Kuwata-Gonokami, N.Peyghambarian, Appl. Phys. Lett. 87, 211118 (2005)
8 The European Physical Journal Applied Physics14. D.S. Funk, J.G. Eden, IEEE J. Sel. Top. Quant. Elec. 1,784 (1995)15. A. Florez, Y. Messaddeq, O.L. Malta, M.A. Aegerter, J.Alloys Comp. 227, 135 (1995)16. C.L. Pope, B.R. Reddy, S.K. Nash-Stevenson, Opt. Lett.22, 295 (1997)17. F. Lissilour, P. Féron, N. Dubreuil, P. Dupriez, G.M.Stéphan, M. Poulain, Proc. SPIE 3611, 199 (1999)18. J.P. van der Ziel, F.W. Ostermayer, L.G. van Uitert, Phys.Rev. B 2, 4432 (1970)19. R. Rolli, M. Montagna, A. Chiasera, G.C. Righini, S. Pelli,A. Jha, V.K. Tikhomirov, S.A. Tikhomirova, A. Monteil,S. Chaussedent, M. Ferrari, Phil. Mag. B 82, 573 (2002)20. T. Catunda, L.A.O. Nunes, A. Florez, Y. Messaddeq, M.A.Aegerter, Phys. Rev. B 53, 6065 (1996)21. M.D. Shinn, W.A. Sibley, M.G. Drexhage, R.N. Brown,Phys.Rev.B27, 6635 (1983)22. J.M. Ward, D.G. O’Shea, B.J. Shortt, M.J. Morrissey, K.Deasy, S.G. Nic Chormaic, Rev. Sci. Instrum. 77, 083105(2006)23. J.C.Knight,G.Cheung,F.Jacques,T.A.Birks,Opt.Lett.22, 1129 (1997)24. C. Florea, K.A. Winick, J. Lightwave, Technol. 17, 1593(1999)25. R.M. Martin, R.S. Quimby, J. Opt. Soc. B 23, 1770 (2006)26. S.R. Bullock, B.R. Reddy, P. Venkateswarlu, S.K. Nash-Stevenson, J.C. Fajardo, Opt. Quant. Electron. 29, 83(1997)27. M.J. Weber, Phys. Rev. 157, 262 (1967)28. W.T. Carnall, P.R. Fields, K. Rajnak, J. Chem. Phys. 49,4424 (1968)29. P.W. France, M.G. Drexhage, J.M. Parker, M.W. Moore,S.F. Carter, J.V. Wright, Fluoride Glass Optical Fibres(CRC Press Inc., Florida, 1990)30. L.F. Johnson, J.E. Geusic, H.J. Guggenheim, T. Kushida,S. Singh, L.G. van Uitert, Appl. Phys. Lett. 15, 48 (1969)31. H. Xu, Z. Jiang, Phys. Rev. B 66, 035103-1 (2002)32. F. Vetrone, J.-C. Boyer, J.A. Capobianco, A. Speghini, M.Bettinelli, Appl. Phys. Lett. 80, 1752 (2002)33. A. Biswas, G.S. Maciel, C.S. Friend, P.N. Prasad, J. Non-Cryst. Sol. 316, 393 (2003)34. S. Arahira, K. Watanabe, K. Shinozaki K.Y. Ogawa, Opt.Lett. 17, 1679 (1992)35. B.E.Little,J.-P.Laine,D.R.Lim,H.A.Haus,Opt.Lett.25, 73 (2000)36. S. Kobayashi, Proc. SPIE 2997, 264 (1997)To access this journal online:www.edpsciences.org
149Appendix DAn All Fibre-Coupled MulticolorMicrospherical Light Source
150
151
152
153Appendix EOptical Bistability in Er-Ybco-<strong>doped</strong> <strong>phosphate</strong> glassmicrospheres at room temperature
JOURNAL OF APPLIED PHYSICS 102, 023104 2007Optical bistability in Er-Yb co<strong>doped</strong> <strong>phosphate</strong> glass microspheresat room temperatureJonathan M. Ward aDepartment <strong>of</strong> Applied Physics <strong>and</strong> Instrumentation, Cork Institute <strong>of</strong> Technology,Bishopstown, Cork, Irel<strong>and</strong><strong>and</strong> Photonics Centre, Tyndall National Institute, Prospect Row, Cork, Irel<strong>and</strong>Danny G. O’SheaPhysics Department, University College Cork, Irel<strong>and</strong><strong>and</strong> Photonics Centre, Tyndall National Institute, Prospect Row, Cork, Irel<strong>and</strong>Brian J. ShorttDepartment <strong>of</strong> Applied Physics <strong>and</strong> Instrumentation, Cork Institute <strong>of</strong> Technology,Bishopstown, Cork, Irel<strong>and</strong><strong>and</strong> Photonics Centre, Tyndall National Institute, Prospect Row, Cork, Irel<strong>and</strong>Síle Nic ChormaicPhysics Department, University College Cork, Irel<strong>and</strong><strong>and</strong> Photonics Centre, Tyndall National Institute, Prospect Row, Cork, Irel<strong>and</strong>Received 15 February 2007; accepted 31 May 2007; published online 20 July 2007We experimentally demonstrate <strong>optical</strong> bistability in Er 3+ -Yb 3+ <strong>phosphate</strong> glass microspheres at 295K. Bistability is associated with both Er 3+ fluorescence <strong>and</strong> lasing behavior, <strong>and</strong> chromaticswitching. The chromatic switching results from an intrinsic mechanism exploiting the thermalcoupling <strong>of</strong> closely spaced energy levels, <strong>and</strong> occurs simultaneously with the intensity switching. Acontrast ratio <strong>of</strong> 2.8 has been obtained for chromatic switching. The intensity switching shows ratios<strong>of</strong> 21 for 520 nm <strong>and</strong> 11 for 660 nm fluorescence emissions, <strong>and</strong> 11 for IR lasing at 1.5 m.Concurrent with these observations, we investigate a temperature-dependent absorption <strong>of</strong> pumppower, which exhibits bistable behavior. The influences <strong>of</strong> the host matrix on lasing <strong>and</strong>fluorescence mechanisms are highlighted. © 2007 American Institute <strong>of</strong> Physics.DOI: 10.1063/1.2753591I. INTRODUCTIONa Electronic mail: Jonathan.ward@cit.ieOptical bistability OB in a sodium vapor was reportedby Gibbs in 1976 1 <strong>and</strong>, since then, numerous other materialsexhibiting the phenomenon have been studied, includingYb 3+ <strong>doped</strong> glasses <strong>and</strong> crystals, <strong>and</strong> semiconductors. 2–8 Themechanisms responsible for nonlinearity in glasses <strong>and</strong> crystalsare varied, with many requiring cryogenic temperaturestypically 40 K to maintain the necessary low atomic decayrates in Yb 3+ dimer <strong>and</strong> monomer systems. 3 Alternative<strong>and</strong> more easily achievable mechanisms include photon avalanche<strong>and</strong> thermal avalanche, 2,5 suggesting that a widerrange <strong>of</strong> materials can exhibit OB at room temperature <strong>and</strong>above. However, no evidence <strong>of</strong> OB through these mechanismsin this temperature range has yet been observed.Bistable sensitized luminescence in Er-Yb:CsCdBr 3 wasshown by Redmond <strong>and</strong> R<strong>and</strong>, 3 <strong>and</strong>, subsequently, byRódenas et al. 4 in a Nd-Yb co<strong>doped</strong> crystal. They also describedchromatic switching in addition to the more traditionalintensity switching, though both mechanisms requiredtemperatures well below room temperature. In chromaticswitching, the wavelengths <strong>of</strong> light emitted from an <strong>optical</strong>lypumped sample change abruptly as a function <strong>of</strong> pumppower. In contrast, for intensity switching, the output intensityat any particular wavelength changes abruptly as a function<strong>of</strong> pump power. To date, OB has also been predicted <strong>and</strong>observed in Yb 3+ <strong>doped</strong> oxide crystals, Cr-<strong>doped</strong> LiSrGaF 6<strong>and</strong> LiSrAlF 6 crystals, 5 Sm 3+ <strong>doped</strong> glass microspheres, 6 <strong>and</strong>Tm 3+ -Yb 3+ co<strong>doped</strong> glass. 7 The later system exhibited multiplehysteresis loops in the fluorescence intensity at roomtemperature.The interest in studying micron-sized spherical cavitiesstems from the potential they <strong>of</strong>fer as components for experimentsranging from the very applied realization <strong>of</strong> all-<strong>optical</strong>networks to fundamental quantum optics experiments,whereby the microspheres can be used as ultrahigh Q cavitiesfor measurements based on the principles <strong>of</strong> cavity quantumelectrodynamics. 9 Such microcavities can be either activeor passive depending on the material used. For example,a sphere <strong>doped</strong> with the triply ionized <strong>rare</strong>-<strong>earth</strong> ions Er 3+can yield fluorescence emissions ranging from UV to IRthrough various upconversion mechanisms, 10,11 due to theclose proximity <strong>of</strong> the numerous energy levels in the ion.Microcavities that exhibit <strong>optical</strong> bistability are interestingfor generating <strong>optical</strong> switches for all-<strong>optical</strong> computing, <strong>and</strong>miniature C-b<strong>and</strong> laser sources are important for telecommunicationsapplications. 12 These factors have resulted in significantresearch focusing on the characterization <strong>of</strong> microcavitiesin recent years.The concept <strong>of</strong> an Er 3+ -Yb 3+ co<strong>doped</strong> glass laser wasdemonstrated 13 in 1965 as a means <strong>of</strong> optimizing the Er 3+0021-8979/2007/1022/023104/7/$23.00102, 023104-1© 2007 American Institute <strong>of</strong> PhysicsDownloaded 13 Nov 2007 to 134.93.129.164. Redistribution subject to AIP license or copyright, see http://jap.aip.org/jap/copyright.jsp
023104-2 Ward et al. J. Appl. Phys. 102, 023104 2007FIG. 1. Color online a Upconversion fluorescencespectrum for three different pump powers in a50-m-diam IOG-2 microsphere. The inset shows anadditional weak violet emission from a 35-m-diammicrosphere, observable when no lasing emission at1.5 m is present <strong>and</strong> for a pump power <strong>of</strong> 8 mW. Theviolet emission has been scaled up by a factor <strong>of</strong> 5 forclarity. The ratio <strong>of</strong> the emission powers from the 2 H 11/2to 4 S 3/2 levels for a pump power <strong>of</strong> 9.2 mW is 1.34. bTransmitted power past the taper-sphere junction for the50 m sphere as shown in a. The three spectra in acorrespond with the three highlighted data points inb.emission cross section while simultaneously ensuring an optimumYb 3+ absorption cross section. 14 This overlap alleviatesthe difficulty <strong>of</strong> trying to directly pump the narrow Er 3+absorption b<strong>and</strong>. Phosphate glass has been investigated as ahost matrix for <strong>rare</strong>-<strong>earth</strong> ions due to its favorable properties,such as i the possibility <strong>of</strong> obtaining large dopant concentrationsup to 1.810 21 ions/cm 3 for Yb 3+ , <strong>and</strong>10 19 ions/cm 3 for Er 3+ compared to silicate, borate, <strong>and</strong><strong>fluoride</strong> glasses, ii its large absorption b<strong>and</strong> in the nearinf<strong>rare</strong>dregion, iii its large emission cross section at1.5 m, <strong>and</strong> iv the low back energy transfer from Er 3+ ionsto Yb 3+ ions. 15–17 The spectral characteristics are also especiallybeneficial for C-b<strong>and</strong> lasing; the intermediate lasinglevel 4 I 11/2 has a high nonradiative relaxation rate 1 slifetime, maximum phonon energy <strong>of</strong> 1300 cm −1 to the4 I 13/2 level compared with silica maximum phonon energy<strong>of</strong> 1190 cm −1 , <strong>and</strong> the long lifetime <strong>of</strong> the 4 I 13/2 level <strong>of</strong>about 8.45 ms facilitates population inversion <strong>and</strong> highgain. 12 The larger phonon energy <strong>of</strong> <strong>phosphate</strong> glass has anegative effect on the upconversion efficiency compared t<strong>of</strong>luoride glass with a maximum phonon energy <strong>of</strong>600 cm −1 . This, however, is counterbalanced by the largedopant concentrations <strong>and</strong> wide absorption cross section <strong>of</strong>the Yb 3+ sensitizer. In addition, <strong>phosphate</strong> glass has betteroptomechanical properties compared to other glasses usedfor OB, such as CsCdBr 3 .Here, we report on the simultaneous observation <strong>of</strong> chromatic<strong>and</strong> intensity OB in <strong>phosphate</strong> glass Schott IOG-2 atroom temperature. We present experimental results on lasingaround 1550 nm <strong>and</strong> propose suitable upconversion mechanismsfor the observed three color emission b<strong>and</strong>s. Opticalbistability previously demonstrated in passive silica 9,18 <strong>and</strong>silicon 8 resonators was attributed to nonlinearities arisingfrom the Kerr effect or thermo-optic effect <strong>of</strong> the resonanceline, together with high Q factors Q10 8 <strong>and</strong> a tunable,narrow linewidth laser. The results presented here clearlyshow that IOG-2 microspheres exhibit bistable switching behaviorunder vastly different conditions; we use microsphereswith relatively high loaded cavity Q’s typically 110 7 , <strong>and</strong> the pump laser has a linewidth <strong>of</strong> 1 nm <strong>and</strong> is notlocked to individual cavity resonances. For clarity, our resultsare organized in two sections: fluorescence <strong>and</strong> lasingemissions are discussed in Sec. III, <strong>and</strong> the results <strong>of</strong> the OBmeasurements are discussed in Sec. IV.II. EXPERIMENTThe IOG-2 glass used is <strong>doped</strong> with 2 wt % Er 2 O 31.710 20 ions/cm 3 <strong>and</strong> co<strong>doped</strong> with 3 wt % Yb 2 O 32.510 20 ions/cm 3 . We study lasing <strong>and</strong> upconversionfluorescent emissions following CW pumping with a tunable980 nm laser diode spectral width 1 nm. IOG-2 glass,with a low glass transition temperature <strong>of</strong> around 648 K, 19 isideal for producing microspheres with diameters <strong>of</strong> between30 <strong>and</strong> 70–m using a microwave plasma torch. 20 A detaileddescription <strong>of</strong> our experimental approach has been publishedelsewhere. 21 Efficient coupling <strong>of</strong> the pump into the microsphereis attained by using adiabatically tapered fibers fabricatedusing a direct heating technique. 22 Weusea1-mdiam,1550 nm SMF-28 fiber with a typical transmission loss<strong>of</strong> 0.1 dB/cm. The alignment <strong>of</strong> taper <strong>and</strong> microsphere isoptimized by adjusting the relative positions <strong>of</strong> the two,while maximizing the 1550 nm emissions. These lasingemissions are monitored by connecting one end <strong>of</strong> the fibertaper to an <strong>optical</strong> spectrum analyzer. During alignment wealso monitor the transmission through the fiber <strong>and</strong>, typically,10%−15% <strong>of</strong> the pump light is coupled into the microsphere.All upconversion fluorescence spectra were acquiredby free space coupling into an Ocean Optics 2000 spectrometer.III. LASING AND FLUORESCENCE IN IOG- 2In our first experiments, we changed the 980 nm pumppower from 0 to 10 mW <strong>and</strong> observed a clear change in thevisible emission spectra obtained, as shown in Fig. 1a forpowers <strong>of</strong> 2.6 mW, 8.5 mW, <strong>and</strong> 9.2 mW. These results wereobtained for a 50-m-diam sphere <strong>and</strong> the chromatic switchingbehavior is clearly evident at room temperature, by thechange in the ratio <strong>of</strong> the emissions at different wavelengthsfor the different pump powers. We note three distinct emissionb<strong>and</strong>s corresponding to erbium transitions at 520 nm 2 H 11/2 → 4 I 15/2 , 550 nm 4 S 3/2 → 4 I 15/2 , <strong>and</strong> 660 nm 4 F 9/2→ 4 I 15/2 . The red emission is stronger than red emissionsproduced in other singly <strong>doped</strong> glasses investigated in ourlaboratory, such as Er:ZBLALiP <strong>and</strong> Er:ZBNA, due to themuch larger Yb 3+ absorption cross section compared to Er 3+ .One would expect the slope <strong>of</strong> the fluorescence to exhibit aasimple power law dependence, I emission I excitation , where a isthe number <strong>of</strong> pump photons required to produce each emit-Downloaded 13 Nov 2007 to 134.93.129.164. Redistribution subject to AIP license or copyright, see http://jap.aip.org/jap/copyright.jsp
023104-3 Ward et al. J. Appl. Phys. 102, 023104 2007FIG. 2. Color online Lasing spectrum <strong>and</strong> whispering gallery mode structurefor a 50-m-diam IOG-2 microsphere same as for Fig. 1.ted photon, thus reflecting the multiphoton nature <strong>of</strong> the upconversionprocess. However, this law fails in the presence<strong>of</strong> OB, as will be shown in Sec. IV. Note that, on occasion,we have also observed a very weak, but distinct, fourth emissionb<strong>and</strong> in the UV corresponding to an erbium transition at405 nm 2 H 9/2 → 4 I 15/2 . The inset in Fig. 1a shows a fluorescencespectrum representing the UV to IR upconversionsfor a fixed pump power <strong>of</strong> 8 mW <strong>and</strong> a 35 m sphere. SuchUV emissions are only observed in spheres that do not lasearound 1550 nm, due to a competition between processesinvolved. We have also monitored the power transmitted pastthe taper-sphere junction as a function <strong>of</strong> launched pumppower into the fiber taper. This dependency is presented inFig. 1b as the pump power is varied from 0 to 10 mW <strong>and</strong>back to 0. These measurements allow us to estimate the couplingefficiency <strong>of</strong> light into the sphere as a function <strong>of</strong> pumppower.Figure 2 shows the observed IR lasing spectrum around1550 nm, for the same 50-m-diam IOG-2 sphere as in Fig.1, <strong>and</strong> 10 mW <strong>of</strong> pump power launched into the fiber taper. Asingle lasing peak <strong>and</strong> fluorescing whispering gallery modesare evident. Analysis <strong>of</strong> the whispering gallery modes in thefluorescence spectrum enables us to measure the free spectralrange FSR <strong>of</strong> the sphere modes to be 1.40 THz11.1 nm. Hence, we can calculate the microsphere diameterusing D=c/N FSR , where c is the speed <strong>of</strong> light invacuum <strong>and</strong> N is the refractive index <strong>of</strong> the material. Therefractive index <strong>of</strong> IOG-2 at room temperature is 1.508 at1540 nm, yielding a sphere diameter <strong>of</strong> 45 m. This agreesreasonably well with an <strong>optical</strong> microscope measurement <strong>of</strong>50±2 m. The measured spacing between TE <strong>and</strong> TMmodes <strong>of</strong> 8.05 nm around 1540 nm agrees well with thecalculated value <strong>of</strong> 8.40 nm. This microsphere has a peaklasing emission <strong>of</strong> 700 nW for a launched pump power <strong>of</strong>10 mW <strong>and</strong>, in general, we record lasing thresholds <strong>of</strong> lessthan 1 mW.For ions excited to the 2 F 5/2 level in Yb 3+ , IOG-2 has aquantum efficiency, = pump / laser , <strong>of</strong> about 60%−80%, resultingin the remaining 20%−40% being dissipated in thehost matrix as heat. The 2 H 11/2 level <strong>and</strong> the 4 S 3/2 level canbe considered to be in quasithermal equilibrium since theenergy gap is 740 cm −1 , 23 comparable to the maximumphonon energy <strong>of</strong> 1300 cm −1 for <strong>phosphate</strong> glass. 12 As such,FIG. 3. Color online Energy level diagram <strong>and</strong> fluorescence mechanismswith radiative solid lines <strong>and</strong> nonradiative transitions wiggly lines. ¬Upconversion based on GSA <strong>and</strong> ESA in ion A only; − radiative <strong>and</strong>nonradiative decays; ® <strong>and</strong> ¯ energy transfer processes from ion A to ionB populating the 4 F 9/2 level in ion A; ° GSA <strong>and</strong> ESA in ion B; CRcross relaxation; ET energy Transfer; GSA ground state absorption;ESA excited state absorption.only one phonon is required to bridge the energy differencebetween the two green levels, thereby populating the 2 H 11/2level at room temperature. The thermalization <strong>of</strong> the 2 H 11/2level by the 4 S 3/2 level has a temperature-dependent effect onthe ratio <strong>of</strong> the radiative emissions from these two levels aswell as the excited state lifetimes. 23 The multiphonon stimulatedemission rate between these levels at a temperature Tis 24 K mp T = K mp 01 − exp− −p, 1k B Twhere k B is Boltzmann’s constant, is the phonon frequency,<strong>and</strong> p is the number <strong>of</strong> phonons required to bridgethe energy gap E between the levels <strong>and</strong> is given byE/, where is the phonon energy. For Er-Yb co<strong>doped</strong>glasses, K mp 295 K is typically <strong>of</strong> the order <strong>of</strong> 10 11 s −1 ,which is significantly higher than the value <strong>of</strong> 10 3 s −1 reportedfor radiative emissions, 24 indicating that the multiphonondecay is dominant. The energy difference betweenthe 4 S 3/2 level <strong>and</strong> the next lowest level 4 F 9/2 , requires threephonons, therefore making this level far less likely to bepopulated from the 4 S 3/2 level.The emissions detected from the IOG-2 microsphere, asshown in Figs. 1 <strong>and</strong> 2, are due to upconversion processesinvolving multiple pump laser photons <strong>and</strong>/or latticephonons. Two upconversion mechanisms which must be consideredwhen trying to underst<strong>and</strong> the origin <strong>of</strong> the fluorescenceresults are excited state absorption ESA <strong>and</strong> energytransfer upconversion ETU. 23,25 These are shown in the energylevel diagram in Fig. 3, in which we identify a number<strong>of</strong> different groups <strong>of</strong> transition processes, ¬−°, that play aDownloaded 13 Nov 2007 to 134.93.129.164. Redistribution subject to AIP license or copyright, see http://jap.aip.org/jap/copyright.jsp
023104-4 Ward et al. J. Appl. Phys. 102, 023104 2007role in the generation <strong>of</strong> the emission spectra. The combination<strong>of</strong> relatively high cavity quality factor typically 110 7 <strong>and</strong> strongly localized electromagnetic field in theform <strong>of</strong> a whispering gallery mode mode volume3000 m 3 serves to significantly enhance the probabilitythat an excited ion will absorb further pump photons.Transition groups ¬ <strong>and</strong> ° in Fig. 3 are associated withthe ground state GSA <strong>and</strong> excited state absorptions in asingle erbium ion. As mentioned, there is a resonant energytransfer ET from the Yb 3+ sensitizer 2 F 5/2 → 2 F 7/2 to theEr 3+ ion 4 I 15/2 → 4 I 11/2 followed by 980 nm ESA from the4 I 11/2 level to the 4 F 7/2 level indicated in group ¬. Transitiongroup − deals with the radiative <strong>and</strong> nonradiative decay processesfor a single erbium ion. For example, rapid, nonradiativerelaxation from 4 I 11/2 to 4 I 13/2 is possible <strong>and</strong> fallswithin this group. In spite <strong>of</strong> a large energy mismatch <strong>of</strong>about 1450 cm −1 for the 4 I 13/2 → 4 F 9/2 transition, the longlifetime <strong>of</strong> the 4 I 13/2 state <strong>and</strong> associated large populationensures that the ETU mechanism is adequately efficient. 23,26Due to the close spacing <strong>of</strong> the 4 F 7/2 <strong>and</strong> 4 S 3/2 levels, thepopulation <strong>of</strong> 4 F 7/2 readily decays nonradiatively to the 4 S 3/2level, whereby the thermal mechanism described previouslypopulates the 2 H 11/2 level. Finally, a second ESA from the4 S 3/2 level up to the 2 G 7/2 level is followed by nonradiativerelaxation down to the 2 H 9/2 level <strong>and</strong> the subsequent radiativedecay to the ground state generates a photon at 410 nmviolet.At the high concentrations <strong>of</strong> Er 3+ <strong>and</strong> Yb 3+ in this workthe inter ion separation reaches a critically small radius <strong>of</strong>3 nm for Er 3+ ions <strong>and</strong> 2 nm for Yb 3+ ions. This isclose to the value <strong>of</strong> 2.12 nm for Yb 3+ -Yb 3+ ET’s <strong>and</strong> anestimated 1.5–2.0 nm for Yb 3+ -Er 3+ ET’s as determined fromthe Förster-Dexter theory, 27,28 dramatically enhancing theprobability <strong>of</strong> Yb 3+ -Yb 3+ , Yb 3+ -Er 3+ <strong>and</strong>, presumably,Er 3+ -Er 3+ energy transfers. The critical radius R sx is determinedby the overlap <strong>of</strong> the emission <strong>and</strong> absorption crosssections <strong>and</strong> is given byR 6 sx = 3c ss8 4 n 2 emsx absd,where c is the velocity <strong>of</strong> the photons, s =1.4 ms is thefluorescence decay time <strong>of</strong> the unperturbed sensitizer, n isthe refractive index, ems is the emission cross section, <strong>and</strong> abs is the absorption cross section. The emission <strong>and</strong> absorptioncross sections are shown in Fig. 4, <strong>and</strong> are determinedfrom measurements with a bulk sample <strong>of</strong> IOG-2. Theion s st<strong>and</strong>s for the sensitizer, i.e., the Yb 3+ ions, <strong>and</strong> the ionx st<strong>and</strong>s for either the sensitizer or the Er 3+ acceptor ions.For nonradiative dipole-dipole interactions the energy transferrate rapidly increases according to the inverse <strong>of</strong> the ionseparation to the sixth power.A further group − transition deals with red emissionsfrom a single erbium ion. However, the strength <strong>of</strong> the observedred emission cannot be wholly explained by multiphononrelaxation from the 4 S 3/2 level to the 4 F 9/2 level,due to the low relaxation rate. Notwithst<strong>and</strong>ing the ESA processalready mentioned, two ETU cross-relaxation channelscan explain the strength <strong>of</strong> the red emission relative to thegreen emissions <strong>and</strong> the associated processes are indicated2FIG. 4. Color online Absorption <strong>and</strong> emission cross sections for Er 3+ -Yb 3+co<strong>doped</strong> IOG-2 bulk glass.by transition groups ® <strong>and</strong> ¯ in Fig. 3. The first ETU is via4 I 11/2 B+ 4 I 13/2 A→ 4 I 15/2 B+ 4 F 9/2 A <strong>and</strong> the secondchannel is via2 H 11/2 B+ 4 I 11/2 A→ 4 F 9/2 B+ 4 F 9/2 A,where A <strong>and</strong> B denote the two erbium ions involved. Therefore,ions are removed from the green levels <strong>and</strong> transferredto the red 4 F 9/2 level. The two possible cross-relaxation processesfeeding the 4 F 9/2 level deplete the intermediate 4 I 11/2level <strong>and</strong> the metastable 4 I 13/2 level, thereby placing the1.5 m emission in competition with the red emission <strong>and</strong>the other upconversion processes. We find that the power <strong>of</strong>the red emission is, typically, twice as high in microspheresthat exhibit no lasing due to excessive inhomogeneities inthe cavity compared to those that exhibit lasing.IV. RESULTS AND DISCUSSIONA. Intensity switchingIn order to study the <strong>optical</strong> bistability <strong>of</strong> the microsphereswe measured the emission intensity as a function <strong>of</strong>launched pump power for a single sphere at three differentemission wavelengths: 520 nm green, 660 nm red, <strong>and</strong>1550 nm IR. The pump power was increased from 0 to 10mW <strong>and</strong> back to 0, while recording the fluorescence emissionintensities Fig. 5a. These measurements were takensimultaneously to the transmitted pump power shown in Fig.1b. As the launched pump power was increased the emissionintensities remained almost constant until a criticalpower <strong>of</strong> 8.5 mW was reached cf. Fig. 5a, beyond whicha sudden <strong>and</strong> dramatic rise in emission intensity was observed.Increasing the pump power beyond the critical pointcaused the emission to level out once more. A subsequentreduction in pump power clearly demonstrates hysteretic behavior<strong>and</strong> a wide bistable region, where the emission canhave two intensity values depending on the history <strong>of</strong> theinput power. The sudden jumps or intensity switching betweenthe higher <strong>and</strong> lower branches <strong>of</strong> the hysteresis loopsare characteristic <strong>of</strong> the <strong>optical</strong> bistability <strong>of</strong> the spheres. Abistable response was also observed for the lasing emissionin Fig. 5b for the same sphere, but in a slightly differentDownloaded 13 Nov 2007 to 134.93.129.164. Redistribution subject to AIP license or copyright, see http://jap.aip.org/jap/copyright.jsp
023104-5 Ward et al. J. Appl. Phys. 102, 023104 2007FIG. 5. Color online Intensity bistability for green 2 H 11/2 state, red 4 F 9/2state, <strong>and</strong> 1.5 m lasing from the 4 I 13/2 state for a 50-m-diam sphere. Theswitching positions for the green <strong>and</strong> red emissions in a differ from the1.5 m lasing emission in b due to a different setup with a poorer taperspherecoupling. The corresponding spectra for the visible fluorescence areshown in Fig. 1a.experimental setup with the sphere positioned on a differentposition <strong>of</strong> the taper. The critical power depends on the taperspherecoupling efficiency <strong>and</strong>, hence, differs for the twoexperiments presented in Fig. 5.A very promising feature <strong>of</strong> these microcavity resonatorsis the high contrast intensity switching observed; the ratio <strong>of</strong>the relative change in emission powers defined as the differencebetween the maximum <strong>and</strong> minimum powers, dividedby the minimum power is 21 for the green, 11 for the red,<strong>and</strong> 11 for the IR as determined from Fig. 5. The violetemission is too weak to be considered in these measurements.B. Chromatic switchingAs referred to earlier, the strong temperature dependencein IOG-2 is due to the loss <strong>of</strong> 20%−40% <strong>of</strong> the laser poweras heat in the glass, in conjunction with its low thermal conductivity.With reference to Fig. 1b, the sudden dip in transmittedpower implies increased pump absorption with an associatedincrease in the heat generation. In contrast, thesudden increase in transmitted power results in a decrease inheat generation. The increased absorption occurs simultaneouslywith the sudden rise in the 520 nm 2 H 11/2 emissionintensity as compared to the 550 nm 4 S 3/2 intensity that wasobserved when the pump power was increased above theupper switching position <strong>of</strong> 8.9 mW, as shown in Fig. 1b.As the pump power was reduced below the lower switchingposition <strong>of</strong> 3.3 mW, there was a sudden decrease in intensityratio due to the drop in pump absorption. Using the methodsoutlined by Qiao et al., 29 Boltzmann statistics can be used todescribe the strong thermal coupling <strong>and</strong> the population redistributionbetween the two green levels. The intensity ratiois a function <strong>of</strong> the internal cavity temperature <strong>and</strong> is describedas 29I 2 H 11/2 I 4 S 3/2 = r Hg H Hr S g S Sexp E3k b T,where I is the integrated emission intensity for a particularlevel, r is the total spontaneous emission rate, g is the 2J+1 multiplicity or degeneracy <strong>of</strong> each manifold, H S is the energy <strong>of</strong> level 4 H 11/2 4 S 3/2 , <strong>and</strong> E is theenergy separation between the levels. According to Eq. 3,as the temperature is increased the 2 H 11/2 level is more efficientlypopulated <strong>and</strong> an increasingly larger fraction <strong>of</strong> the4 S 3/2 population is rapidly promoted to this upper level <strong>and</strong>,consequently, the ratio <strong>of</strong> the emissions from the two statesinverts so that the 2 H 11/2 emission becomes stronger. Thischromatic switching can yield intensity ratios <strong>of</strong> up to 2.8 forthe integrated power from the 520 nm 2 H 11/2 <strong>and</strong> 550 nm 4 S 3/2 emissions data not shown. From Eq. 3 this indicatesa temperature <strong>of</strong> 642 K, just below the glass transitionvalue <strong>of</strong> 648 K. 19 This temperature seems exceptionally high,although there was no evidence <strong>of</strong> thermal stresses, fracturing<strong>of</strong> the glass or other defects in the microsphere duringthese measurements. However, it is important to emphasizethat the temperature calculated using this method does notrepresent the temperature <strong>of</strong> the entire sphere, but rather thetemperature <strong>of</strong> the mode volume. Heat dissipation from thisregion through the remainder <strong>of</strong> the material would accountfor no evident thermal stress on the sphere itself, which islikely to be at a much lower temperature.C. Temperature dependence <strong>of</strong> <strong>optical</strong> bistabilityPreviously reported mechanisms for OB in Tm-Yb<strong>doped</strong>BaY 2 F 8 crystals have suggested that photon avalanchemay be a possible mediator, while for silica microspheres theKerr effect led to OB at 2 K. 30,31 Both these mechanisms aretemperature independent. However, other mechanisms suchas the thermo-optic effect, 8,18 nonlinear upconversion <strong>and</strong> energytransfer rates, 32,33 <strong>and</strong> thermal avalanche 2 are temperaturedependent. In order to gain a further underst<strong>and</strong>ing onthe mechanisms involved, the temperature dependence <strong>of</strong> theOB was examined by placing a platinum heater <strong>and</strong> thermocoupleclose to the microsphere <strong>and</strong> heating it to around 345K. The pump power transmitted past the taper-sphere junctionwas recorded at the same time as the microsphere emissions,while cycling the pump power from low to high <strong>and</strong>back again as shown in Fig. 6. Comparison <strong>of</strong> the plots takenat room temperature <strong>and</strong> at 345 K shows that an increase inexternal temperature causes the upper knee at 17 mW inputpower to shift down to 13 mW, while the lower knee at 7mW only shifts slightly to the right, thereby shortening thebistable region. The pump power was cycled at a slow rate <strong>of</strong>1 mW/min due to the thermal response time <strong>of</strong> the microsphere.The bistable microsphere emissions are essentiallythe same as those shown in Fig. 5 except for the differentswitching positions, <strong>and</strong> the results shown in Fig. 6 implythat the bistable behavior is a function <strong>of</strong> temperature.D. Possible <strong>optical</strong> bistability mechanismsIn principle, a number <strong>of</strong> processes may be responsiblefor the observation <strong>of</strong> <strong>optical</strong> bistability, depending onwhether the observed effect is temperature dependent or independent.The measurements shown in Fig. 6 indicateclearly that the bistable behavior exhibited by our microspheresis temperature dependent, thereby permitting us toexclude temperature independent processes. Temperature-Downloaded 13 Nov 2007 to 134.93.129.164. Redistribution subject to AIP license or copyright, see http://jap.aip.org/jap/copyright.jsp
023104-6 Ward et al. J. Appl. Phys. 102, 023104 2007FIG. 6. Color online Bistable absorption <strong>of</strong> pump power at 295 <strong>and</strong> 345 Kfor a 50-m-diam sphere. The data at 345 K has been <strong>of</strong>fset for clarity. Asthe sphere temperature was increased from 295 K to 345 K, the knee at 17mW input power shifted to the left, while the lower knee at 7 mW onlyshifted slightly to the right, thereby shortening the bistable region.dependent mechanisms that may be responsible include materialeffects such as i strong Yb 3+ -Yb 3+ coupling, i.e., nonlinearenergy transfer, 32 ii nonlinear upconversion rates, 33<strong>and</strong> iii thermal avalanche, 2 in addition to cavity effects suchas iv dispersive bistability mediated by the thermo-opticeffect. 8,34Guillot-Nöel et al. 32 have described a mechanism thatcould be responsible for bistability in the regime <strong>of</strong> strongYb 3+ -Yb 3+ coupling, in which case cooperative luminescencewould be expected. In order to be appreciable, thedistance between the ions would need to be <strong>of</strong> the order <strong>of</strong>several Å, i.e., significantly smaller than for IOG-2 21 Å<strong>and</strong>, therefore, this effect is unlikely to play a key role. However,if it is present, the luminescence would likely be veryweak compared to the single ion Er 3+ transitions. It is reasonableto assume the back transfer rate is negligible due tothe high phonon energy <strong>of</strong> the host lattice, <strong>and</strong> is, therefore,unlikely to be the source <strong>of</strong> nonlinearity in our measurements.Another possible explanation includes a nonlinear upconversionrate either for Yb 3+ -Yb 3+ ,Yb 3+ -Er 3+ ,orEr 3+ -Er 3+energy transfers. 33 This has been observed in high concentrationEr 3+ <strong>doped</strong> fibers, where the nonlinearity is dependenton population inversion <strong>of</strong> the lasing levels, <strong>and</strong> the signal<strong>and</strong> emission rates. Temperature-dependent effects in the upconversionfluorescence in Er-YbGa 2 S 3 :La 2 O 3 chalcogenideglass <strong>and</strong> germanosilicate <strong>optical</strong> fibers have been attributedto an exponential increase in the Yb 3+ absorption cross sectionelsewhere. 35 However, there have been no reports <strong>of</strong>bistability relying on these mechanisms.Thermal avalanche was used to explain bistability inYb 3+ -<strong>doped</strong> bromide lattices by Gamelin et al. 2 at cryogenictemperatures. This theory relies on nonlinear absorption inthe Yb 3+ ions with increasing temperature <strong>and</strong> predictsbistable power absorbance in the microsphere as a function<strong>of</strong> pump power in the taper, similar to that shown in Fig. 6.As phonons are released into the lattice from Yb 3+ excited<strong>and</strong> ground states the temperature increases, thereby increasingabsorbance <strong>and</strong> leading to a further increase in temperature.This cyclic process causes a thermal avalanche for highenough pump power. In order to determine whether thermalavalanche is truly responsible, it would be necessary to performmeasurements <strong>of</strong> the dependence <strong>of</strong> the Yb 3+ absorptioncoefficient <strong>and</strong> to ascertain whether it is a nonlinearfunction <strong>of</strong> internal microsphere temperature above 295 K.However, the results presented in Lei et al. 36 for differentYb 3+ -<strong>doped</strong> <strong>phosphate</strong> glasses do not show a suitable nonlinearabsorption coefficient necessary for thermal avalanche.This suggests that thermal avalanche theory is also unsuitableto describe the behavior <strong>of</strong> IOG-2.We suggest that dispersive bistability 34 —a mechanismcommonly used to explain bistability in Fabry-Pérotetalons—can predict our results. The general theory statesthat as the pump laser frequency is scanned across a high-Qcavity resonance, the cavity intensity rapidly rises, <strong>and</strong> whenthe pump frequency moves away from the cavity resonancethe cavity intensity rapidly falls. In addition, this descriptionis complicated by the fact that the frequency <strong>of</strong> the cavityresonance scales approximately linearly with the cavity intensity,leading to a bistable response. In our case, the cavityresonance could be shifted by a temperature-dependent refractiveindex—the thermo-optic effect—which has a value<strong>of</strong> 10 −6 /K in <strong>phosphate</strong> glass. 20 We find that in order toobserve bistability the current to the pump laser, <strong>and</strong>, hence,the pump frequency, need to be adjusted to a precise settingfor each sphere. The corollary <strong>of</strong> this adjustment is the positioning<strong>of</strong> the laser frequency near a cavity resonance. Forthe experimental conditions here, a threshold power <strong>of</strong> about100 W in the cavity mode is enough to cause switching—avalue which is well below our estimated 10%−15% <strong>of</strong> pumppower coupled into the sphere. Firm evidence <strong>of</strong> this effectwould be possible by probing individual cavity resonanceswith a narrow linewidth, 980 nm external cavity diode laser,while recording the power transmitted past the taper-spherecoupling junction as described by Rokhsari et al. 18V. CONCLUSIONSIn conclusion, we have demonstrated a multiwavelength,upconversion, microsphere light source exhibiting <strong>optical</strong> bistability<strong>and</strong> we have identified the Er 3+ transitions <strong>and</strong> fluorescencemechanisms involved. Factors affecting the dynamics<strong>of</strong> visible fluorescence <strong>and</strong> C-b<strong>and</strong> lasing emission havebeen examined <strong>and</strong> show that the thermal properties <strong>of</strong>IOG-2 glass play an important role in the microsphere performance.In particular, the high loss <strong>of</strong> pump power to theglass as heat, in conjunction with the low thermal conductivity,has a pronounced effect on the green emission from levels2 H 11/2 <strong>and</strong> 4 S 3/2 . Our calculations show that the closeproximity <strong>of</strong> the ions in our glass greatly enhances the probability<strong>of</strong> sensitizer-sensitizer <strong>and</strong> sensitizer-acceptor energytransfers.We have also reported on the simultaneous observation<strong>of</strong> chromatic <strong>and</strong> intensity OB in <strong>phosphate</strong> glass SchottIOG-2 at room temperature. These results show that thereare two possible temperatures in the bistable region <strong>and</strong> it isalso possible to have two emission intensities for the sameexcitation power. Chromatic bistability is dependent on theDownloaded 13 Nov 2007 to 134.93.129.164. Redistribution subject to AIP license or copyright, see http://jap.aip.org/jap/copyright.jsp
023104-7 Ward et al. J. Appl. Phys. 102, 023104 2007presence <strong>of</strong> intensity bistability due to the energy couplingbetween the green emitting levels 2 H 11/2 <strong>and</strong> 4 S 3/2 . Thereforethe switching positions are the same for both types <strong>of</strong> bistability.The OB shows high contrast switching ratios. The intensityswitching shows ratios <strong>of</strong> 21 for the green, 11 for thered fluorescence emissions, <strong>and</strong> 11 for the IR lasing, whilethe chromatic switching ratios I 2 H 11/2 /I 4 S 3/2 are as highas 2.8.We have found that the switching position is dependenton the microsphere temperature, thereby eliminatingintensity-dependent mechanisms such as photon avalanche<strong>and</strong> the Kerr effect. Our observations may be tentatively explainedin terms <strong>of</strong> dispersive bistability, where thetemperature-dependent refractive index <strong>of</strong> <strong>phosphate</strong> glasscauses the resonant cavity mode <strong>and</strong> the laser mode to behavenonlinearly, yielding a bistable response. Several otherpossible mechanisms strong Yb 3+ -Yb 3+ coupling, nonlinearupconversion rates, <strong>and</strong> thermal avalanche were examined;however, all are considered unfavorable under our experimentalconditions.Microcavity resonators <strong>of</strong>fer substantial miniaturization,greatly reduced power for switching, <strong>and</strong> allow for all emissionsto be easily fiber coupled. In addition, the improvedoptomechanical properties <strong>of</strong> IOG-2 compared to otherglasses used for OB, such as CsCdBr 3 , makes this glass appealingfor all-<strong>optical</strong> logic elements in <strong>optical</strong> engineeringapplications.ACKNOWLEDGMENTSThis work was funded by Science Foundation Irel<strong>and</strong>under Grant No. 02/IN1/128. The authors gratefully acknowledgeP. Féron <strong>and</strong> L. Ghisa from ENSSAT for providingthe IOG-2 microspheres. D.O. S. acknowledges supportfrom the Irish Research Council for Science, Engineering<strong>and</strong> Technology through the Embark Initiative RS/2005/156.1 H. M. Gibbs, S. L. McCall, <strong>and</strong> T. N. C. Venkatesan, Phys. Rev. Lett. 36,1135 1976.2 D. R. Gamelin, S. R. Lüthi, <strong>and</strong> H. U. Güdel, J. Phys. Chem. B 104, 110452000.3 S. M. Redmond <strong>and</strong> S. C. R<strong>and</strong>, Opt. Lett. 28, 173 2003.4 A. Ródenas, D. Jaque, <strong>and</strong> J. García Solé, Phys. Rev. B 74, 0351062006.5 M. A. Noginov, M. Vondrova, <strong>and</strong> B. D. Lucas, Phys. Rev. B 65, 0351122001.6 T. Hayakawa, H. Ooishi, <strong>and</strong> M. Nogami, Opt. Lett. 26, 842001.7 A. Kuditcher, M. P. Hehlen, C. M. Florea, K. W. Winick, <strong>and</strong> S. C. R<strong>and</strong>,Phys. Rev. Lett. 84, 1898 2000.8 V. R. Almeida <strong>and</strong> M. Lipson, Opt. Lett. 29, 2387 2004.9 F. Treussart, J. Hare, L. Collot, V. Lefèvre, D. S. Weiss, V. S<strong>and</strong>oghdar, J.M. Raimond, <strong>and</strong> S. Haroche, Opt. Lett. 19, 1651 1994.10 G. H. Dieke <strong>and</strong> H. M. Crosswhite, Appl. Opt. 2, 675 1963.11 M.-F. Joubert, Opt. Mater. 11, 181 1999.12 P. Laporta, S. Taccheo, S. Longhi, O. Svelto, <strong>and</strong> C. Svelto, Opt. Mater.11, 269 1999.13 E. Snitzer <strong>and</strong> R. Woodcock, Appl. Phys. Lett. 6, 451965.14 X. Zou <strong>and</strong> H. Toratani, Phys. Rev. B 52, 15889 1995.15 S. Jiang, M. Myers, <strong>and</strong> N. Peyghambarian, J. Non-Cryst. Solids 239, 1431998.16 R. Wu, J. D. Myers, M. J. Myers, <strong>and</strong> C. Rapp, Proc. SPIE 4968, 112003.17 Z. Yang, Z. Feng, <strong>and</strong> Z. Jiang, J. Phys. D 38, 1629 2005.18 H. Rokhsari, S. M. Spillane, <strong>and</strong> K. J. Vahala, Appl. Phys. Lett. 85, 30292004.19 IOG-2 <strong>phosphate</strong> laser glass specification sheet, Schott Glass Technologies,400 York Ave., Duryea, PA 18642, USA.20 Z. Cai, A. Chardon, H. Xu, P. Féron, <strong>and</strong> G. M. Stéphan, Opt. Commun.203, 301 2002.21 B. J. Shortt, J. Ward, D. O’Shea, <strong>and</strong> S. Nic Chormaic, Proc. SPIE 6187,618708 2006.22 J. C. Knight, G. Cheung, F. Jacques, <strong>and</strong> T. A. Birks, Opt. Lett. 22, 11291997.23 J. F. Phillips, T. Töpfer, H. Ebendorff-Heiderpriem, D. Ehrt, <strong>and</strong> R. Sauerbrey,Appl. Phys. B 72, 399 2001.24 M. P. Hehlen, N. J. Cockr<strong>of</strong>t, T. R. Gosnell, <strong>and</strong> A. J. Bruce, Phys. Rev. B56, 9302 1997.25 M. J. Weber, Phys. Rev. B 8, 541973.26 M. Ajroud, M. Haouari, H. Ben Ouada, H. Mâaref, A. Brenier, <strong>and</strong> B.Champagnon, Phys. Status Solidi A 202, 3162005.27 T. Förster, Ann. Phys. 437, 551948.28 D. L. Dexter, J. Chem. Phys. 21, 836 1953.29 X. Qiao, X. Fan, M. Wang, J.-Luc Adam, <strong>and</strong> X. Zhang, J. Phys.: Condens.Matter 18, 6937 2006.30 M. A. Noginov, M. Vondrova, <strong>and</strong> D. Casimir, Phys. Rev. B 68, 1951192003.31 F. Treussart, V. S. Ilchenko, J.-F. Roch, J. Hare, V. Lefevre-Seguin, J.-M.Raimond, <strong>and</strong> S. Haroche, Eur. Phys. J. D 1, 2351998.32 O. Guillot-Nöel, L. Binet, <strong>and</strong> D. Gourier, Phys. Rev. B 65, 2451012002.33 B. Jaskorzyńska, S. Sergeyev, M. Świllo, <strong>and</strong> D. Khoptyar, Acta Phys.Pol. A 99, 147 2000.34 M. M. Mazumder, S. C. Hill, D. Q. Chowdhury, <strong>and</strong> R. K. Chang, J. Opt.Soc. Am. B 12, 297 1995.35 E. A. Gouveia, M. T. de Araujo, <strong>and</strong> A. S. Gouveia-Neto, Braz. J. Phys.31, 892001.36 G. Lei, J. E. Anderson, M. I. Buchwald, B. C. Edwards, R. I. Epstein, M.T. Murtagh, <strong>and</strong> G. H. Seigel, IEEE J. Quantum Electron. 34, 1839 1998.Downloaded 13 Nov 2007 to 134.93.129.164. Redistribution subject to AIP license or copyright, see http://jap.aip.org/jap/copyright.jsp
161Appendix FExternal Cavity Diode LaserDesign Files
162
163
164
165
166
167
168
169
Figure F.1: Electrical wiring diagram for the ECDL <strong>and</strong> laser diode controller.170
171Bibliography[1] E. J. Burkes, J. Hoke, E. Gomes <strong>and</strong> M. Wolbarsht. \Wet versus dry enamelablation by Er:YAG laser." J. Prosthet. Dent., 67, 847, 1992.[2] K. J. Vahala. \Optical microcavities." Nature, 424, 2003, 1987.[3] J. C. Knight. \Photonic crystal bers." Nature, 424, 847, 2003.[4] V. B. Braginsky <strong>and</strong> V. S. Ilchenko. \Properties <strong>of</strong> <strong>optical</strong> dielectric microresonators."Sov. Phys. Dokl., 32, 36, 1987.[5] C. G. B. Garrett, W. Kaiser, <strong>and</strong> W. L. Bond. \Stimulated emission into <strong>optical</strong>whispering modes <strong>of</strong> spheres." Phys. Rev., 124, 1807, 1961.[6] T. Baer. \Continuous-wave laser oscillation in a Nd:YAG sphere." Opt. Lett.,12, 392, 1987.[7] A. A. Savchenkov, A. B. Matsko, V. S. Ilchenko, <strong>and</strong> L. Maleki. \Opticalresonators with ten million nesse." Opt. Express, 15, 6768, 2007.[8] H. B. Lin, A. L. Huston, J. D. Eversol, <strong>and</strong> A. J. Campillo. \Double-resonancestimulated Raman scattering in micrometer-sized droplets." J. Opt. Soc. Am.B., 7, 2079, 1990.
172[9] J. Z. Zhang <strong>and</strong> R. K. Chang. \Generation <strong>and</strong> suppression <strong>of</strong> stimulatedbrillouin-scattering in single liquid droplets." J. Opt. Soc. Am. B., 6, 151,1989.[10] F. Treussart, V. S. Ilchenko, J.-F. Roch, J. Hare, V. Leferve-Seguin, J.-M.Raimond, <strong>and</strong> S. Haroche. \Evidence for intrinsic Kerr bistability <strong>of</strong> high-Qmicrosphere resonators in super liquid helium." Eur. Phys. J. D, 1, 235, 1998.[11] S. M. Spillane, T. J. Kippenberg, <strong>and</strong> K. J. Vahala. \Ultralow-threshold Ramanlaser using a spherical dielectric microcavity." Nature, 415, 621, 2002.[12] T. J. Kippenberg, S. M. Spillane, B. Min, <strong>and</strong> K. J. Vahala. \Theoretical <strong>and</strong>experimental analysis <strong>of</strong> stimulated <strong>and</strong> cascaded Raman scattering in ultrahigh-Q<strong>optical</strong> microcavities." IEEE J. Select. Top. Quant. Electron., 10, 1219,2004.[13] T. J. Kippenberg, S. M. Spillane, <strong>and</strong> K. J. Vahala. \Kerr nonlinearity induced<strong>optical</strong> parametric oscillation in a toroid microcavity." Phys. Rev. Lett., 93,083904, 2004.[14] H. Rokshari, <strong>and</strong> K. J. Vahala. \Observation <strong>of</strong> Kerr nonlinearity in microcavitiesat room temperature." Opt. Lett., 30, 427, 2005.[15] H. M. Gibbs, S. L. McCall, <strong>and</strong> T. N. C. Venkatesan. \Dierential gain <strong>and</strong>bistability using a sodium lled Fabry Perot interferometer." Phys. Rev. Lett.,36, 1135, 1976.[16] D. R. Gamelin, S. R. Luthi, <strong>and</strong> H. U. Gudel. \The Role <strong>of</strong> Laser Heating inthe Intrinsic Optical Bistability <strong>of</strong> Y b3 + -Doped Bromide Lattices." J. Phys.Chem. B, 104, 11045, 2000.[17] S. M. Redmond <strong>and</strong> S. C. R<strong>and</strong>. \Intrinsic chromatic switching <strong>of</strong> visible luminescencein Yb 3+ , Er 3+ :CsCdBr 3 ." Opt. Lett., 28, 173, 2003.
173[18] A. Rodenas, D. Jaque, <strong>and</strong> J. Garca Sole. \Bistable chromatic switching inYb 3+ -<strong>doped</strong> NdPO 4 crystals." Phys. Rev. B, 74, 035106, 2006.[19] M. A. Noginov, M. Vondrova, <strong>and</strong> B. D. Lucas. \Thermally induced <strong>optical</strong>bistability in Cr-<strong>doped</strong> Colquiriite crystals." Phys. Rev. B, 65, 035112, 2001.[20] T. Hayakawa, H. Ooishi, <strong>and</strong> M. Nogami. \Optical bistability <strong>of</strong> stimulatedemissionlines in Sm 3+ -<strong>doped</strong> glass microspheres." Opt. Lett., 26, 84, 2001.[21] A. Kuditcher, M. P. Hehlen, C. M. Florea, K. W. Winick, <strong>and</strong> S. C. R<strong>and</strong>.\Intrinsic bistability <strong>of</strong> luminescence <strong>and</strong> stimulated emission in Yb- <strong>and</strong> Tm<strong>doped</strong>glass." Phys. Rev. Lett., 84, 1898, 2000.[22] V. R. Almedia <strong>and</strong> M. Lipson. \Optical bistability on a silicon chip." Opt.Lett., 29, 2387, 2004.[23] M. Saad <strong>and</strong> J.-S. Tasse. \MID-IR OPTICS: Fluoride glasses draw ber intothe mid-inf<strong>rare</strong>d." Laser Focus World, 43, 2007.[24] M. Mortier, P. Goldner, P. Feron, G. M. Stephan, H. Xu, Z. Cai. \New uorideglasses for laser applications." J. Non-Crys. Sol., 326-327, 505, 2003.[25] S. M. Spillane, T. J. Kippenberg, O. J. Painter, <strong>and</strong> K. J. Vahala. \Ideality ina ber-taper-coupled micro-resonator system for application to cavity quantumelectrodynamics." Phys. Rev. Lett., 91, 043902, 2003.[26] T. Mashide. \Study <strong>of</strong> spherical microlasers levitated in an ion trap." Ph.D.thesis, Kochi University <strong>of</strong> Technology, 2002.[27] S. Schiller. \Asymptotic expansion <strong>of</strong> morphological resonance frequencies inMie scattering." Appl. Opt., 32, 2181, 1993.
174[28] C. C. Lam, P. T. Leung <strong>and</strong> K. Young. \Explicit asymptotic formulas for thepositions, widths, <strong>and</strong> strengths <strong>of</strong> resonances in mie scattering." J. Opt. Soc.Am. B, 9, 1585, 1992.[29] J. R. Buck <strong>and</strong> H. J. Kimble. \Optimal sizes <strong>of</strong> dielectric microspheres forcavity QED with strong coupling." Phys. Rev. A, 67, 033806, 2003.[30] B. Little. J.-P. Laine, <strong>and</strong> H. A. Haus. \Analytic theory <strong>of</strong> coupling from taperedbers <strong>and</strong> half-blocks into microsphere resonators." J. Lightwave Technol., 17,704, 1999.[31] M. L. Gorodetsky, A. A. Savchenkov, <strong>and</strong> V. S. Ilchenko. \Ultimate Q <strong>of</strong> <strong>optical</strong>microsphere resonators." Opt. Lett., 21, 453, 1996.[32] D. W. Vernooy, V. S. Ilchenko, H. Mabuchi, E. W. Streed, <strong>and</strong> H. J. Kimble.\High-Q measurements <strong>of</strong> fused-silica microspheres in the inf<strong>rare</strong>d." Opt. Lett.,23, 247, 1998.[33] M. L. Gorodetsky, A. D. Pryamikov, <strong>and</strong> V. S. Ilchenko, V. Lefevre-Seguin, L.-M. Raimond, <strong>and</strong> S. Haroche. \Rayleigh scattering in high-Q microspheres."J. Opt. Soc. Am. B, 17, 1051, 2000.[34] D. S. Weiss, V. S<strong>and</strong>oghdar, J. Hare, V. Lefevre-Seguin, L.-M. Raimond, <strong>and</strong>S. Haroche. \Splitting <strong>of</strong> high-Q modes induced by backscattering in silicamicrospheres." Opt. Lett., 20, 1835, 1995.[35] D. W. Vernooy <strong>and</strong> H. J. Kimble. \Quantum structure <strong>and</strong> dynamics for atomgalleries." Phys. Rev. A, 55, 1239, 1997.[36] S. M. Spillane. \Fiber-coupled ultra-high-Q microresonators for nonlinear <strong>and</strong>quantum optics." Ph.D. thesis, California Institute <strong>of</strong> Technology, 2004.
175[37] V. B. Braginsky, M. L. Gorodetsky, <strong>and</strong> V. S. Ilchenko. \Quality-factor <strong>and</strong>nonlinear properties <strong>of</strong> <strong>optical</strong> whispering-gallery-modes." Phys. Lett. A, 137,393, 1989.[38] R. Casprary. \Applied <strong>rare</strong>-<strong>earth</strong> spectroscopy for ber laser optimization."Ph.D. thesis, Von der Gemeinsamen Fakultat fur Maschinenbau und Elektrotechnikder Technischen Universitat Carolo-Wilhelmina zu Braunschweig,2002.[39] F. Auzel. \Upconversion <strong>and</strong> anti-Stokes processes with f <strong>and</strong> d ions in solids."Chem. Rev., 104, 139, 2004.[40] F. Lissillour, D. Messager, G. Stephan <strong>and</strong> P. Feron. \Whispering-gallery-modelaser at 1.56 m excited by a ber taper." Opt. Lett., 26, 1051, 2001.[41] S. Gotzinger, O. Benson, <strong>and</strong> V. S<strong>and</strong>oghdar. \Towards controlled couplingbetween a high-Q whispering-gallery mode <strong>and</strong> a single nanoparticle." Appl.Phys. B, 73, 825, 2001.[42] G. Griel, S. Arnold, D. Taskent, A. Serpenguzel, J. Connolly, <strong>and</strong> N. Morris.\Morphology-dependent resonances <strong>of</strong> a microsphere-<strong>optical</strong> ber system." Opt.Lett., 21, 695, 1996.[43] V. S. Ilchenko, X. S. Yao <strong>and</strong> L. Maleki. \Pigtailing the high-Q microspherecavity: a simple ber coupler for <strong>optical</strong> whispering gallery modes." Opt. Lett.,24, 723, 1999.[44] L. Tong, J. Lou, <strong>and</strong> E. Mazur. \Single-mode guiding properties <strong>of</strong>subwavelength-diameter silica <strong>and</strong> silicon wire waveguides." Opt. Express, 12,1025, 2004.
176[45] F. Le Kien, J. Q. Liang, K. Hakuta, <strong>and</strong> V. I. Balykin. \Field intensity distributions<strong>and</strong> polarization orientations in a vacuum-clad subwavelength-diameter<strong>optical</strong> ber." Opt. Commun., 242, 445, 2004.[46] J. C. Knight, G. Cheung, F. Jacques, <strong>and</strong> T. A. Birks. \Phase-matched excitation<strong>of</strong> whispering-gallery-mode resonances by a ber taper." Opt. Lett., 22,1129, 1997.[47] A. W. Snyder <strong>and</strong> J. D. Love. Optical Waveguide Theory. Kluwer AcademicPublishers, 2000.[48] L. Tong, R. R. Gattass, J. B. Ashcom, S. He, J. Lou, M. Shen, I. Maxwell,<strong>and</strong> E. Mazur. \Subwavelength-diameter silica wires for low-loss <strong>optical</strong> waveguiding." Nature, 426, 816, 2003.[49] G. Brambilla, V. Finazzi, <strong>and</strong> D. J. Richardson. \Ultra-low-loss <strong>optical</strong> bernanotapers." Opt. Express, 12, 2258, 2004.[50] T. E. Dimmick, G. Kakarantzas, T. A. Birks, <strong>and</strong> P. St. J. Russel. \Carbondioxide laser fabrication <strong>of</strong> fused-ber couplers <strong>and</strong> tapers." Appl. Opt., 38,6845, 1999.[51] M. Summetsky, Y. Dulashko, <strong>and</strong> A. Hale. \Fabrication <strong>and</strong> study <strong>of</strong> bent <strong>and</strong>coiled free silica nanowires: Self-coupling microloop <strong>optical</strong> interferometer."Opt. Express, 12, 3521, 2004.[52] M. Sumetsky. \Whispering-gallery-bottle microcavities: the three-dimensionaletalon." Opt. Lett., 29, 8, 2004.[53] T. A. Birks <strong>and</strong> Y. W. Li. \The shape <strong>of</strong> ber tapers." J. Lightwave Technol.,10, 432, 1992.
177[54] A. Grellier, N. K. Zayer, <strong>and</strong> C. N. Pannell. \Heat transfer modelling in CO 2laser processing <strong>of</strong> <strong>optical</strong> bres." Opt. Commun., 152, 324, 1998.[55] Laser 2000 UK Ltd. 671XX series drive card, <strong>and</strong> 6210H series moving magnetgalvanometer scanner specifaication sheet.[56] Radionics Ltd. Hybrid stepper motor, stock number 440-436, 500:1 gear box,stock number 718-925, <strong>and</strong> controller circuit, stock number 217-3611.[57] J. D. Love, W. M. Henry, W. J. Stewart, R. J. Black, S. Lacroix, <strong>and</strong> F.Gonthier. \Tapered single-mode bres <strong>and</strong> devices. I. Adiabaticity criteria."IEEE Proc. J, 138, 343, 1991.[58] M. Sumetsky, Y. Dulashko, J. M. Fini, A. Hale, <strong>and</strong> D. J. DiGiovanni. \Themicrober loop resonator: Theory, experiment, <strong>and</strong> application." J. LightwaveTechnol., 24, 242, 2006.[59] W. von Klitzing, R. Long, V. S. Ilchenko, J. Hare, <strong>and</strong> V. Lefevre-Seguin.\Tunable whispering gallery modes for spectroscopy <strong>and</strong> CQED experiments."New J. Phys., 3, 141, 2001.[60] Y. Louyer, D. Meshede, <strong>and</strong> A. Rauschenbeutel. \Tunable whispering-gallerymoderesonators for cavity quantum electrodynamics." Phys. Rev. A, 72,031801, 2005.[61] G. Kakarantzas, T. E. Dimmick, T. A. Birks, R. Le Roux, <strong>and</strong> P. St. J. Russel.\Miniature all-ber devices based on CO2 laser microstructuring <strong>of</strong> taperedbers." Opt. Lett., 26, 1137, 2001.[62] C. McAtamney, A. Cronin, R. Sherlock, G. M. OConnor, <strong>and</strong> T. J. Glynn.\Reproducible method for fabricating fused biconical tapered couplers using aCO2 laser based process." Proc. 3rd International WLT-Conference on Lasersin Manufacturing, 2005.
178[63] M.-F. Joubert. \Photon avalanche upconversion in <strong>rare</strong> <strong>earth</strong> laser materials."Opt. Mat., 11, 181, 1999.[64] D. S. Funk <strong>and</strong> J. G. Eden. \Glass-ber lasers in the ultraviolet <strong>and</strong> visible."IEEE J. Sel. Top. Quant. Elec., 1, 784, 1995.[65] J. P. van der Ziel, F. W. Ostermayer, <strong>and</strong> L. G. Van Uitert. \Inf<strong>rare</strong>d Excitation<strong>of</strong> Visible Luminescence in Y 1Rev. B., 2, 4432, 1970.x Er x F 3 via Resonant Energy Transfer." Phys.[66] R. Rolli, M. Montagna, A. Chiasera, G. C. Righini, S. Pelli, A. Jha, V. K.Tikhomirov, S. A. Tikhomirova, A. Monteil, S. Chaussedent, <strong>and</strong> M. Ferrari.\A comparative study <strong>of</strong> the spectroscopic properties at 1.5 m <strong>of</strong> erbiumactivateduoride <strong>and</strong> tellurite glasses." Phil. Mag. B., 82, 573, 2002.[67] T. Catunda, L. A. O. Nunes, A. Florez, Y. Messaddeq, <strong>and</strong> M. A. Aegerter.\Spectroscopic properties <strong>and</strong> upconversion mechanisms in Er 3+ -<strong>doped</strong> uoroindateglasses." Phys. Rev. B., 53, 6065, 1996.[68] M. D. Shinn, W. A. Sibley, M. G. Drexhage, <strong>and</strong> R. N. Brown. \Opticaltransitions <strong>of</strong> Er 3+ ions in uorozirconate glass." Phys. Rev. B., 27, 6635,1983.[69] C. Florea <strong>and</strong> K. A. Winick. \Ytterbium-<strong>doped</strong> glass waveguide laser fabricatedby ion exchange." J. Lightwave Technol., 17, 1593, 1999.[70] A. Florez, Y. Messaddeq, O. L. Malta, <strong>and</strong> M. A. Aegerter. \Optical transitionprobabilities <strong>and</strong> compositional dependence <strong>of</strong> Judd-Ofelt parameters <strong>of</strong> Er 3+ions in uoroindate glass." J. Alloys Compounds, 227, 135, 1995.[71] R. M. Martin <strong>and</strong> R. S. Quimby. \Experimental evidence <strong>of</strong> the validity <strong>of</strong> theMcCumber theory relating emission <strong>and</strong> absorption for <strong>rare</strong>-<strong>earth</strong> glasses." J.Opt. Soc. B, 23, 1770, 2006.
179[72] S. R. Bullock, B. R. Reddy, P. Venkateswarlu, S. K. Nash-Stevenson, <strong>and</strong> J.C. Fajardo. \Energy upconversion <strong>and</strong> spectroscopic studies <strong>of</strong> ZBLAN:Er 3+ ."Opt. Quant. Electron., 29, 83, 1997.[73] M. J. Weber. \Probabilities for radiative <strong>and</strong> nonradiative decay <strong>of</strong> Er 3+ inLaF 3 ." Phys. Rev., 157, 262, 1967.[74] W. T. Carnall, P. R. Fields, <strong>and</strong> K. Rajnak. \Electronic energy levels in thetrivalent lanthanide aquo ions. I. Pr 3+ , Nd 3+ , Pm 3+ , Sm 3+ , Dy 3+ , Ho 3+ , Er 3+ ,<strong>and</strong> Tm 3+ ." J. Chem. Phys., 49, 4424, 1968.[75] J. Yang, S. Dai, N. Dai, L. Wen, L. Hu, <strong>and</strong> Z. Jiang. \Investigation onnonradiative decay <strong>of</strong> 4 I 13=2 ! 4 I 15=2 transition <strong>of</strong> Er 3+ -<strong>doped</strong> oxide glasses."J. Lumin., 9, 106, 2004.[76] P. W. France, M. G. Drexhage, J. M. Parker, M. W. Moore, S. F. Carter, <strong>and</strong>J. V. Wright. Fluoride Glass Optical Fibres. Florida, 1990.[77] C. L. Pope, B. R. Reddy, <strong>and</strong> S. K. Nash-Stevenson. \Ecient violet upconversionsignal from a uoride ber <strong>doped</strong> with erbium." Opt. Lett., 22, 295,1997.[78] L. F. Johnson, J. E. Geusic, H. J. Guggenheim, T. Kushida, S. Singh, <strong>and</strong> L.G. van Uitert. \Comments on materials for ecient inf<strong>rare</strong>d conversion." Appl.Phys. Lett., 15, 48, 1969.[79] H. Xu <strong>and</strong> Z. Jiang. \Ultraviolet <strong>and</strong> violet upconversion luminescence in Er 3+ -<strong>doped</strong> yttrium aluminum garnet crystals." Phys. Rev. B., 66, 035103, 2002.[80] F. Vetrone, J.-C. Boyer, J. A. Capobianco, A. Speghini <strong>and</strong> M. Bettinelli. \980nm excited upconversion in an Er-<strong>doped</strong> ZnOTeO 2 glass." Appl. Phys. Lett.,80, 1752, 2002.
180[81] A. Biswas, G. S. Maciel, C. S. Friend, <strong>and</strong> P. N. Prasad. \Upconversion properties<strong>of</strong> a transparent Er 3+ Yb 3+ co-<strong>doped</strong> LaF 3 SiO 2 glass-ceramics prepared bysolgel method." J. Non-Crys. Sol., 316, 393, 2003.[82] S. Arahira, K. Watanabe, K. Shinozaki, <strong>and</strong> Y. Ogawa. \Successive excitedabsorption through a multistep process in highly Er 3+ -<strong>doped</strong> ber pumped bya 1.48-m laser diode." Opt. Lett., 17, 1679, 1992.[83] M. Pollnau, D. R. Gamelin, S. R. Luthi, <strong>and</strong> H. U. Gudel. \Power dependence<strong>of</strong> upconversion luminescence in lanthanide <strong>and</strong> transition-metal-ion systems."Phys. Rev. B, 61, 3337, 2000.[84] M. R. Poulsen, P. I. Borel, J. F.-Pedersen, J. Hubner, M. Kristensen, J. H.Povlsen, K. Rottwitt, M. Svalgaard, <strong>and</strong> W. Svendsen. \Power dependence<strong>of</strong> upconversion luminescence in lanthanide <strong>and</strong> transition-metal-ion systems."Opt. Eng., 42, 2821, 2003.[85] J.-P. Laine, B. E. Little, D. R. Lim, H. C. Tapalian, L. C. Kimerling, <strong>and</strong> H. A.Haus. \Microsphere resonator mode characterization by pedestal anti-resonantreecting waveguide coupler." IEEE Photon. Technol. Lett., 12, 1004, 2000.[86] E. Snitzer <strong>and</strong> R. Woodcock. \Yb 3+ -Er 3+ glass laser." Appl. Phys. Lett., 6, 45,1965.[87] X. Zou <strong>and</strong> H. Toratani. \Evaluation <strong>of</strong> spectroscopic properties <strong>of</strong> Yb 3+ -<strong>doped</strong>glasses." Phys. Rev. B, 52, 15889, 1995.[88] S. Jiang, M. Myers, <strong>and</strong> N. Peyghambarian. \Er 3+ <strong>doped</strong> <strong>phosphate</strong> glasses<strong>and</strong> lasers." J. Non-Cryst. Solids, 239, 143, 1998.[89] R. Wu, J.D. Myers, M.J. Myers, <strong>and</strong> C. Rapp. \Fluorescence lifetime <strong>and</strong> 980nmpump energy transfer dynamics in erbium <strong>and</strong> ytterbium co-<strong>doped</strong> <strong>phosphate</strong>laser glasses." Proc. SPIE, 4968, 11, 2003.
181[90] L. Yang, T. Carmon, B. K. Min, S. M. Spillane, <strong>and</strong> K. J. Vahala. \Erbium<strong>doped</strong><strong>and</strong> Raman microlasers on a silicon chip fabricated by the sol-gelprocess." Appl. Phys. Lett., 86, 091114, 2005.[91] P. Laporta, S. Taccheo, S. Longhi, O. Svelto, <strong>and</strong> C. Svelto. \Erbium ytterbiummicrolasers: <strong>optical</strong> properties <strong>and</strong> lasing characteristics." Opt. Mat., 11, 269,1999.[92] Schott Glass Technologies. IOG-2 <strong>phosphate</strong> laser glass specication sheet.[93] Z. Cai, A. Chardon, H. Xu, P. Feron, <strong>and</strong> G. M. Stephan. \Laser characteristicsat 1535 nm <strong>and</strong> thermal eects <strong>of</strong> an Er:Yb <strong>phosphate</strong> glass microchip pumpedby Ti:sapphire laser." Opt. Commun., 203, 301, 2002.[94] M. Laroche, S. Girard, J. K. Sahu, W. A. Clarkson, <strong>and</strong> J. Nilsson. \Accurateeciency evaluation <strong>of</strong> energy-transfer processes in phosphosilicate Er 3+ Yb 3+ -co<strong>doped</strong> bers." J. Opt. Soc. Am. B, 23, 195, 2006.[95] K. T. V. Grattan, A. W. Palmer, <strong>and</strong> C. A. Wilson. \A miniaturisedmicrocomputer-based neodymium `decay-time' temperature sensor." J. Phys.E, 20, 1201, 1987.[96] M. P. Hehlen, N. J. Cockr<strong>of</strong>t, <strong>and</strong> T. R. Gosnell. \Spectroscopic properties <strong>of</strong>Er 3+ - <strong>and</strong> Yb 3+ -<strong>doped</strong> soda-lime silicate <strong>and</strong> aluminosilicate glasses." Phys.Rev. B, 56, 9302, 1997.[97] J. F. Phillips, T. Topfer, H. Ebendor-Heiderpriem, D. Ehrt, <strong>and</strong> R. Sauerbrey.\Spectroscopic <strong>and</strong> lasing properties <strong>of</strong> Er 3+ :Yb 3+ -<strong>doped</strong> uoride <strong>phosphate</strong>glasses." Appl. Phys. B, 72, 399, 2001.
182[98] M. Ajroud, M. Haouari, H. Ben Ouada, H. M^aaref, A. Brenier, <strong>and</strong> B. Champagnon.\Study <strong>of</strong> the spectroscopic properties <strong>and</strong> inf<strong>rare</strong>d-to-visible upconversionuorescence <strong>of</strong> Er 3+ -<strong>doped</strong> germanate glasses." Phys. Status SolidiA, 202, 316, 2005.[99] D. L. Dexter. \A theory <strong>of</strong> sensitized luminescence in solids." J. Chem. Phys.,21, 836, 1953.[100] X. Qiao, X. Fan, M. Wang, J.-Luc Adam, <strong>and</strong> X. Zhang. \Spectroscopic properties<strong>of</strong> Er 3+ /Yb 3+ co-<strong>doped</strong> 50SiO 2 20Al 2 O 3 30CaF 2 glass <strong>and</strong> glass ceramics."J. Phys.: Condens. Matter, 18, 6937, 2006.[101] Kigre, Inc. QE-7S <strong>phosphate</strong> laser glass specication sheet.[102] H. Rokhsari, S. M. Spillane, <strong>and</strong> K. J. Vahala. \Loss characterization in microcavitiesusing the thermal bistability eect." Appl. Phys. Lett., 85, 3029,2004.[103] O. Guillot-Noel, L. Binet, <strong>and</strong> D. Gourier. \General conditions for intrinsic <strong>optical</strong>bistability at the atomic <strong>and</strong> molecular scale: An eective spin-Hamiltonianapproach." Phys. Rev. B., 65, 245101, 2002.[104] B. Jaskorzynska, S. Sergeyev, M. Swillo, <strong>and</strong> D. Khoptyar. \Nonlinearupconversion-rate in Er-<strong>doped</strong> bers." Acta Phys. Pol. A, 99, 147, 2000.[105] Md. M. Mazumder, S. C. Hill, D. Q. Chowdhury, R. K. Chang. \Dispersive<strong>optical</strong> bistability in a dielectric sphere." J. Opt. Soc. Am. B, 12, 297, 1995.[106] E. A. Gouveia, M. T. de Araujo, <strong>and</strong> A. S. Gouveia-Neto. \Thermal eectson light emission in Yb 3+ -sensitized <strong>rare</strong>-<strong>earth</strong> <strong>doped</strong> <strong>optical</strong> glasses." Braz. J.Phys., 37, 89, 2001.
183[107] G. Lei, J. E. Anderson, M. I. Buchwald, B. C. Edwards, R. I. Epstein, M. T.Murtagh, <strong>and</strong> G. H. Seigel. \Spectroscopic evaluation <strong>of</strong> Yb 3+ -<strong>doped</strong> glassesfor <strong>optical</strong> refrigeration." IEEE J. Quantum Electron., 34, 1839, 1998.[108] V. B. Braginsky, M. L. Gorodetsky, <strong>and</strong> V. S. Ilchenko. \Optical whisperinggallerymicroresonators." Proc. SPIE, 2097, 283, 1993.[109] A. E. Fomin, M. L. Gorodetsky, I. S. Grudinin, V. S. Ilchenko. \Nonstationarynonlinear eects in <strong>optical</strong> microspheres." J. Opt. Soc. Am. B, 22, 459, 2005.[110] A. B. Matsko, A. A. Savchenkov, D. Strekalov, V. S. Ilchenko <strong>and</strong> L. Maleki.\Review <strong>of</strong> applications <strong>of</strong> whispering-gallery mode resonators in photonics <strong>and</strong>nonlinear optics." IPN Progress Report, 42{162, 2005.[111] D. G. O'Shea, J. M. Ward, B. J. Shortt, <strong>and</strong> S. Nic Chormaic. \An all-bercoupled multicolor microspherical light source." To appear in IEEE Photon.Technol. Lett., (physics/0611197), 2007.[112] J. Ward <strong>and</strong> S. Nic Chormaic. \Taper-fused microspherical laser." 2007. Inpreparation for IEEE Photon. Technol. Lett.[113] M. Cai, B. Hunziker, <strong>and</strong> K. J. Vahala. \Fibre-optic Add-Drop device based ona silica microsphere-whispering gallery mode system." IEEE Photon. Technol.Lett., 11, 686, 1999.[114] A. S. Arnold, J. S. Wilson, <strong>and</strong> M. G. Boshier. \A simple extended-cavity diodelaser." Rev. Sci. Instrum., 69, 1236, 1998.[115] C. J. Hawthorn, K. P. Weber, <strong>and</strong> R. E. Scholten. \Littrow congurationtunable external cavity diode laser with xed direction output beam." Rev.Sci. Instrum., 72, 4477, 2001.
184[116] L. Ricci, M. Weidemuller, T. Esslinger, A. Hemmerich, C. Zimmermann, V.Vuletic, W. Konig, <strong>and</strong> T. W. Hansch. \A compact grating-stabilized diodelaser system for atomic physics." Opt. Commun., 117, 541, 1995.[117] R. Scholten. \http://optics.ph.unimelb.edu.au/atomopt/atomopt.html."[118] W. von Klitzing, E. Jahier, R. Long, F. Lissillour, V. Lefevre-Seguin, J. Hare, J.-M. Raimond, <strong>and</strong> S. Haroche. \Very low threshold green lasing in microspheresby up-conversion <strong>of</strong> IR photons." J. Opt. B, 2, 204, 2000.[119] M. Mortier. \Private communication."[120] H. Fujiwara <strong>and</strong> K. Sasaki. \Microspherical lasing <strong>of</strong> an erbium-ion-<strong>doped</strong> glassparticle." Jpn. J. Appl. Phys., 41, L46, 2002.