Michelson Lab.pdf
Michelson Lab.pdf
Michelson Lab.pdf
- No tags were found...

Create successful ePaper yourself
Turn your PDF publications into a flip-book with our unique Google optimized e-Paper software.
Part (D) Measuring the wavelength and spectra of an unknown laser usingFourier Transform SpectroscopyProcedure:Follow the Procedure of Part (B).Do the following:1. Remove the vacuum chamber and ensure that the system is fully aligned as inPart (A) with the photodetector in place.2. Replace the HeNe Laser with the unknown laser, and ensure that you haveinterference fringes.3. Use the “Motor” tab of main.vi to take a large data set (move more than 5mm)while moving the motor at a relatively slow speed. Save the data.WARNING: operating the motor at too high a speed greatly distorts the FourierTransform Waveform. Can you explain why this is so?4. Open the data set using ReadData.vi. Insert the calibration factor that wascalculated in Part (A).5. Perform the Fourier Transform Analysis and comment on the wavelength ofoperation of the laser.6. Does the laser operate at a single wavelength?7. Provide printouts of the screen capture of your analysis (Press Alt-PrntScrn tocapture the screen) to support your analysis.8. If the unknown laser has more than one peak, (i.e. not single mode) complete(9) and (10) below...9. What is the wavelength separation between adjacent peaks?10. What is the frequency separation between adjacent peaks?4 of 13
Appendix 1 – <strong>Lab</strong>View ProgramsYou have been provided with two <strong>Lab</strong>View programs:1. Main.vi2. ReadData.viMain.vi (Motor Tab)At the top left of the screen is an arrow. This needs to be pressed before the programwill begin. Once the program has started, press the Move Home button to reset themotor (see #3 below).Once the program is running, there are four buttons that can be pressed (from R to L):1. End Program: this ends the program.2. Move Absolute: the causes the motor to move the micrometer at maximumspeed to the desired absolute position. The absolute position is inserted in thetext box labelled “Move Absolute Position”3. Move Home: This causes the motor to perform a Home operation. This shouldbe done first thing once the program starts!4. Take Data: This causes the motor to move at the desired speed for the desireddistance, taking data according to the desired step. The speed of the motor isinserted in the text box labelled “Set Speed”. The desired distance is enteredin the text box labelled “Move Relative Distance”. The desired increment orstep between data points is inserted in the text box labelled “DataDisplacement Step”5 of 13
Additional Notes: A good speed will be in the range 0.005 to 0.05 mm/sec. You will need to experiment to find a good data increment in order toproperly see the fringes. The total movement of the motor is 24mm. Pay attention to the currentlocation of the motor, labelled “Absolute Position” before taking data.If the absolute position is at 10mm, the maximum relative distance thatyou will be able to move is 14mm. If the absolute position is already24mm, you will not be able to move any significant distance. Use theMove Absolute button to move the motor back to a starting pointbefore taking data.Main.vi (Time tab)The second tab of this program is very simple and is designed to assist with thecalculation of the index of refraction of air. At the top left of the screen is an arrow.This needs to be pressed before the program will begin.Once the program is running there are two buttons that can be pressed: Start and Stop(or End). When start is pressed data from photodiode is taken according to the amountof millisecond to wait per data point. The data will be graphed (and can be saved).Click here to bring up the “Time” tab6 of 13
ReadData.vi (“Analysis” tab of main.vi)This tab is used to do the Fourier Transform required to change your fringe data intospectral data of the last data set recorded by the “Motor” tab of main.vi. Alternatively,if using saved data then ReadData.vi program is used.Begin by inserting the correct calibration factor (that you have already calculated).Then make sure that the X File Path input field points to your data set. This can bedone either by typing in the file location, or by pressing the button (shaped like afolder) to the right of the text field, and then locating your file.Start the program and press the Perform Data Analysis Button.7 of 13
You are interested in looking at the graph of amplitude vs. wavelength at the expectedwavelength of the HeNe laser. Sometimes the graph does not show the desired range.Use the input fields – Max Wavelength, and Min Wavelength to alter the range that isbeing viewed. Note that the view is in units of meters. The screen image can becaptured by pressing Alt-PrntScrn (the alternate key and the print screen key).8 of 13
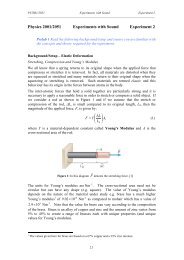
Appendix 2 – Mathematics of Fourier Transform SpectroscopyIntroduction:The first thing we are interested in is the expected power output of the detector givena monochromatic input source. From here it is easy to generalize to the morephysically realistic case of a continuous input source. The next step is themathematics of the Fourier Transform itself, which allows us to determine thespectrum of the source given the value of the modulated power output at the detector.Finally, returning to the idealized monochromatic source we use a clevermathematical trick to obtain the spectral resolution of the interferometer setup.Section 1: Derivation of Expected Power OutputBefore we begin with the math let’s quickly go over the experimental setup. The beamenters the interferometer at the input and travels to the beam splitter. At the beamsplitter, a fraction of the beam is reflected toward Mirror 1 and the remaining fractionis transmitted toward Mirror 2. The beam which was previously reflected by the BS(the one which travelled along Z1) is now transmitted and the part of the beam whichwas originally transmitted is now reflected. The result is that the two components ofthe beam exit through the output port.But why is this at all useful? Let’s start with the case in which path Z1 is equal to pathZ2. In that case, the two beams travelling along their respective paths will be in phasewith each other at the output port and will therefore constructively interfere. If, on theother hand, the two paths differ by half a wavelength, the two beams will be out ofphase with each other and will destructively interfere. The trick of the FourierTransform Spectrometer is that one path (let’s say Z1) is held constant while the otherpath (Z2) is varied. By observing how the intensity at the output port varies with thepath difference we can effectively deduce the spectrum of the source. This isaccomplished by a clever mathematical device known as the Fourier Transform.Now for the maths. Let’s assume for simplicity that the input is a monochromaticsource; later we’ll generalize this result to the more physically realistic case of acontinuous input spectrum. Our input source has the form: A sin kztE MS09 of 13
The beam enters through the input port and travels toward the beam splitter. Thereflected part of the beam travels toward M1 and is reflected back toward the beamsplitter. Just before returning to the beam splitter, the beam now has the form:ER r A sin 0kz z1Rtwhere |r| is the reflection coefficient, and Rany phase change due to reflection. Thenew term in the argument of the Sin function accounts for the phase change whichoccurs due to travelling along path Z1 and back.Similarly, the part of the beam that is transmitted, after travelling to Mirror 2 andreturning to the beam splitter will produce an E-field:ET t A sin 0kz z2Ttwhere again, |t| denotes the transmission coefficient and Tdenotes the phase changeintroduced by the beam splitter.The beam that was originally reflected (the one which travelled along path Z1 toMirror1 and back) will now be transmitted through the beam splitter and travel towardthe detector, giving rise to an E-field at the output detector:ERT r t A sin 0kz z1RTtSimilarly, the beam that was originally transmitted (the one which travelled alongpath Z2 and back) will now be reflected:ETR t r A sin 0kz z2RTtThe total E-field will be the sum of these two fields. Also, we assume that:1t r 2Substituting these values into the expressions for E TR and E RT , we can add the two:E ERT ETR r t A0 sinkz z1RTtsinkz z2RTtwhich is in the form of:A0 E ERT ETR sin kz1sin kz24We have analysed this before and it can be simplified to:2AI 0 1 coskz4, where z z 1 z2The expression above is exactly what we are looking for: the mean power output atthe detector given a monochromatic source. Using the same argument as above, it iseasy to see that a source with a continuous spectrum of the form:E contwill produce the following power output:I kk1112A41Aksintd1cos kzThe difference here is that the amplitude A(k) is now non-zero for a range offrequency, or k-values instead of just for one frequency, which means that we mustperform an integration over this range to obtain the mean power output. Recall thatthe mean power output for a monochromatic source depends on two constants A andk. The generalized power function directly above depends on some function A 2 (k),which is precisely the function that gives the spectrum of the input source. Thisdk10 of 13
spectrum is exactly what we are looking for, since after all we are performingspectroscopy. We will soon see that by measuring the mean power output I(ΔZ) wecan work backwards (via the magic of Fourier transformation) to obtain the spectrumfunction A 2 (k).Section 2: Mathematics of Fourier TransformsBefore we can apply the Fourier transform, we need to obtain the power output in aslightly different form.I zk1k1A4kThe first term is a constant in terms oflooking for.2 k1dk If some function A(k) can be expressed as:Ak12A4kcos kzdk z . The second term is of the form we arey1k Bycosky Then, we can apply the cosine Fourier transform to obtain:By1dy1y Akcosky21 y yTherefore, going back to our equation for the intensity from the interferometer:We can say:I zk2A4DHere we ignore the constant term to give:k1kdk1 2A C coskzdk4kDk1 IkC cos kzDdz2A Ikcoskzdz4DAnd this is exactly what we need to calculate the spectrum of the source, which isgiven by A 2 (k) (the power intensity of each spectral component k) in terms of I(ΔZ)(the measured power output of the detectors).To obtain the spectrum function A 2 (k) we do the following:1) Measure the mean power output I(Δz) over as large a range of path differenceas possible.2) Plot the power output as a function of path difference Δz.3) Input this into I(Δz) in the above expression and take a Fourier Transform.This gives the desired output, which is the spectrum function A 2 (k).The parameter D comes in the limits of integration, and represents the total range ofpath length difference used in the experiment. In other words, D is the total distancethat the second mirror is moved while a measurement of the power output is beingtaken. We want D to be as large as possible however, and we will soon see that theeffect of making D large is to increase the spectral resolution of the spectrometer(more on this in the next section)11 of 13
Section 3: Calculation of Spectral ResolutionTo calculate the spectral resolution of the FTS we will use a clever trick. Basicallywhat we need is the spectrum (given of course by A 2 (k)) that we would obtain for anidealized monochromatic source. If Fourier Transform Spectroscopy were perfect,then a monochromatic source would yield a spectrum which is non-zero only at thefrequency k 0 (a Dirac spike). But because the total path length difference D isnecessarily finite, what we actually obtain is a power spectrum peaked at k 0 whichfalls off quickly as you move away from the central frequency.First let’s figure out what the measured spectrum A 2 (k) will look like given amonochromatic source. Recall that the power output corresponding to amonochromatic source can be expressed as:2A0 I 1 cosk0z4Plugging this in to:yields:kD2A4kDDIkcoskzDdz222A A0A0 coskzdz cosk0zcoskzdz4 44DDHere the first term oscillates and for large D can be ignored. The second term issolved using trig identities:Thus:AndD2 D2AA020k A kz kzdz k k z k k z 0cos0coscos0cosD2D22 A 0sin k k0zsinA k 2 k k0k kk k00zk k 0Dk k DDdz2 2sink k0D sinA k A0 k k00By this point you may have lost track of the definitions of k 0 and k. k 0 is a constantdenoting the actual propagation constant of the monochromatic source, and k is avariable denoting the measured frequency range. Since k 0 is approximately equal to k(otherwise our spectrometer wouldn’t be of much use) we notice that:1k k k k so the first term in brackets dominates and we can neglect the second term.If we let: k k D , then we have:X0A20k1sin XXThe Sin(X)/X term acts as an envelope function, since the function is greatest in therange:012 of 13
X2Outside of this range the function goes quickly to values which oscillate with smallamplitude about zero. So, as a first-order approximation, we can assume that A 2 (k)=0for x outside of this range. In other words, for a reasonable signal: k k0D or k 2 2DWhere k is the resolution in k. If we consider the resolution in frequency, we write:2ck c 2D4DFor wavelength, we write: 1 1 2 12k 2 221 21 2 Therefore:22 2 2D 4DThe conclusion is that a monochromatic input source will yield a measured spectrumof width centred at 0. This means that the spectrometer will be unable to resolvetwo spectral components which are closer to each other than24Dis the spectral resolution of the FTS in wavelength units.2. In other words,4DIn order to maximize our resolution, we also need to maximum the total distancetravelled. This is far more important than the separation of individual points.WARNING: While this is correct, vibrations and other changes will damage theintegrity of the larger data sets. You will likely find that a smaller data set will workthe best (~5mm travel). But, if you do manage to conduct the measurement withoutvibrations or other excess noise, then the larger data sets will provide the best data.13 of 13