Seismic Behavior of Sheathed Cold-Formed Steel Stud Shear Walls ...
Seismic Behavior of Sheathed Cold-Formed Steel Stud Shear Walls ...
Seismic Behavior of Sheathed Cold-Formed Steel Stud Shear Walls ...
- No tags were found...

You also want an ePaper? Increase the reach of your titles
YUMPU automatically turns print PDFs into web optimized ePapers that Google loves.
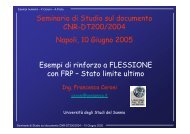
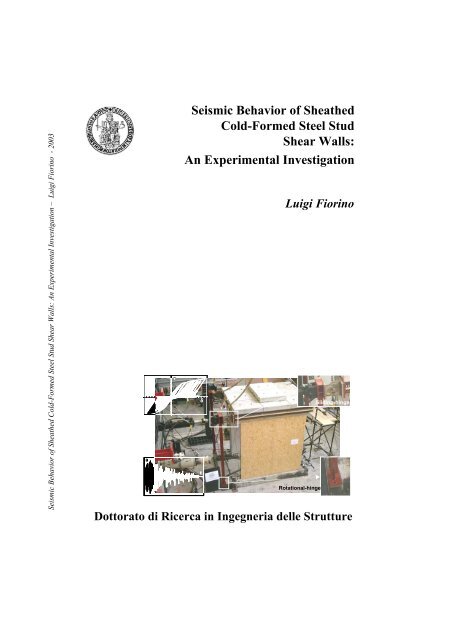
<strong>Seismic</strong> <strong>Behavior</strong> <strong>of</strong> <strong>Sheathed</strong> <strong>Cold</strong>-<strong>Formed</strong> <strong>Steel</strong> <strong>Stud</strong> <strong>Shear</strong> <strong>Walls</strong>: An Experimental Investigation – Luigi Fiorino - 2003av<strong>Seismic</strong> <strong>Behavior</strong> <strong>of</strong> <strong>Sheathed</strong><strong>Cold</strong>-<strong>Formed</strong> <strong>Steel</strong> <strong>Stud</strong><strong>Shear</strong> <strong>Walls</strong>:An Experimental InvestigationtLuigi FiorinoRotational-hingeSliding-hingeDottorato di Ricerca in Ingegneria delle Strutture
Università degli <strong>Stud</strong>i di Napoli Federico IIPolo delle Scienze e delle TecnologieLuigi Fiorino<strong>Seismic</strong> <strong>Behavior</strong> <strong>of</strong> <strong>Sheathed</strong> <strong>Cold</strong>-<strong>Formed</strong><strong>Steel</strong> <strong>Stud</strong> <strong>Shear</strong> <strong>Walls</strong>:An Experimental InvestigationTesi di dottoratoXVI CicloDottorato di ricerca in Ingegneria delle Strutture
I would like to express my sincere gratitude to my tutor Pr<strong>of</strong>. FedericoM. Mazzolani, who has guided me during the doctoral activity. Hisenthusiasm and determination have represented a clear example for myresearch activity and not only for it.I am much thankful to Pr<strong>of</strong>. Raffaele Landolfo who <strong>of</strong>fered and madepossible my studies in the field <strong>of</strong> cold-formed steel structures. This researchwould not have been possible without his supervision and support.Thanks to Dr. Gaetano Della Corte for his assistance in this study,particularly in the field <strong>of</strong> seismic engineering. I appreciate a lot <strong>of</strong> useful helpthat I received from His.I would like to thank to Dr. Beatrice Faggiano for her aid. She alwayssomehow found time to help me and all-working group.The suggestion and constructive criticism <strong>of</strong> Dr. Gianfranco De Matteisis also gratefully acknowledged.I thank my fellow engineers, Ettore de Cesbron de la Grennellais,Gianmaria Di Lorenzo, Maurizio Manganiello, Simeone Panico, FrancescoPortioli, who shared with me the experiences <strong>of</strong> the PhD period.I respectfully acknowledge the financial support given to the researchproject by the Italian Ministry for University and Research. Also I extend theacknowledgements to the BPB Italia for the furniture <strong>of</strong> gypsum wall boardsheathings and the assembling <strong>of</strong> the specimens, the GUERRASIO for thefurniture <strong>of</strong> cold-formed steel pr<strong>of</strong>iles, the TECFI s.r.l. for the furniture <strong>of</strong>screws, and the HILTI Italia for the furniture <strong>of</strong> anchors.I also wish to thank my family for their affection, and encouragement aswell as their appreciation <strong>of</strong> my studies.Last, but not least thanks to my wife Stefania for his love, patience,emotional and material support.
To my grandmother Assuntina
iContentsForeword 1Chapter ILow-rise residential buildings built with cold-formedlightweight steel members 51.1 BASIC CONSTRUCTION SYSTEMS…………………………………………………………….. 61.2 STICK-BUILT CONSTRUCTIONS………...………………………………………...…………... 81.3 PROFILES…...………….……………………………………………………………………………151.4 SHEATHINGS.……………………………………………………………………………………… 181.4.1 Wood-based panels…………………………………………………………………………………... 181.4.2 Gypsum-based boards………………………………………………………………………………... 201.5 CONNECTIONS…………………………………………………………………………………….. 211.5.1 Screws………………………………………………………………………………………………... 221.5.2 Welding………………………………………………...…………………………………………….. 241.5.3 Pins…..……………………………………………………………………………………………….. 241.5.4 Nails………………………………………………………………………………………………….. 261.5.5 Bolts………………………………………………………………………………………………….. 261.5.6 Anchors………………………………………………………………...…………………………….. 261.5.7 Adhesives…………………………………………………………………………………………….. 301.5.8 Hold-down...………………………………………………………………………………………….. 301.6 THE BUILDING PROCESS………………………………………………………………………... 311.7 BASIC PROBLEMS OF STRUCTURAL DESIGN………………………………………………. 341.7.1 Vertical loads………………………………………………………………………………………… 341.7.2 Horizontal loads……………………………………………………………………………………… 351.8 ADDITIONAL CONSIDERATIONS……………………………………………………………… 381.8.1 Fire resistance………………………………………………………………………………………… 381.8.2 Durability…………………………………………………………………………………………….. 391.8.3 Thermal and acoustic insulation, air and moisture permeability…………………………………….. 401.9 ADVANTAGES AND LIMITATIONS……………………………………………………………. 41REFERENCES…………………………………………………………………………………………… 42Chapter IIDesign <strong>of</strong> cold-formed steel stud shear walls 452.1 MAIN DESIGN METHODOLOGIES FOR SHEAR STRENGTH OF CFSSSWS……………... 46
Contentsii2.2 SEMI-ANALYTICAL EVALUATION OF SHEAR STRENGTH ………………………………. 482.2.1 Strength <strong>of</strong> the sheathing-to-frame connections (S-F)……………………………………………….. 502.2.2 Strength <strong>of</strong> the frame (stud buckling strength) (F)…………………………………………………… 552.2.3 Strength <strong>of</strong> the frame-to-foundation connections (F-F)……………………………………………… 672.3 UNITS SHEAR DESIGN VALUES FOR CFSSSWS…………………………………………….. 762.3.1 UBC and IBC design tables………………………………………………………………………….. 762.3.2 IRC provisions on the PSW method utilizations…………………………………………………….. 83REFERENCES…………………………………………………………………………………………… 84Chapter IIITesting <strong>of</strong> cold-formed steel stud shear walls: review <strong>of</strong>existing literature 893.1 SUMMARY OF MAIN EXISTING TEST PROGRAMS……………………………………. 893.1.1 McCreless & Tarpy (1978)…………………………………………………………………………... 903.1.2 Tarpy & Hauenstein (1978)………………………………………………………………………….. 923.1.3 Tarpy (1980)………………………………………………………………………….………………. 923.1.4 Tarpy & Girard (1982)……………………………………………………………….………………. 943.1.5 Tissell (1993)………………………………………………………………………………………… 963.1.6 Serrette (1994)……………………………………………………………………….……………….. 973.1.7 Serrette & Ogunfunmi (1996)……………………………………………………….……………….. 973.1.8 Serrette et al. (1996a,b)………………………………………………………………………………. 993.1.9 Serrette et al. (1997a)………………………………………………………………………………… 1013.1.10 Serrette et al. (1997b)………………………………………………………………………………… 1043.1.11 NAHB Research Center (1997)……………………………………………………………………… 1073.1.12 Gad et al. (1999a, b)………………………………………………………………………………….. 1083.1.13 Selenikovich et al. (1999)……………………………………………………………………………. 1113.1.14 COLA-UCI (2001)…………………………………………………………………………………… 1123.1.15 Dubina & Fulop (2002)………………………………………………………………………………. 1143.1.16 Branston et al. (2003)………………………………………………………………………………… 1163.2 FACTOR AFFECTING CFSSSW BEHAVIOR UNDER LATERAL LOADING: THEYINDIVIDUATION AND ANALYSIS…………………………………………………………. 1183.2.1 Sheathing (type, thickness, orientation)……………………………………………………………… 1183.2.2 Framing (stud size, thickness and spacing, presence <strong>of</strong> X-bracing)…………………………………. 1203.2.3 Fastener (type, size, spacing)………………………………………………………………………… 1203.2.4 Geometry (wall aspect ratio, openings)……………………………………………………………… 1213.2.5 Type <strong>of</strong> loading (monotonic or cyclic)……………………………………………………………….. 1233.2.6 Construction techniques and anchorage details……………………………………………………… 124REFERENCES…………………………………………………………………………………………… 124Chapter IVEvaluation <strong>of</strong> seismic capacity: the monotonic test 1274.1 THE STUDY CASE: BASIC ASSUMPTIONS…………………………………………………… 1284.2 GENERAL DESIGN PRINCIPLES………………………………………………………………... 1314.3 TEST PROGRAM…………………………………………………………………………………… 1334.3.1 Description <strong>of</strong> test specimens………………………………………………………………………… 1344.3.2 Test set-up ……………………………………………………………………………………………. 1404.3.3 Instrumentation………………………………………………………………………………………. 1424.3.4 Test procedure for the monotonic test………………………………………………………………... 1434.4 TEST RESULTS…………………………………………………………………………………….. 144REFERENCES…………………………………………………………………………………………… 152
ContentsiiiChapter VEvaluation <strong>of</strong> seismic demand 1535.1 MODEL OF THE HYSTERETIC BEHAVIOR OF CFSSSW SYSTEMS………………………. 1545.1.1 The loading branch without pinching………………………………………………………………... 1555.1.2 The loading branch with pinching…………………………………………………………………… 1565.1.3 The unloading branch ………………………………………………………………………………... 1585.1.4 Calibration <strong>of</strong> the model……………………………………………………………………………… 1595.2 ASSESSMENT OF DEFORMATION DEMAND………………………………………………… 1665.2.1 Data-base <strong>of</strong> considered earthquake ground motions………………………………………………... 1665.2.2 Displacement demand evaluation……………………………………………………………………. 1715.3 DEFINITION OF A LOAD HISTORY FOR A CYCLIC TESTING……………………………. 1805.3.1 Loading histories in quasi-static cyclic loading tests: basic procedures for Multiple Step Test……... 1805.3.2 Definition <strong>of</strong> the deformation history for the cyclic testing………………………………………….. 185REFERENCES…………………………………………………………………………………………… 191Chapter VIThe cyclic test 1936.1 TEST PROCEDURE………………………………………………………………………………… 1946.2 TEST RESULTS…………………………………………………………………………………….. 197REFERENCES…………………………………………………………………………………………… 205Conclusions 207AppendicesAppendix A: Summary <strong>of</strong> existing experimental results….. 15 ppAppendix B: Summary <strong>of</strong> objectives and results <strong>of</strong> existingexperimental studies…………………………….. 6 ppAppendix C: Evaluation <strong>of</strong> seismic action and wall shear strength forthe study case…………………………………….. 14 ppAppendix D: Construction details <strong>of</strong> the sub-assembly specimen………………………………………………………. 10 ppAppendix E: Monotonic test results………………………….. 11 ppAppendix F: Cyclic test results……………………………….. 11 pp
vIndex <strong>of</strong> figuresFIGURE 1.1: STICK-BUILT CONSTRUCTION……………………………………………………... 6FIGURE 1.2: PANELIZED CONSTRUCTION……………………………………………………….. 7FIGURE 1.3: MODULAR CONSTRUCTION………………………………………………………… 8FIGURE 1.4: STRUCTURE OF TYPICAL STICK-BUILT CONSTRUCTION (NASFA 2000)…. 9FIGURE 1.5: WALL FRAMING OF TYPICAL STICK-BUILT CONSTRUCTION (NASFA 2000)…………………………………..………………………………………………………… 11FIGURE 1.6: TYPICAL WALL FRAMING DETAILS (NASFA 2000)……………………………. 11FIGURE 1.7: FLOOR FRAMING OF TYPICAL STICK-BUILT CONSTRUCTION (NASFA 2000)…………………………………………………………………………………………….. 12FIGURE 1.8: ROOF FRAMING OF TYPICAL STICK-BUILT CONSTRUCTION (NASFA 2000)…………………………………………………………………………………………….. 14FIGURE 1.9: BASIC FRAMING SYSTEMS IN STICK-BUILT CONSTRUCTIONS (CSSBI 1991)…………………………………………………………………………………………….. 15FIGURE 1.10: CHANNEL SECTION DIMENSIONS……………………………………………….. 16FIGURE 1.11: ON SITE COLD FORMING OF PROFILES………………………………………… 17FIGURE 1.12: UN-REINFORCED HOLES IN WEBS OF STUDS…………………………………. 18FIGURE 1.13: WOOD-BASED PANELS PRIMARILY USED IN THE CONSTRUCTION MARKET…………………………………………………………………………………………….. 20FIGURE 1.14: SCREW POINT TYPES……………………………………………………………….. 23FIGURE 1.15: SCREW HEAD TYPES………………………………………………………………... 24FIGURE 1.16: PNEUMATICALLY DRIVEN AND POWDER-ACTUATED PINS………………. 25FIGURE 1.17: SPIRAL SHANK NAILS………………………………………………………………. 26FIGURE 1.18: LOAD-TRANSFER MECHANISMS…………………………………………………. 27FIGURE 1.19: CAST-IN-PLACE ANCHORS………………………………………………………… 27FIGURE 1.20: POST-INSTALLED ANCHORS - MECHANICAL SYSTEMS…….……………… 29FIGURE 1.21: POST-INSTALLED ANCHORS - ADHESIVE SYSTEMS………………………… 30FIGURE 1.22: HOLD-DOWN (BRANSTON ET AL. 2003)………………………………………… 31FIGURE 1.23: FOUNDATION…………………………………………………………………………. 32FIGURE 1.24: INSTALL GROUND FLOOR…………………………………………………………. 32FIGURE 1.25: ERECT WALLS…………………………………………………………………………33FIGURE 1.26: INSTALL FIRST FLOOR……………………………………………………………... 33FIGURE 1.27: INSTALL ROOF……………………………………………………………………….. 33FIGURE 1.28: DISTRIBUTION OF HORIZONTAL (WIND) LOADS IN A HOUSE CONSTRUCTION…………………………………………………………………………………………….. 37
Index <strong>of</strong> figuresviFIGURE 1.29: WALL BRACED WITH STEEL SHEET X-BRACING…………………………….. 37FIGURE 1.30: BLOCKING…………………………………………………………………………….. 38FIGURE 1.31: TYPICAL INSULATION DETAILS…………………………………………………. 41FIGURE 2.1: MODEL OF A SIMPLE SHEAR WALL………………………………………………. 47FIGURE 2.2: COMPARISON BETWEEN SEGMENT METHOD AND PSW METHOD……….... 48FIGURE 2.3: FACTORS AFFECTING CFSSSWS SHEAR BEHAVIOR………………………….. 49FIGURE 2.4: FAILURE MODES OF SHEATHING-TO-FRAME CONNECTIONS UNDER SHEARLOADING………………………………………………………………………………… 51FIGURE 2.5: ASSUMED SHEATHING FASTENER FORCES (EASLEY ET AL. 1982)……….. 54FIGURE 2.6: BUCKLING MODES OF AN UNSHEATHED STUD……………………………….. 56FIGURE 2.7: “FLANGE BUCKLING” MODEL FOR DISTORTIONAL COLUMN BUCKLING(LANDOLFO ET AL. 2002)……………………………………………………………. 58FIGURE 2.8: BUCKLING MODES OF A SHEATHED STUD (AISI 1996)………………………. 63FIGURE 2.9: FAILURE MODES OF SCREWED CONNECTIONS UNDER SHEAR LOADING. 68FIGURE 2.10: FAILURE MODES OF BOLTED CONNECTIONS UNDER SHEAR LOADING.. 70FIGURE 2.11: FAILURE MODES OF ANCHORS UNDER TENSION LOADING (HILTI 2001) 72FIGURE 2.12: FAILURE MODES OF ANCHORS UNDER SHEAR LOADING (HILTI 2001)… 74FIGURE 2.13: MONOTONIC SHEAR LOAD-LATERAL DISPLACEMENT RESPONSE……… 78FIGURE 2.14: REVERSED-CYCLIC SHEAR LOAD-LATERAL DISPLACEMENT RESPONSE 78FIGURE 3.1: INFLUENCE OF THE SHEATHING ORIENTATION………………………………. 120FIGURE 3.2: INFLUENCE OF THE ASPECT RATIO………………………………………………. 122FIGURE 3.3: INFLUENCE OF THE OPENINGS……………………………………………………. 122FIGURE 3.4: INFLUENCE OF CYCLIC LOADING………………………………………………… 123FIGURE 3.5: CYCLIC RESPONSE FOR OSB 4-8 US C-A TEST PERFORMED BY BRANSTON ETAL. (2003)………………………………………………………………………………... 124FIGURE 4.1: TYPICAL ANALYZED STICK-BUILT HOUSE……………………………………... 128FIGURE 4.2: EUROCODE 8 TYPE 1 ELASTIC SPECTRUM ACCELERATION………………... 133FIGURE 4.3: GLOBAL 3D VIEW OF THE GENERIC SUB-ASSEMBLY………………………… 135FIGURE 4.4: A CLOSE-UP VIEW OF THE CONNECTION BETWEEN END STUDS ANDFOUNDATION…………………………………………………………………………… 135FIGURE 4.5: A CLOSE-UP VIEW OF THE CONNECTION BETWEEN THE FLOOR JOISTS ANDTHE WALL STUDS……………………………………………………………………... 135FIGURE 4.6: CFS PROFILES (MANIFACTURED BY GUERRASIO)……………………………. 137FIGURE 4.7: SHEATHINGS…………………………………………………………………………… 137FIGURE 4.8: SELF DRILLING SCREWS (MANIFACTURED BY TECFI S.R.L.)………………. 137FIGURE 4.9: HOLD-DOWN CONNECTOR………………………………………………………….. 138FIGURE 4.10: (A) SHEAR AND (B) HOLD-DOWN ANCHORS (MANUFACTURED BY HILTI
Index <strong>of</strong> figuresviiITALIA)…………………………………………………………………………………... 138FIGURE 4.11: LOAD TRANSFER SYSTEM…………………………………………………………. 141FIGURE 4.12: TEST SET-UP………………………………………………………………………….. 142FIGURE 4.13: INSTRUMENT ARRANGEMENT…………………………………………………… 143FIGURE 4.14: UNIT SHEAR RESISTANCE VS. MEAN DISPLACEMENT CURVE………….... 145FIGURE 4.15: SPECIMEN CONDITION AT STEP 1(D=10MM)………………………………….. 146FIGURE 4.16: SPECIMEN CONDITION AT STEP 2 (MAXIMUM SHEAR RESISTENCE -D=36MM)………………………………………………………………………………… 147FIGURE 4.17: SPECIMEN CONDITION AT STEP 3 (D=80MM)…………………………………. 148FIGURE 4.18: SPECIMEN CONDITION AT STEP 4 (D=130MM)………………………………... 149FIGURE 4.19: SHEAR VS. DISPLACEMENT CURVES FOR WALL 1 AND WALL 2…………. 151FIGURE 4.20: SHEAR VS. DISPLACEMENT MEASURED BY HORIZONTAL LVDTS .…….. 151FIGURE 4.21: SHEAR VS. DISPLACEMENT MEASURED BY VERTICAL LVDTS…………... 152FIGURE 5.1: BASIC DEFINITIONS (DELLA CORTE ET AL. 1999)…………………………….. 155FIGURE 5.2: THE LOADING BRANCH WITHOUT PINCHING………………………………….. 156FIGURE 5.3: THE LOADING BRANCH WITHOUT PINCHING (DELLA CORTE ET AL. 1999)………………………………………………..…………………………………………… 157FIGURE 5.4: THE LOADING BRANCH WITHOUT PINCHING (DELLA CORTE ET AL. 1999)…………………………………………………………………………………………….. 158FIGURE 5.5: THE UNLOADING BRANCH (DELLA CORTE ET AL. 1999)……………………..159FIGURE 5.6: CYCLIC TEST PROTOCOLS………………………………………………………….. 163FIGURE 5.7: CYCLIC RESPONSE……………………………………………………………………. 164FIGURE 5.8: NUMERICAL VS. EXPERIMENTAL CYCLIC RESPONSE FOR THE C01-4(A)SPECIMEN……………………………………………………………………………….. 164FIGURE 5.9: NUMERICAL VS. EXPERIMENTAL MONOTONIC RESPONSE…………………. 165FIGURE 5.10: GEOGRAPHICAL DISTRIBUTION OF THE SELECTED STRONG-MOTIONRECORDS………………………………………………………………………………… 169FIGURE 5.11A: ELASTIC SPECTRA OF EARTHQUAKE RECORDS FOR TYPE A SOIL……. 169FIGURE 5.11B: ELASTIC SPECTRA OF EARTHQUAKE RECORDS FOR TYPE B SOIL……. 170FIGURE 5.11C: ELASTIC SPECTRA OF EARTHQUAKE RECORDS FOR TYPE C SOIL……. 170FIGURE 5.11D: ELASTIC SPECTRA OF EARTHQUAKE RECORDS FOR TYPE D SOIL……. 170FIGURE 5.11E: ELASTIC SPECTRA OF EARTHQUAKE RECORDS FOR TYPE E SOIL…….. 171FIGURE 5.12: NUMERIC MODEL SCHEMATIZATION…………………………………………... 171FIGURE 5.13: IDA PROCEDURE EXAMPLE……………………………………………………….. 174FIGURE 5.14A: IDA CURVES FOR “LAZIO-ABRUZZO” EARTHQUAKE……………………... 175FIGURE 5.14B: IDA CURVES FOR “UMBRO-MARCHIGIANO” EARTHQUAKE…………….. 176FIGURE 5.15A: IDA CURVES FOR SOIL TYPE A…………………………………………………. 176FIGURE 5.15B: IDA CURVES FOR SOIL TYPE B…………………………………………………. 177FIGURE 5.15C: IDA CURVES FOR SOIL TYPE C…………………………………………………. 177FIGURE 5.15D: IDA CURVES FOR SOIL TYPE D…………………………………………………. 178FIGURE 5.15E: IDA CURVES FOR SOIL TYPE E………………………………………...……….. 178FIGURE 5.16: DETERIORATION OF A CFSSSW SYSTEM (BRANSTON ET AL. 2003)……... 180FIGURE 5.17: BASIC PARAMETERS IN A TYPICAL CYCLIC OF LOADING (ATC 1992)….. 181
Index <strong>of</strong> figuresviiiFIGURE 5.18: DEPENDENCE OF MEAN NUMBER OF INELASTIC EXCURSIONS ON NATURALPERIOD AND DUCTILITY RATIO (KRAWINKLER 1996)……………………….. 183FIGURE 5.19: DEPENDENCE OF MEAN NUMBER OF THE SUM OF NORMALIZED PLASTICDEFORMATION RANGES ON NATURAL PERIOD AND DUCTILITY RATIO(KRAWINKLER 1996)………………………………………………………………….. 183FIGURE 5.20: LOADING HISTORY FOR MULTIPLE STEP TEST (KRAWINKLER 1996)…… 184FIGURE 5.21: ASSUMED DEFINITIONS OF INDIVIDUAL PLASTIC DEFORMATION RANGE…………………………………………………………………………………………….. 186FIGURE 5.22A: RESULTS OF THE STATISTIC CHARACTERIZATION OF THE DEFORMATIONDEMAND IN TERMS OF MAXIMUM NORMALIZED DEFORMATION………… 188FIGURE 5.22B: RESULTS OF THE STATISTIC CHARACTERIZATION OF THE DEFORMATIONDEMAND IN TERMS OF NUMBER OF INELASTIC EXCURSION………………. 188FIGURE 5.22C: RESULTS OF THE STATISTIC CHARACTERIZATION OF THE DEFORMATIONDEMAND IN TERMS OF SUM OF NORMALIZED PLASTIC DEFORMATIONRANGES…………………………………………………………………………….……. 189FIGURE 5.22D: RESULTS OF THE STATISTIC CHARACTERIZATION OF THE DEFORMATIONDEMAND IN TERMS OF RATION BETWEEN THE MEAN VALUE AND THEMAXIMUM VALUE OF THE PLASTIC DEFORMATION RANGE……………….. 189FIGURE 6.1: CYCLIC TEST PROTOCOL……………………………………………………………. 196FIGURE 6.2: NUMERICAL CYCLIC RESPONSE…………………………………………………... 196FIGURE 6.3: UNIT SHEAR RESISTANCE VS. MEAN DISPLACEMENT CURVE…………..… 198FIGURE 6.4: BEHAVIOR OF OSB SHEATHING-TO-FRAME CONNECTIONS………………... 200FIGURE 6.5: BEHAVIOR OF GWB SHEATHING-TO-FRAME CONNECTIONS………………. 200FIGURE 6.6: FAILURE OF SHEATHING-TO-FRAME CONNECTIONS DUE TO SCREW HEADSPULL THROUGH………………………………………………………………………... 201FIGURE 6.7: FAILURE OF SHEATHING-TO-FRAME CONNECTIONS DUE TO RUPTURE OFSHEATHING EDGES…………………………………………………………………… 201FIGURE 6.8: UNZIPPING OF SHEATHINGS……………………………………………………….. 202FIGURE 6.9: BUCKLING OF END STUDS………………………………………………………….. 202FIGURE 6.10: DEFORMATION OF WALLS FOR LATERAL DISPLACEMENT MORE THAN 36MM…………………………………………………………………………………………….. 202FIGURE 6.11: CYCLIC VS. MONOTONIC BEHAVIOR…………………………………………… 204FIGURE 6.12: SHEAR VS. DISPLACEMENT CURVES FOR WALL 1 AND WALL 2……….... 205
ixIndex <strong>of</strong> tablesTABLE 2.1: FAILURE MODES IN A CFSSSW BRACED LATERALLY WITH WOOD BASEDPANELS………………………………………………………………………………….. 50TABLE 2.2: INDICATIVE SHEAR RESISTANCE OF SCREWS……………….…………………. 52TABLE 2.3: 1997 UBC NOMINAL SHEAR STRENGTH VALUES FOR SEISMIC ACTIONS... 79TABLE 2.4: 2000 IBC NOMINAL SHEAR STRENGTH VALUES FOR SEISMIC ACTIONS .... 80TABLE 2.5A: 1997 UBC NOMINAL SHEAR STRENGTH VALUES FOR WIND ACTIONS .... 80TABLE 2.5B: 1997 UBC NOMINAL SHEAR STRENGTH VALUES FOR WIND ACTIONS….. 81TABLE 2.6A: 2000 IBC NOMINAL SHEAR STRENGTH VALUES FOR WIND ACTIONS.….. 81TABLE 2.6B: 2000 IBC NOMINAL SHEAR STRENGTH VALUES FOR WIND ACTIONS…... 82TABLE 2.7: SAFETY AND RESISTANCE FACTORS PER 1997 UBC AND 2000 IBC………… 82TABLE 2.8: MAXIMUM UNRESTRAINED OPENING HEIGHT PER 2000 IRC……..………… 83TABLE 2.9: ADJUSTMENT FACTORS FOR APPLICATION OF THE PSW METHOD PER 2000IRC………………………………………………………………………………………... 84TABLE 3.1: LISTING OF TESTS OF CFSSSW……………………………………………………… 90TABLE 3.2: NORMALIZED SHEAR CAPACITY FOR DIFFERENT SHEATHING TYPE ANDTHICKNESS……………………………………………………………………………… 119TABLE 4.1: MAIN STRUCTURAL DIMENSION 129TABLE 4.2: UNIT DEAD LOADS 129TABLE 4.3: VALUES OF PARAMETERS DESCRIBING THE EUROCODE 8 TYPE 1 ELASTICRESPONSE SPECTRUM 130TABLE 4.4: MAXIMUM ELASTIC SPECTRUM ACCELERATION AND CORRESPONDINGLATERAL FORCE VALUES 133TABLE 4.5: FULL-SCALE SPECIMEN MATERIALS AND CONSTRUCTION DATA 139TABLE 5.1: WALL GEOMETRY AND MATERIAL DATA 160TABLE 5.2: CYCLIC TEST PROTOCOLS 162
Index <strong>of</strong> tablesxTABLE 5.3: RESULTS OF CALIBRATION OF LOWER BOUND CURVE AND TRANSITIONPARAMETERS OBTAINED ON THE BASIS OF EXISTING CYCLIC TESTS 165TABLE 5.4: RESULTS OF CALIBRATION OF UPPER AND LOWER BOUND CURVEPARAMETERS OBTAINED ON THE BASIS OF MONOTONIC TESTS CARRIED-OUTIN THE CURRENT RESEARCH 165TABLE 5.5: DATA-BASE OF SELECTED EARTHQUAKE RECORDS 168TABLE 5.6: IDA RESULTS 179TABLE 5.7: PREDICTED AND EXPERIMENTAL DEMANDS FOR A BILINEAR SDOF(KRAWINKLER 1996) 185TABLE 5.8: RESULTS OF THE STATISTIC CHARACTERIZATION OF THE DEFORMATIONDEMAND 190TABLE 6.1: CYCLIC TEST PROTOCOL 195TABLE 6.2: COMPARISON BETWEEN THE DEFORMATION DEMAND PARAMETERSOBTAINED FROM THE STATISTIC CHARACTERIZATION AND THE ADOPTEDLOADING HISTORY 197
1ForewordIn recent years, the use <strong>of</strong> cold-formed steel members in low-rise buildingshas increased significantly in North-America, North-Europe and Australia.The cold-formed steel products, traditionally used as secondary structures(pr<strong>of</strong>iles and decks) <strong>of</strong> industrial buildings, have had in such countries abrilliant and diffused application as main structures <strong>of</strong> residential (housing)and commercial constructions, mainly thanks to the expected economicadvantages deriving from the significant reduction <strong>of</strong> the construction time.The structural typologies, where cold-formed steel pr<strong>of</strong>iles are adopted asmain structural elements, according to the prefabrication level, can beclassified in: “stick – built” (lowest prefabrication degree); “panelized”(intermediate prefabrication degree); and “modular” (highest prefabricationdegree) constructions. They are generally made <strong>of</strong> steel pr<strong>of</strong>iles andsheathings assembled together by means <strong>of</strong> mechanical fasteners. The pr<strong>of</strong>ilesare generally cold-formed lightweight galvanized steel with C (lippedchannel), U (unlipped channel), Z, and L sections. The most widely usedstructural sheathings are wood-based and gypsum-based panels, but also steelsheet sheathing may be used. Due to the presence <strong>of</strong> different structuralmaterials various connection typologies, as screws, welding, pins, nails, bolts,anchors and adhesives, may be employed.For the design <strong>of</strong> these structural systems under both vertical andhorizontal loads two approaches can by used, which are different as respect tocommon structures. In the first approach, named “all-steel design”, thecontribution <strong>of</strong> the attached sheathings is neglected and the pr<strong>of</strong>iles areconsidered as free-standing members. In the second, named “sheathingbraced design”, the interaction between pr<strong>of</strong>iles and sheathings is taken in-to
2account in the evaluation <strong>of</strong> the load bearing capacity. As a consequence, inthe case <strong>of</strong> horizontal loads two basic lateral load resisting systems may beconsidered. Following the “all-steel design” approach, the in-plane stability inro<strong>of</strong>s, floors and walls should be provided by the use <strong>of</strong> diagonal steel flatstrap bracings. While, considering the “sheathing braced design” approach, ifsheathing elements have adequate strength and stiffness, and if there areadequate connections to the pr<strong>of</strong>iles, then ro<strong>of</strong>s, floors and walls can performas diaphragms.Although today the utilization <strong>of</strong> the cold-formed steel pr<strong>of</strong>iles in Italy isstill limited to secondary structure, the aptitude <strong>of</strong> such constructive systemsto be quickly and easily assembled makes this structural system an interestingalternative solution to the use <strong>of</strong> prefabricated modules (containers) for theefficient management <strong>of</strong> emergency situations. One important example, forthe national territory, is the management <strong>of</strong> post-earthquake emergencysituations.Such an employment <strong>of</strong> the cold-formed steel housing obviously requiresan accurate study <strong>of</strong> the seismic behavior <strong>of</strong> this structural system. The studymust be carried out according to modern and advanced knowledge <strong>of</strong>earthquake engineering, using the recently developed performance-baseddesign and analysis approach. In fact, over the last decade, great emphasis hasbeen placed on the need to overcome limitations <strong>of</strong> current codified, forcebasedand prescriptive, seismic design procedures and to implement aprobabilistic performance-based approach. The latter is based on the coupling<strong>of</strong> multiple performance levels and ground motion intensities, thus generatingperformance objectives to be satisfied. While the application <strong>of</strong> theperformance-based methodology has long been tested for classic reinforcedconcrete and steel structures, its application to light cold-formed steel housingremains largely unexplored.The design <strong>of</strong> classic building structures is based on force-reduction factorsthat, exploiting the structure own ductility, avoids collapse, safeguards humanlives and allows a relatively less expensive structural design. In case <strong>of</strong> lightgaugecold-formed steel framed structures, the seismic weight <strong>of</strong> the buildingand its content is significantly smaller, allowing the design to be carried outwith relatively very low values <strong>of</strong> the force reduction factors. This event isparticularly favorable, because <strong>of</strong> the relatively small ductility <strong>of</strong> the light-
Foreword 3gauge structure. Consequently, cold-formed structures are more damagetolerantthan classic structures under earthquakes having the design intensity(i.e. earthquakes having a 10% probability <strong>of</strong> being exceeded in 50 yearsaccording to modern design standards). However, the ability <strong>of</strong> this type <strong>of</strong>structure to survive more violent earthquakes (rare earthquakes, for example,those having a 2% probability <strong>of</strong> being exceeded in 50 years according tocurrent research trends) is currently unexplored and need to be clarified. Thisrequires the evaluation <strong>of</strong> seismic performance through the comparisonbetween the seismic demand and the seismic capacity. In fact, adequateperformance implies that the capacity exceed the imposed demand with anadequate margin <strong>of</strong> safety. For a structural component or sub-assembly, thismeans that its capacities as well as the demands imposed by earthquakes needto be quantified.The main objective <strong>of</strong> this dissertation is to give a contribution to theevaluation <strong>of</strong> seismic performance <strong>of</strong> low-rise residential buildings built withcold-formed steel members through the evaluation <strong>of</strong> the seismic demand, theseismic capacity and their comparison.The same reason motivates a joint research effort between the University“Federico II” <strong>of</strong> Naples and the University “Gabriele D’Annunzio” <strong>of</strong> Chieti-Pescara, Italy. Namely, the research project, entitled “A theoretical andexperimental study on the feasibility <strong>of</strong> using cold-formed steel members inseismic zones” is supported by the Italian Ministry <strong>of</strong> University and Research(MIUR) as a part <strong>of</strong> a more comprehensive research program, devoted tostudy innovative steel structures for the seismic protection <strong>of</strong> buildings.Although the study had general purpose, with regard to low-rise residentialbuildings built with cold-formed steel members, the attention has beenfocused on the stick-built construction system because it represents the basicsystem for the development <strong>of</strong> more industrialized constructions (panelizedand modular constructions). In particular, considering this construction systemespecially advantageous when the members-to-sheathing interaction is takesin-to account (sheathing braced design), the research has been concerned onthe seismic behavior <strong>of</strong> cold-formed steel stud shear walls (CFSSSWs)laterally braced with sheathings (sheathed).
4The dissertation, as well as the research program, has been articulated in sixmain phases.The first phase <strong>of</strong> the research has been particularly devoted to study theconstruction system, the building process and the basic aspects <strong>of</strong> structuraldesign under vertical and horizontal loads (Chapter I). The second part <strong>of</strong> thestudy has been dedicated to analyze the available main design methodologiesfor the evaluation <strong>of</strong> shear capacity for CFSSSW systems (Chapter II). Thereview <strong>of</strong> existing literature focused on the critical examination <strong>of</strong> previoustests on CFSSSWs, together with the definition <strong>of</strong> basic factors that influencetheir lateral load response, have been the objects <strong>of</strong> the third phase (ChapterIII).The forth phase <strong>of</strong> the research (Chapter IV) represented the fist step <strong>of</strong> theexperimental activity. In fact, it has been dedicated to evaluate the seismiccapacity for small building made by a stick-built construction system. Inparticular, the design and the monotonic testing <strong>of</strong> a full-scale CFSSSW subassemblyspecimen, it representing a realistic model <strong>of</strong> typical lateral loadresisting systems <strong>of</strong> stick-built house structures, has been included.The fifth phase (Chapter V) <strong>of</strong> the research activity has been a theoreticalone. It has been articulated in the following three main steps: (1) development<strong>of</strong> reliable mathematical models calibrated using the experimental results <strong>of</strong>the monotonic test, in order to capture the complex hysteretic response <strong>of</strong>CFSSSWs; (2) evaluation <strong>of</strong> the deformation demand to stud shear wallsystems obtained on the basis <strong>of</strong> a large database <strong>of</strong> acceleration records; and(3) definition <strong>of</strong> a load history for a successive cyclic testing.Finally, in the sixth phase (Chapter VI) the second step <strong>of</strong> the experimentalprogram was performed. In fact, in this stage a specimen nominally identicalto that tested under monotonic loading has been subjected to fully reversingcyclic horizontal displacements according to the definition <strong>of</strong> the deformationhistory parameters carried out in the theoretical phase.
Chapter ILow-rise residential buildings built withcold-formed lightweight steel members5The use <strong>of</strong> light steel framing as a method <strong>of</strong> low-rise house constructionhas increased significantly in industrialized countries in recent years. In someEuropean countries this is from a small base (Lawson & Ogden 2001). Inother countries, such as USA, Canada, Australia and Japan, there is a welldevelopedindustry with well-established practices. In fact, in the USA, 15000steel homes were built in 1993, 75000 were constructed in 1996 and it isexpected that in the year 2002 the steel house constructions will be about375000 (Yu 2000).The present generation <strong>of</strong> steel framed house construction systems has beenderived from traditional timber framed house construction systems withoutany significant change in either the architecture or the interior and exteriorfinishing materials.This Chapter describes the construction system (Sections 1.1 through 1.5);the erection procedure (Section 1.6); the fundamental problems <strong>of</strong> structuraldesign (Section 1.7); the additional considerations on fire resistance, durabilityand insulation (Section 1.8); the advantages and the limitations <strong>of</strong> the low-riseresidential buildings built with cold-formed lightweight steel members(Section 1.9).
Low-rise residential buildings built with cold-formed lightweight steel members 61.1 BASIC CONSTRUCTION SYSTEMSThere are three basic systems <strong>of</strong> constructions for low-rise house which arenamed (Landolfo et al. 2002): stick-built constructions; panelized constructions; modular constructions.Stick-built constructionsThe stick-built construction (see Fig. 1.1) is characterized by the lowestprefabrication degree and it is the most common method used for built coldformedsteel (CFS) frames, because it is the same as the familiar stick-builtwood construction method. In fact, in these systems the wood members havereplaced with appropriate CFS members. In general, the steel members maybe cut to length on job-site with a hand-held saw. Similar to woodconstruction, steel components are fastened together on the floor surface intowall sections and tilted into positions. Once the wall sections are structurallyconnected together, exterior and interior sheathing materials are applied. Theconstruction time is short, the steel structure <strong>of</strong> a typical detached houserequiring between 2 and 4 days.The advantages <strong>of</strong> stick constructions are (Grubb and Lawson 1997): the system can accommodate larger constructions tolerances; the workshop facilities associated with modular constructions are notnecessary; simple constructions techniques without heavy lifting equipment maybe used; members can be densely packed for transport.Figure 1.1: Stick-built construction.
Low-rise residential buildings built with cold-formed lightweight steel members 7Panelized constructionsIn panelized construction (see Fig. 1.2), wall and floor sub-frames and ro<strong>of</strong>trusses may be prefabricated in the factory. The panels are lifted into positionon the job-site and fastened together generally by bolting to form the requiredbuilding geometry. This method <strong>of</strong> construction is particularly efficient whenthere is repetition <strong>of</strong> panel types and dimensions. In contrast to stick-builtconstruction, in the panel construction exterior sheathings, thermal insulationand some <strong>of</strong> the lining and finishing materials may also be applied to the steelsub-frames in the factory.The main advantages <strong>of</strong> panel construction are (Grubb and Lawson 1997): speed <strong>of</strong> erection; factory standards <strong>of</strong> quality control during fabrication <strong>of</strong> the units; reduction <strong>of</strong> site labor costs, scope for automation in factory production.Figure 1.2: Panelized construction.Modular constructionsPrefabrication <strong>of</strong> wall, floor and ro<strong>of</strong> units is taken a stage further inmodular construction (see Fig. 1.3). Here, lightweight steel boxes, which mayfor example be hotel room units, are completely prefabricated in the factorybefore being delivered to the site. It is usual for all internal finishes, fixturesand fittings, and even the carpets, curtains and furniture, to be fitted in the
Low-rise residential buildings built with cold-formed lightweight steel members 8factory. On job-site, the units are stacked side-by-side and up to severalstoreys high on prepared foundations and service connections made to formthe complete structure. Nowadays, many hotels and motels are built in thisway.This chapter is particularly focused on the stick-built construction systemthat certainly represents the more used structural solution. Besides, thisstructural solution is also the basic system for the development <strong>of</strong> moreindustrialized constructions, like the panelized construction and the modularconstruction.Figure 1.3: Modular construction.1.2 STICK-BUILT CONSTRUCTIONSFigure 1.4 shows typical stick-built construction (NASFA 2000).The basic elements <strong>of</strong> a stick-built construction are: foundations; walls framing; floors framing; ro<strong>of</strong>s framing.
Low-rise residential buildings built with cold-formed lightweight steel members 9Figure 1.4: Structure <strong>of</strong> typical stick-built construction (NASFA 2000).FoundationsTwo kinds <strong>of</strong> foundations are typically used in a stick-built construction: poured concrete walls foundations; slab-on-grade foundations.For both foundation types, up-lift loads represent the critical problem. Infact, when the horizontal loads are large, the overturning moment is high, andthe tendency for the wall to overturn is elevated. Consequently, forcounterbalance the up-lift force the foundation must be capable <strong>of</strong> distributingthe load and the weight <strong>of</strong> the foundations itself must be exceeds that <strong>of</strong> up-liftforce.<strong>Walls</strong> framingWall framing generally have two and possibly three separate functions.Their primary function is to carry vertical load from the floors and ro<strong>of</strong> above(load bearing wall). In external walls, they also have to resist the lateralpressure from the wind and transmit this to the floor and ro<strong>of</strong> diaphragms andto the foundations. In addition, certain walls may also form part <strong>of</strong> the system
Low-rise residential buildings built with cold-formed lightweight steel members 10resisting in-plane forces from wind or seismic shear (bracing wall). A typicalwall framing system, component and terminology are shown in Figure 1.5 andsome constructional details are shown in Figure 1.6 (NASFA 2000).The main structural components <strong>of</strong> wall framing construction are:stud:vertical structural element <strong>of</strong> a wall assembly, which supportvertical loads and/or transfer lateral loads (typically lippedchannel sections).wall track: horizontal member used such as top and bottom plate for walls(typically unlipped channel sections).Wall studs are typically C-shaped galvanized CFS sections placed withtheir flanges in contact with the wall sheathing. The pr<strong>of</strong>iles are usually on amodule ranging approximately from 300mm to 600mm. The wall sheathingmay be, for example, a gypsum or wood fiber based board, plywood or, insome cases steel sheet or corrugated sheathings. If this wall sheathing hasadequate strength and stiffness and if there is adequate attachment to the studs,then the axial load bearing capacity may be substantially increased by theresulting structural interaction. This is mainly as a consequence <strong>of</strong> theresistance provided against lateral buckling modes.Evidently, wall studs can be designed as free-standing members withouttaking advantage <strong>of</strong> the influence <strong>of</strong> the other elements <strong>of</strong> the wallconstruction and modern codes <strong>of</strong> practice allow this on the basis <strong>of</strong>calculations alone. Inclusion <strong>of</strong> the stiffening influence <strong>of</strong> the walls has to besemi-empirical based on the interpretation <strong>of</strong> test results.
Low-rise residential buildings built with cold-formed lightweight steel members 11Figure 1.5: Wall framing <strong>of</strong> typical stick-built construction (NASFA 2000).Figure 1.6: Typical wall framing details (NASFA 2000).
Low-rise residential buildings built with cold-formed lightweight steel members 12Floors framingFloor framing construction is typically lightweight and dry. However, thereare circumstances where heavier constructions are specified, usually to meetrequirements for fire and/or sound isolations.Generally, the floor construction is constituted by cold-formed lightweightsteel pr<strong>of</strong>iles with a wood-based sheathing. The pr<strong>of</strong>iles are usually on amodule that coincides with studs on the supporting elevations. A typical steelfloor system, component and terminology are shown in Figure 1.7 (NASFA2000).Figure 1.7: Floor framing <strong>of</strong> typical stick-built construction (NASFA 2000).The main structural components <strong>of</strong> floor framing construction are:floor joists: horizontal member that supports floor loads (typicallylipped channel sections).floor track: horizontal member used as band or rim joists forflooring systems (typically unlipped channel sections).web stiffener: additional material that is attached to the web tostrengthen the member against web crippling. Alsocalled bearing stiffener.
Low-rise residential buildings built with cold-formed lightweight steel members 13Joist designs are rarely based on the bending resistance <strong>of</strong> the crosssections,in fact, normally the serviceability criteria <strong>of</strong> deflection and vibrationcontrol the design. <strong>Steel</strong> floors can sometimes resonate with the vibrationsinduced by human footsteps and, although this does not usually producestructural damages, it can be a source <strong>of</strong> discomforts. This problem tends tobecome more acute when lightweight construction is used.In some cases, the floor can be realized by trapezoidally pr<strong>of</strong>iled steel decksupported on primary beams and carrying a wood-based walking surface or,more infrequently, it can be realized by composite (steel-concrete) decksupported on primary beams.Ro<strong>of</strong>s framingFor the ro<strong>of</strong> framing construction, steel truss with similar proportions to aconventional gang-nailed timber truss is <strong>of</strong>ten about six times as strong as thetimber equivalent and is uneconomic at modest spans and load levels. For thisreason, when a habitable ro<strong>of</strong> space is not required steel framed houses are<strong>of</strong>ten completed with timber ro<strong>of</strong> trusses. <strong>Steel</strong> trusses can, however, be usedeconomically when they are spaced at wider centers with purlins spanningbetween the trusses. All-steel solutions become much more favorable when ausable ro<strong>of</strong> space is required. In Figure 1.8 (NASFA 2000) a typical solutionis shows, in which attic frames are connected in a conventional manner. Analternative system could use sandwich panels either spanning from caves toridge or supported on intermediate purlins.The main structural components <strong>of</strong> wall framing construction are:rafter:structural framing member (usually sloped) thatsupports ro<strong>of</strong> loads (typically lipped channel sections).ceiling joist: horizontal structural cold-formed lightweight steelpr<strong>of</strong>iles that supports a ceiling and attic loads (typicallylipped channel sections).ridge member: horizontal member placed at intersection between thetop edges <strong>of</strong> two sloping ro<strong>of</strong> surfaces.fascia:member applied to the rafter ends as an edge memberfor attachment <strong>of</strong> ro<strong>of</strong> sheathing, exterior finishes, orgutter.
Low-rise residential buildings built with cold-formed lightweight steel members 14Figure 1.8: Ro<strong>of</strong> framing <strong>of</strong> typical stick-built construction (NASFA 2000).The others main structural components <strong>of</strong> floor, wall and ro<strong>of</strong> framingconstructions are (NASFA 2000):header: horizontal built-up structural framing member used over wall,ro<strong>of</strong> or floor openings to transfer loads above opening toadjacent framing member.blocking: solid block or piece <strong>of</strong> material placed between structuralmembers to provide lateral bracing as in bridging and/or edgesupport for sheathings.bridging: bracing or blocking placed between joist to provide lateralsupport.flat strap: sheet steel cut to a specified width without any bends. Typicallyused for bracing and transfer <strong>of</strong> loads by tension.There are two basic framing systems in stick-built constructions that areusually defined as (CSSBI 1991): platform system; balloon system.
Low-rise residential buildings built with cold-formed lightweight steel members 15In platform construction, as shown in Figure 1.9a, the structure is builtstorey by storey so that each floor can serve as a working platform for theconstruction <strong>of</strong> the floor above. The walls are not structurally continuous andloads from the walls above are generally transferred through the floorstructure to the walls below. The wall studs are connected to horizontal trackstop and bottom and the floor joists are seated on the top track <strong>of</strong> the studsbelow. Sufficient stiffening is incorporated in the connection to ensure thesafe transfer <strong>of</strong> vertical load though the floor construction.In balloon construction, as shown in Figure 1.9b, the wall panels arecontinuous over two or more storeys and the floors are attached to them. Itfollows that loads from the floors above pass down the load-bearing studswithout affecting the incoming floor construction.a: Platform framing system b: Balloon framing systemFigure 1.9: basic framing systems in stick-built constructions (CSSBI 1991).1.3 PROFILES<strong>Steel</strong> members used in residential buildings in the construction <strong>of</strong> floors,walls and ro<strong>of</strong> are predominantly cold-formed lightweight galvanized steelmembers. The pr<strong>of</strong>iles are cold-formed from structural quality steel sheet witha yield strength ranging from 230MPa to 350MPa, an ultimate tensile strengthranging from 310MPa to 480MPa. Moreover, the ultimate tensile strength-toyieldstrength ratio shall be at least 1.10 and the total elongation shall be atleast 10%.
Low-rise residential buildings built with cold-formed lightweight steel members 16As illustrated previously, the main pr<strong>of</strong>iles are commonly divided intolipped and unlipped channel sections. The lipped channel sections are usuallyused for joist, stud and rafter pr<strong>of</strong>iles, while the unlipped channel sections arenormally utilized for track pr<strong>of</strong>iles. These pr<strong>of</strong>iles are identified using: web depth; flange width; thickness.In this dissertation a lipped channel section (see Fig. 1.10a) is identified as“C web depth x flange width x lip size x thickness” (all dimensions in mm),while a unlipped channel section (see Fig. 1.10b) is identified as “U web depthx flange width x thickness” (all dimensions in mm).a: Lipped channel section dimensions. b: Unlipped channel section dimensions.Figure 1.10: Channel section dimensions.In North America, stud type members typically range from about 90 to200mm in web depth, with an about 40mm flange width, and with thicknessesranging from 0.8 to 2.5mm. Joist type members have a flange width rangingfrom around 40 to 45mm and range in web depth approximately from 140 to310mm with thicknesses ranging from 0.8 to 2.5mm.In Europe, dimensions <strong>of</strong> studs and joists are similar to that used in NorthAmerica except for the thickness, which in European pr<strong>of</strong>iles ranges from 1.2to 3.2mm.
Low-rise residential buildings built with cold-formed lightweight steel members 17The pr<strong>of</strong>iles may by cold-formed and cut in the factory or on site.Generally, it is more convenient to order precut cold-formed members becausein this way it is possible to save time and material. But, if the exactdimensions <strong>of</strong> structure are unknown, it is usually preferable cut, and in somecase, cold form the pr<strong>of</strong>iles on site, as shown in Figure 1.11.Figure 1.11: On site cold forming <strong>of</strong> pr<strong>of</strong>iles.The pr<strong>of</strong>iles normally have holes in their webs for water lines, gas pipe,and electrical wiring, as shown in Figure 12. As far as concern the holedimension, it is possible to consider the following classification.Un-forced holes (small hole): if the depth <strong>of</strong> the hole, measured across theweb, does not exceed about 40mm, and the length <strong>of</strong> the hole, measured alongthe web, do not exceed about 100mm. In these cases, it is not necessary totake any precaution.Reinforced holes (intermediate holes): if web holes violates any <strong>of</strong> therequirements reported at the above point. In these cases, the web shall bestrengthened with an appropriate solid steel plate, stud section, or tracksection.Big holes: if the depth <strong>of</strong> the hole, measured across the web, exceeds about75% <strong>of</strong> the depth <strong>of</strong> the web, and/or, the length <strong>of</strong> the hole, measured along
Low-rise residential buildings built with cold-formed lightweight steel members 18the web, exceeds about 150mm. In these cases, the pr<strong>of</strong>iles shall be designedin accordance with accepted engineering practices taking in to account <strong>of</strong>presence <strong>of</strong> the hole.Figure 1.12: Un-reinforced holes in webs <strong>of</strong> studs.1.4 SHEATHINGSThe most widely used types <strong>of</strong> sheathing are: wood-based panels; gypsum-based boards, steel sheathings.Neglecting the well-known steel sheet sheathing, some discussion about onthe main types <strong>of</strong> wood-based and gypsum-based products used in steelframed house constructions are given hereafter.1.4.1 Wood-based panelsAll wood-based panels are composite materials made <strong>of</strong> wood elementssuch as veneer, particles, flakes, or fibers and some adhesive. The main types<strong>of</strong> structural wood-based panels are (Faherty and Williamson 1999): veneer panels; particleboard panels.
Low-rise residential buildings built with cold-formed lightweight steel members 20Wood-based products are manufactured in sheets or panels with about 1.2 x2.4m as a generally standard size and with thickness varying from 8 to 30mm.Other sizes may be available for specific scopes, although widths other than1.2m are rare.The main product standards for wood-based panels, which describeminimum properties that the product must have to be acceptable, are: thePS1-95 (1983) and the ANSI A208.1-93 (1993) used in the USA, and theEN 313-1 (1997) and EN 313-2 (2000) for the plywood and the EN 309(1993) for the particleboard used in Europe.a. Plywood panel b. Oriented strand board panel c. FibreBoard panelFigure 1.13: Wood-based panels primarily used in the construction market.1.4.2 Gypsum-based boardsThe gypsum-based boards are a family <strong>of</strong> panel products consisting <strong>of</strong> anon-combustible core, primarily <strong>of</strong> gypsum, with a paper surfacing on theface, back and long edges. The main types <strong>of</strong> gypsum-based sheet productsused in building constructions are standard gypsum wallboard, water-resistantgypsum board, fire-resistant gypsum board, and foil-backed gypsum board.The water-resistant gypsum board is a wallboard specially processed foruse as a base for ceramic and other non-absorbent wall tiles in bath andshower areas. These products consist <strong>of</strong> a solid set, water-resistant gypsumcore covered with durable water-resistant backing paper and green-coloredface paper.The fire-resistant gypsum board is a wallboard that provides greater fireresistance. In fact, in this board type a specially formulated core provides fire
Low-rise residential buildings built with cold-formed lightweight steel members 21resistance ratings when used in tested assemblies. Facing paper is generallycolored pink.The foil-backed gypsum board is a wallboard panel consisting <strong>of</strong> a gypsumcore enclosed in heavy natural-side and strong liner paper on the backside towhich aluminum foil is laminated.Gypsum boards are manufactured with 1.2m generally standard widths,with lengths varying from 2 to 3.5m, and with thicknesses ranging from 6 to23mm.The main product standards for gypsum-based boards, which fix minimumproperties for these products, are the ISO 6308 (1980) and the ASTMC1396/C1396M-02 (2002).1.5 CONNECTIONSIn a residential CFS structure, taking into account the various structuralmaterials, it is possible to consider the following connections typology (AISI1993): steel-to-steel connections; steel-to-sheathing (wood-based and gypsum-based sheathings)connections; steel-to-concrete connections.For these connections typology the most common connector systems are: screws (steel-to-steel and steel-to-sheathing connections); welding (steel-to-steel connections); pins (steel-to-steel, steel-to-sheathing and steel-to-concreteconnections), nails (steel-to-sheathing connections), bolts (steel-to-steel connections); anchors (steel-to-concrete connections); adhesives (steel-to-sheathing connections).Moreover, a connection system named hold-down, typically used in thestick-built wood constructions for transferring the uplift loads, is alsoemployed in the stick-built CFS constructions for the same scope.
Low-rise residential buildings built with cold-formed lightweight steel members 22Others relatively new techniques, known a press-joining or clinching(Pedreschi and Sinha 1996) and rosette-joining (Machelainen et al. 1998) canadvantageously be used for steel-to-steel connections, particularly when theCFS systems are prefabricated in the factory (in the cases <strong>of</strong> panelized andmodular constructions).1.5.1 ScrewsThe most common fastener for steel framing is the self-tapping screw. Inone operation, it can drill the hole and fasten the material to steel framing.These screws come in a variety <strong>of</strong> styles to fit a vast range <strong>of</strong> requirements.For exterior applications, screws are available finished with zinc, cadmium orco-polymer coatings.Screws are available in diameters ranging from 3.5mm to 6.5mm. Lengthstypically vary from 12mm to as much as 75mm depending on the application.Screws are generally 10mm to 12mm longer than the thickness <strong>of</strong> theconnected materials so that a minimum <strong>of</strong> three threads shall extend beyondthe connected material. It is important that the drill point be as long as thematerial thickness to achieve an efficient drilling.Two specific point types are commonly used, as shown in Figure 1.14. Self-Drilling Screws: Externally threaded fasteners with the ability todrill their own hole and form their own internal threads withoutdeforming their own thread and without breaking during assembly.These screws are used with 0.8mm steel or thicker. Self-Piercing Screws: Externally threaded fasteners with the ability topierce relatively thin steel material. They are commonly used to attachrigid materials, such as gypsum wallboard, to 0.8mm or thinner steel.Self-drilling screws are manufactured in a variety <strong>of</strong> head configurations tomeet specific installation needs. The main head types, as shown in Figure1.15, are: pan head: This common head configuration generally fastens studs totrack, connects steel strapping or furring channels to studs or joists,and steel door frames to studs; modified truss head: An extremely low pr<strong>of</strong>ile head commonly usedfor attaching metal lath to steel framing (also referred to as lath head);
Low-rise residential buildings built with cold-formed lightweight steel members 23hex washer head: This is also a common style for penetrating steel andis more commonly used on thicker steel materials. The washer faceprovides a bearing surface for the driver socket, assuring greaterstability during driving;oval head: Used when an accessory that will be attached to the framinghas oversized holes or requires a low pr<strong>of</strong>ile appearance;flat head: Designed to countersink without causing splintering orsplitting <strong>of</strong> wood flooring and finishes;trim head: Used for fastening wood trim or other thick dense finishmaterials to steel studs. The small head pierces into the trim material,allowing easy finishing with minimal disturbance <strong>of</strong> the materialsurface;bugle head: Designed to countersink slightly in gypsum wallboard orsheathing, plywood or finish material without crushing the material ortearing the surface. Leaves a flat, smooth surface for easy finishing;low-pr<strong>of</strong>ile head: Maintains a pleasing appearance at fastening pointswhere the application does not require jut heads. This style should beused when rigid sheathings or finish material is to be installed over top<strong>of</strong> the screw head;wafer head: Larger than the flat or bugle head, the wafer head is usedfor connecting s<strong>of</strong>t materials to studs. The large head provides anample bearing surface to achieve a flat, clean, finished appearance.Figure 1.14: Screw point types.
Low-rise residential buildings built with cold-formed lightweight steel members 24Figure 1.15: Screw head types.1.5.2 WeldingWelding can be used to prefabricate steel framing components into panelassemblies and trusses. Welding is also commonly used in the attachment <strong>of</strong>site-fabricated or erected panels and for connecting shelf angles to steelframing.For helping assure quality installation, all work should be completed bywelders qualified in the welding <strong>of</strong> sheet steel. Where the studs, joists andframing accessories have been fabricated from galvanized or painted steel, thecoating will normally be burned away by the welding processes. Whererequired, weld areas should be re-touched with the appropriate paint or coldgalvanizing to maintain corrosion resistance.1.5.3 PinsTwo specific types are commonly used, as shown in Figure 1.16: pneumatically driven pins; powder-actuated pins.
Low-rise residential buildings built with cold-formed lightweight steel members 25Pneumatically driven pins are quite new to the CFS framing industry.They use techniques similar to nail guns for wood, and are commonly used fornailing plywood to steel. They are also available for fastening thicker coldformedsteel to concrete.These fasteners are available with mechanical or electro-zinc plating, or copolymercoatings, depending on corrosion resistance requirements. Headdiameters range from 6mm to 10mm, shank diameters vary from 2.5mm to8mm, and lengths from 12.5 to 200mm.The shanks may be step-down, knurled, or smooth, as shown in Figure1.16a. Step-down shanks are generally used on thicker materials for greaterload carrying capacities. Pins are typically supplied in bulk, in collated strips,or in coils, depending on tool requirements.Powder-actuated pins are frequently used to fasten CFS framing membersto concrete or to hot-rolled steel. For example, they are widely used to attachsteel track to concrete slabs and foundations. Powder-actuated pins systemscan be threaded, headed with a wisher or standard headed, as shown in Figure1.16b.The holding strength <strong>of</strong> fastener in concrete depends on the compressivestrength <strong>of</strong> the concrete, sank diameter, depth <strong>of</strong> penetration, and spacing andedge conditions. Headed or threaded drive pins are available with knurledshanks to increase holding power in structural steel. Fasteners loaded intension may require washers to prevent the fastener from prematurely pullingthrough the sheet steel.headed with astep-down knurled smooth threadedwishera: Pneumatically driven pins. b: Powder-actuated pins.standardheadedFigure 1.16: Pneumatically driven and powder-actuated pins.
Low-rise residential buildings built with cold-formed lightweight steel members 261.5.4 NailsCFS framing members may be also fastened to sheathing with nails.Generally, nails are spiral shank nails (see Fig. 1.17). They are case hardenedand phosphate treated to etch their surface for increased holding power. Theycan be used to fasten plywood subfloors and underlayment to steel.Figure 1.17: Spiral shank nails.1.5.5 BoltsBolts commonly used for connecting hot-rolled steel members can be alsoused to fasten CFS framing to other steel component. Generally, pre-drilling<strong>of</strong> holes is necessary for this fastening system. Washers should be providedfor oversized or slotted holes. When the bolt is loaded in tension, washers maybe required to prevent premature pull-through <strong>of</strong> the anchor.1.5.6 AnchorsAnchor commonly used for connecting concrete to steel can be separated intwo major categories (Hilti 2001): cast-in-place anchors, those are placed before the concrete is cast; post-installed or drilled-in anchors, those are installed into hardenedconcrete.Each <strong>of</strong> these categories is composed <strong>of</strong> a variety <strong>of</strong> different anchors, all<strong>of</strong> which transfer loads from the attachment to the concrete in a variety <strong>of</strong>ways. The primary load-transfer mechanisms (see Fig. 1.18) under tensionloading are friction, keying, and bonding as well as combinations. For shearloading, it is keying or direct bearing.
Low-rise residential buildings built with cold-formed lightweight steel members 27Figure 1.18: Load-transfer mechanisms.Generally, design engineers specify cast-in-place anchors (see Fig. 1.19) ifthey know beforehand where anchors are to be installed. The main cast-inplaceanchors are the standard fasteners (headed bolts, J bolts and L bolts,stud-welded plates), proprietary shapes (threaded inserts, proprietary anchorsand proprietary shapes), through bolts (usually sleeved), and special shapes(shear lugs, channel bars). All these anchors use keying as load transfermechanism. Many <strong>of</strong> these types <strong>of</strong> anchors have special uses. <strong>Stud</strong>-weldedplates and shear lugs provide large shear resistance, while channel bars givespecific attachment capability. J and L bolts are typically used for anchoringsill plates to foundations, but have a tendency to straighten and pull-out underhigher tension loading.Figure 1.19: Cast-in-place anchors.With the development and improvements <strong>of</strong> rotary hammer drills andcarbide-tipped bits, the user has the capability to install many different kinds<strong>of</strong> post-installed anchors (see Fig. 1.20) in hardened concrete virtually
Low-rise residential buildings built with cold-formed lightweight steel members 28anywhere that is accessible to the drill. Post-installed anchors can be dividedinto two major types, depending on the method <strong>of</strong> transferring load into theconcrete. They are mechanical systems and bonded or adhesive systems.Anchors can be also be cross-classified according to their load carryingcapability into heavy-duty, medium duty, and light-duty.The mechanical anchoring systems cover the range from heavy-duty tolight-duty capacities. The main kinds <strong>of</strong> mechanical anchors are undercutanchors and expansion anchors. The undercut anchors have been on themarket for about 20 years, they are excellent for use under both static anddynamic loads. They obtain their holding capacity through keying, that is,direct bearing on the concrete, and, under proper installation, can withstandvery high load without slipping out <strong>of</strong> the drilled hole. They are the preferredanchors for use where cracks in tension zones <strong>of</strong> the concrete can be expectedto occur. The expansion anchors have been available for at least 30 years.There are two basic types that are distinguished by their operating principles.The first, torque-controlled expansion anchors, are installed by inserting theanchor into the drilled hole, and applying the prescribed setting torque to thehead or nut. A cone at the bottom <strong>of</strong> the anchor is pulled up into the concretewith local crushing, and providing both friction and localized keying as loadtransfermechanism. There are several types available that vary significantly intheir ability to resist static and dynamic loads. The heavy-duty sleeve anchorcan resist dynamic loads as well as function well in expected cracks inconcrete. The second major type <strong>of</strong> expansion anchor is the displacementcontrolledexpansion anchor. Two primary examples are the drop-in and theself-driller. Drop-in anchors are installed in the predrilled hole by use <strong>of</strong> asetting tool that drives a plug into the expansion portion <strong>of</strong> the anchor. Thelower section <strong>of</strong> the anchor is expanded into concrete, which experiences localcrushing. The second type has cutting teeth on the lower end and drills its ownhole. The anchor is driven onto an expansion plug that expands the lowerportion <strong>of</strong> the anchor into the concrete. These anchors derive their holdingcapacity from friction and keying.
Low-rise residential buildings built with cold-formed lightweight steel members 29Figure 1.20: Post-installed anchors - mechanical systems.Bonded resin or adhesive anchors (see Fig. 1.21) were generally introducedinto the construction market about 20 years ago. Bonded systems use acombination <strong>of</strong> adhesive bond and micro keying into the pores <strong>of</strong> the concrete.Early systems used polyester resin, epoxies, and later, vinyl ester resins. Inrecent years, a larger variety <strong>of</strong> resins have been developed that haveindividual advantages, such as use in high temperatures, low temperatures,damp and wet holes, etc. For two component epoxy systems, the ratio to resinis critical. Prepackaged cartridge systems assure that the proper mixing isobtained.While a variety <strong>of</strong> installation methods are used, most are two componentresin systems that anchor threaded rod into predrilled holes. Most will resistsdynamic loads, both seismic and fatigue, but documentation in the form <strong>of</strong> testreports should be obtained. Bonded or adhesive anchoring systems are notwell suited for cracked tensile zones <strong>of</strong> concrete since about ½ the bonding islost.
Low-rise residential buildings built with cold-formed lightweight steel members 30Figure 1.21: Post-installed anchors - adhesive systems.1.5.7 AdhesivesAdhesives are generally optional when screws are used in attachingsubfloors or underlayment to steel joists, and are necessary when nails areemployed. The use <strong>of</strong> adhesives can provide for long-term bonding capacitythat contributes to a stable assembly. Adhesives are also utilized in attachingdrywall materials and paneling to steel studs or when laminating panelstogether, serving to eliminate some, but not all, <strong>of</strong> the mechanical fasteners.1.5.8 Hold-downUplift forces exist on shear walls because the horizontal forces are appliedto the top <strong>of</strong> the wall. These uplift forces try to lift up one end <strong>of</strong> the wall andpush the other end down. In some cases, the uplift force is large enough to tipthe wall over. Uplift forces are greater on tall short walls and less on low longwalls. Bearing walls have less uplift than non-bearing walls because gravityloads on shear walls help them resist uplift. <strong>Shear</strong> walls need hold-downdevices at each end when the gravity loads cannot resist all <strong>of</strong> the uplift. Thehold-down device then provides the necessary uplift resistance. In fact, holddownstransfer uplift forces from the end <strong>of</strong> the wall through a floor to a wallor foundation below.
Low-rise residential buildings built with cold-formed lightweight steel members 31Hold-downs that connect a shear wall to the foundation are bolted orscrewed to the end stud and they are anchored to the footings using cast-inplaceor post-installed anchors that are connected to the hold-down. Thisanchors transfer the uplift force from the wall down into the foundation. Thisminimizes the tendency <strong>of</strong> the wall to overturn (Fig. 1.22).Hold-downs that connect two walls through a floor come in pairs, oneabove and one below. The hold-downs are bolted or screwed their respectiveend stud. The uplift forces are then transferred from the wall above to the wallbelow through a threaded rod that is bolted to the hold-downs.Similar to bolted hold-downs, metal straps can be used as hold-downs. Thestrap must be long enough to pass through the floor framing and be attached tothe end studs so that the required number <strong>of</strong> screws or bolts is providedbetween the strap and the end stud. The strap should also be stiff and straightto reduce slippage.Figure 1.22: Hold-down (Branston et al. 2003).1.6 THE BUILDING PROCESSThe main phases <strong>of</strong> the building process for a stick-built structure as thatshown in Figure 1.4 are: foundation; install ground floor; erect ground walls; install first floor; erect first floor walls; install ro<strong>of</strong>.
Low-rise residential buildings built with cold-formed lightweight steel members 32Some <strong>of</strong> these building phases are shown in Figures 1.23 through 1.27.These are considered to be self-explanatory.Slab-on-grade foundation.Poured concrete walls.Figure 1.23: Foundation.Floor joists are fastened to the top track <strong>of</strong> a steelframedwall with screws driven through the joistflanges. Additional web stiffeners fastened withself-drilling screws are added to each joist-to-trackconnections as required.Joist track is installed over the ends <strong>of</strong> the floorjoists. The track is fastened to each joist with selfdrillingscrews and is anchored to foundation withanchor bolt or other connection as required.Figure 1.24: Install ground floor.
Low-rise residential buildings built with cold-formed lightweight steel members 33<strong>Stud</strong> tracks are installed over the ends <strong>of</strong> thestuds. Each top and bottom tracks are fastenedto each studs with self-drilling screws.Sheathings are screwed to both studs and stud trackfor a secure connection between sheathing and coldformedframe.Figure 1.25: Erect walls.Floor joists are fastened to the track with thesame procedure reported in Figure 1.24.Floor decking is fastened to the floor joists and tracksgenerally using self-drilling screws.Figure 1.26: Install first floor.In ro<strong>of</strong> framing structures pre-assembled steel truss can be used. Alternately, the pr<strong>of</strong>iles can be screwedwith the same procedure used for floor joists.Figure 1.27: Install ro<strong>of</strong>.
Low-rise residential buildings built with cold-formed lightweight steel members 341.7 BASIC PROBLEMS OF STRUCTURAL DESIGNAs well as in a common structure, the basic requirements in a stick-builtstructure are two: the transmission <strong>of</strong> vertical loads to the foundation; the transmission <strong>of</strong> horizontal loads to the foundation.1.7.1 Vertical loadsThe design <strong>of</strong> a stick-built structure under vertical loads is relatively lesscomplicated. In fact, rafters and joists carry essentially bending loads, whereasstuds carry basically compression axial load.Rafters, joists and studs can be designed by using one <strong>of</strong> two differentapproaches, as follows: all-steel design; sheathing braced design.In the all-steel design, the contribution <strong>of</strong> the attached sheathings isneglected and the pr<strong>of</strong>ile is considered as free-standing members withouttacking in to account <strong>of</strong> the influence <strong>of</strong> the interactions with the sheathingelements. In this way, the calculated resistance <strong>of</strong> the pr<strong>of</strong>ile is based solely onthe condition <strong>of</strong> lateral bracing <strong>of</strong> the member. The advantage <strong>of</strong> this approachis that the load bearing capacity, being compression or bending, is determinedwithout having to rely on the structural bracing capability <strong>of</strong> the sheathingmaterial.In the sheathing braced design, the presence <strong>of</strong> attached sheathings istaken in-to account in the valuation <strong>of</strong> the compressive resistance calculation.In fact, if these elements have adequate strength and stiffness, and if there areadequate connections to the members, then the load bearing capacity may besignificantly improved. This is principally a result <strong>of</strong> the resistance providedagainst global buckling modes. In modern code (ENV 1993-1-3 1996, AISI1996, AS/NZS 4600 1996), it is allowed to take in-to account the members-tosheathingsinteraction with semi-empirical calculations based on theinterpretation <strong>of</strong> test results.
Low-rise residential buildings built with cold-formed lightweight steel members 351.7.2 Horizontal loadsThe design <strong>of</strong> a stick-built structure under horizontal loads (wind orseismic loads) is more problematic. The components <strong>of</strong> this problem are two(Davies 1998), as shown in Figure 1.28 for wind load. (1) The floor and ro<strong>of</strong>frames must be able to act as diaphragms in plan to transmit horizontal loadson the wall frames parallel to the direction <strong>of</strong> the loads. (2) The wall framesmust be able to transmit the in-plane forces from the floor and ro<strong>of</strong> framesdown to the foundations. It is found that significant uplift forces may arise atthe leeward end <strong>of</strong> the wind-frames. Providing an adequate tie to adequatefoundations is another aspect <strong>of</strong> this problem.There are two main methods existing for providing in-plane stability infloor, ro<strong>of</strong> and wall: the use <strong>of</strong> diagonal bracings (X- and K-bracings); the use <strong>of</strong> floor, ro<strong>of</strong>, or wall structure as diaphragms.When X-bracings are used (see Fig. 1.29), flat straps <strong>of</strong> thin steel passunder the bottom flange <strong>of</strong> the joists or rafters in the floor or ro<strong>of</strong> and over theexternal faces <strong>of</strong> the studs in the walls. Due to their high slenderness, thesestraps act only in tension. They are connected to the primary structure at theirends in order to transfer the calculated tensile force and at their intersection inorder to reduce their tendency to sag.An alternative system is K-bracing which takes the form <strong>of</strong> C-sectionsfixed within the depth <strong>of</strong> the primary structure. These members act in eithertension or compression and, together with the adjacent members form a truss.As a result, adjacent members with a larger section than the norm andappropriate connections are required.Evidently, diagonal bracing should be used wherever possible and currentpractice is to use this method for the floor and ro<strong>of</strong> and for walls where thereare few door and window openings. However, the currently popular housingstyle results in elevations that contain much opening. In such cases, diagonalbracing may not be possible and it is necessary to search for another solutions.Floor, ro<strong>of</strong> or walls constructions <strong>of</strong>ten are made <strong>of</strong> panels supported bysteel joists, rafters or studs respectively. Only when the connections between
Low-rise residential buildings built with cold-formed lightweight steel members 36sheathings and supporting members are properly designed, these structurescan perform as a diaphragm and the structural system is termed a “boxsystem”. In this way, it is possible to take advantage <strong>of</strong> suitable sheathingsmaterials.Floors and ro<strong>of</strong>s can be considered horizontal, simple supporteddiaphragms, whereas walls can be regarded as vertical, cantilevereddiaphragms. For full diaphragms design, it is necessary to analyze sheathings,connections, diaphragm edge members, and tie-down behavior. In fact, adiaphragm acts in a manner analogous to a deep beam, where the sheathingsact as a web, resisting shear, while the diaphragm edge members perform thefunction <strong>of</strong> flange, resisting bending. The diaphragm edge members arecommonly called chords, and may be joists, trusses, studs, etc.Due to the great depth <strong>of</strong> most diaphragms in the direction parallel to that<strong>of</strong> load, and to their way <strong>of</strong> assembly, the behavior differs slightly from that <strong>of</strong>the usual beam.<strong>Shear</strong> stresses have been proven essentially uniform across the depth <strong>of</strong> thediaphragm, rather than showing significant parabolic distribution as in the web<strong>of</strong> a beam.Chords in a diaphragm carry all “flange" stresses acting in a simple tensionand compression, rather than devising these stresses significantly with theweb.As in any beam, consideration must be given to bearing stiffeners,continuity <strong>of</strong> webs and chords, and to web buckling, which is normallyresisted by the framing members.Diaphragms vary considerably in load-carrying capacity, depending onwhether they are blocked or unblocked. Blocking consists generally <strong>of</strong> lippedor unlipped channel sections placed between the joists or other primarystructural supports for the specific purpose <strong>of</strong> connecting the edges <strong>of</strong> thepanels (see Fig. 1.30). Systems that provide support framing at all sheathingedges are also considered blocked. The reason <strong>of</strong> blocking in diaphragms is toallow connection <strong>of</strong> sheathings at all edges for better shear transfer. Buckling<strong>of</strong> unsupported sheathing edges, with consequent reduced load bearingcapacity, controls unblocked diaphragm behavior.The three main part <strong>of</strong> a diaphragm are the web, the chords, and theconnections. Since the individual pieces <strong>of</strong> web must be connected to form a
Low-rise residential buildings built with cold-formed lightweight steel members 37unit, since the chord members in all probability are not a single pieces, sinceweb and chords must be fixed so that they act together, and since the loadsmust have a path to other elements or to the foundation, connections arecritical to good diaphragm action. Their choice actually becomes a major part<strong>of</strong> the design procedure.Figure 1.28: Distribution <strong>of</strong> horizontal (wind) loads in a house construction.Figure 1.29: Wall braced with steel sheet X-bracing.
Low-rise residential buildings built with cold-formed lightweight steel members 38sheathingjoistflat strapblockingFigure 1.30: Blocking.1.8 ADDITIONAL CONSIDERATIONS1.8.1 Fire resistanceDue to several aspects, the issues <strong>of</strong> CFS structures in fire are muchdifferent in comparison to those for hot-rolled structures.<strong>Cold</strong>-formed members are generally used in low-rise constructions wherethe fire resistance requirements may be less onerous.In CFS pr<strong>of</strong>iles, the thin material produce more limited thermal capacity incomparison to that for hot-rolled members.For hot-rolled members, the critical steel temperature, at which structuralfailure may by anticipated, is in the region 450-700°C, depending on thestructural system and the load level in the vicinity <strong>of</strong> the fire. In absence <strong>of</strong>any calculation model, a conservative approach for CFS pr<strong>of</strong>iles is to designthe fire protection systems to achieve a critical temperature <strong>of</strong> 350°C.In conventional hot-rolled construction, the fire resistance may be providedby protection applied to the members in the form <strong>of</strong> boards or sprayed onmaterials which delay the temperature increase in the steel by providingthermal insulation. Otherwise, CFS pr<strong>of</strong>iles in residential buildings are more
Low-rise residential buildings built with cold-formed lightweight steel members 39<strong>of</strong>ten part <strong>of</strong> a wall or floor structure such that they do not require speciallyapplied fire protection <strong>of</strong> this sort. In fact, walls and floors are usually built up<strong>of</strong> layers <strong>of</strong> materials such as mineral wool and gypsum board in order to meetthe requirements <strong>of</strong> sound and thermal insulation and these materials generallyalso have favorable properties <strong>of</strong> fire insulation. Thus, these elements <strong>of</strong> theconstruction can be built up in such a way that they meet all <strong>of</strong> theperformance requirements with regard to resistance to fire, sound and thermalloss in a consistent manner.1.8.2 DurabilityWith good quality detailing, the durability <strong>of</strong> a CFS structure should be thesame <strong>of</strong> traditional construction. There are two characteristics forguaranteeing good durability: avoid the accumulation <strong>of</strong> moisture in the external envelope; avoid bringing incompatible materials into contact with each other.These aspects are related because most types <strong>of</strong> material incompatibilityare aggravated in the presence <strong>of</strong> moisture. Main forms <strong>of</strong> materialincompatibility to avoid are the followings. Bimetallic contact: this is only likely if the cladding or fasteners are <strong>of</strong>a different material to the main structure. Cementitious materials-to-steel contact: galvanized steel reacts withfresh cementitious materials with the formation <strong>of</strong> hydrogen bubbleson the surface <strong>of</strong> the zinc which reduce the bond with the steel. Thisreaction can be controlled by the addition <strong>of</strong> soluble chromates to thecementitious material but a more reliable solution is to chromate thesurface <strong>of</strong> the galvanized steel. Gypsum plaster-to-steel contact: moist gypsum plaster attacksgalvanized steel both in the fresh condition and if it dries out andsubsequently becomes wet. The G275 coating <strong>of</strong> normally galvanizedsteel will prevent corrosion <strong>of</strong> the metal. Wood-to-steel contact: wood is a corrosive material that can be mademore corrosive by the protective treatments given to it. Corrosion <strong>of</strong>metals in contact with timber is a function <strong>of</strong> the moisture content <strong>of</strong>the timber. Moreover, there is less risk with s<strong>of</strong>t woods than with hard
Low-rise residential buildings built with cold-formed lightweight steel members 40woods. Correct seasoning <strong>of</strong> the wood significantly reduces theproblem.To limit the corrosion <strong>of</strong> steel and to improve the durability there aregeneral precautions which can be followed. To ensure that the cladding is sufficiently impermeable and to detail itin such a way that rainwater does not penetrate the structural frame <strong>of</strong>the building. To ensure that the external envelope performs thermally in such a waythat condensation <strong>of</strong> moisture from humid air is not possible.1.8.3 Thermal and acoustic insulation, air and moisture permeabilityIn the design <strong>of</strong> walls and ro<strong>of</strong>s <strong>of</strong> lightweight construction thermal andacoustic insulation as well as air and moisture permeability are mostimportant.The need to achieve an adequate level <strong>of</strong> thermal insulation is now wellunderstood and the requirements seem to become more onerous year by year.A fundamental aspect is the need to avoid “thermal bridging”. It is less wellunderstood that this theoretical thermal performance can be reduced by airinfiltration, particularly at the ro<strong>of</strong> space <strong>of</strong> a building. It is also wellunderstood that it is necessary to avoid condensation <strong>of</strong> moisture within thestructure and that a primary requirement is an appropriately placed vaporbarrier.Control <strong>of</strong> thermal insulation, air and moisture permeability is largely amatter <strong>of</strong> good detailing. For most climates, the first essential is a high level <strong>of</strong>thermal insulation and this generally involves the provision <strong>of</strong> an appropriatethickness <strong>of</strong> insulation material as well as a cavity. The insulation material isgenerally mineral wool although a wide variety <strong>of</strong> suitable alternatives isavailable. It is also essential to avoid thermal bridges and moisturepenetration. Some insulation details <strong>of</strong> wall and ro<strong>of</strong> construction are shownin Figure 1.31.Sound transmission and attenuation is an other most significant problembecause the occupants <strong>of</strong> buildings are rightly sensitive to noise intrusion fromother occupants <strong>of</strong> the same building or from outside. Fiberglass or celluloseinsulation installed in floor assemblies can significantly reduce the sound
Low-rise residential buildings built with cold-formed lightweight steel members 41transmission. Moreover, good construction practices can also result insignificant reduction in sound transmission through CFS floors.Insulation <strong>of</strong> a wall.Insulation <strong>of</strong> a ro<strong>of</strong>.Figure 1.31: Typical insulation details.1.9 ADVANTAGES AND LIMITATIONSThere are numerous advantages that can be obtained by using CFSmembers in residential construction. The main benefits are the followings. High structural performance: The CFS members <strong>of</strong>fer one <strong>of</strong> thehighest load capacity-to-weight ratio <strong>of</strong> any building componentcurrently on the market. The strength <strong>of</strong> steel permits the use <strong>of</strong> greaterspans than would be possible with wood components, <strong>of</strong>ten requiringless material. For example, joists and studs can be positioned 600mmon center and support the same load as wood framing 400mm oncenter. Lightweight: The lightweight <strong>of</strong> framing components reduces totalbuilding and seismic loads. Moreover, it is easy to handle, contributingto reduced labor costs and worker fatigue. High quality: The steel pr<strong>of</strong>iles are produced in factory, consequentlythey are more straight, uniform and consistent in quality than wood,hand-laid masonry and in-situ concrete elements. Design flexibility: The variety <strong>of</strong> size and thicknesses <strong>of</strong> steelcontribute to flexibility. For example, to obtain a desiderate design it
Low-rise residential buildings built with cold-formed lightweight steel members 42can reduce the width <strong>of</strong> a joist but compensate with a heavier gaugesteel and not change the spacing <strong>of</strong> members.Construction speed. It is possible to erect a CFS structure in much lesstime than a traditional structure.Dry constructions: Except for the foundation, the use <strong>of</strong> the CFSstructures allow dry constructions, therefore, dirt, dust and general lack<strong>of</strong> precision associated with hand-laid masonry, in-situ concrete areavoided.Ease <strong>of</strong> wiring installation: Holes are normally preformed simplifyingthe installation <strong>of</strong> the wirings.Recyclables: <strong>Cold</strong>-formed steel members are easily recycled.Common appearance: Once exterior and interior finishes are installed,a traditional and a CFS house are indistinguishable from each other.Incombustibility: <strong>Steel</strong> does not burn and prevents the spread <strong>of</strong> fire.The principal limitations that restraining the use <strong>of</strong> CFS framing inresidential house are the followings. Thermal performance: The thermal performance <strong>of</strong> steel usingstandard framing techniques is below that <strong>of</strong> traditional framing due tothermal conductivity <strong>of</strong> steel. Remedies, such as applying externalinsulation to the frame, add to the cost and the difficulty <strong>of</strong> fasteningwith screws. Fastening: The installation labor cost <strong>of</strong> CFS framing is higher thanfor wood framing. The primary labor component where productivitylags is the fastening <strong>of</strong> steel members using self-drilling screws.Development <strong>of</strong> pneumatic and clinching technology holds promise <strong>of</strong>improving fastening.REFERENCESAISI (1993) Fasteners for residential steel framing. AISI (American iron and <strong>Steel</strong>Institute). Washington DC.AISI (1996) <strong>Cold</strong>-formed steel design manual. AISI (American Iron and <strong>Steel</strong>Institute). Washington DC.
Low-rise residential buildings built with cold-formed lightweight steel members 43ANSI A208.1-93 (1993) Mat-formed wood particleboard. ANSI (American NationalStandards Institute). New York.ASTM C1396/C1396M-02 (2002) Standard specification for gypsum board. ASTM(American Society for Testing and Materials). West Conshohocken, PA, USA.AS/NZS 4600 (1996) <strong>Cold</strong>-formed steel structures. AS/NZS (AustralianStandards/New Zealand Standards). Sydney.Branston, A., Boudreault, F., Rogers, C.A. (2003) Testing on steel frame / woodpanels shear walls. Progress Report, Departement <strong>of</strong> Civil Engineering and AppliedMechanics, McGill University. Montreal.CSSBI (1991) Canadian <strong>Steel</strong> framing design manual, CSSBI (Canadian Sheet <strong>Steel</strong>Building Institute). Cambridge, Ontario.Davies J.M. (1998) Light gauge steel framing for housing construction. InProceedings <strong>of</strong> the 2nd International conference on thin-walled structures.Singapore.EN 309 (1993) Wood particleboards – Definition and classification. CEN (EuropeanCommittee for Standardization). Bruxelles.EN 313-1 (1997) Plywood. Classification and terminology - Classification. CEN(European Committee for Standardization). Bruxelles.EN 313-2 (2000) Plywood - Classification and terminology - Terminology. CEN(European Committee for Standardization). Bruxelles.ENV 1993-1-3 (1996) Eurocode 3: Design <strong>of</strong> steel structures – Part 1-3: Generalrules - Supplementary rules for cold formed thin gauge members and sheeting. CEN(European Committee for Standardization). Bruxelles.Faherty, K.F. and Williamson, T.G. (1999) Wood Engineering and constructionhandbook (Third edition). McGraw-Hill.Grubb, P.J. & Lawson, R.M. (1997) Building design using cold formed steel sections:construction detailing and practice. SCI Publication P165. The <strong>Steel</strong> ConstructionInstitute. Ascot, Berkshire, United Kingdom.Hilti (2001) Hilti North America product technical guide.ISO (1980) Gypsum plasterboard – Specification. ISO (International Organization forStandardization). Geneva.Landolfo, R., Di Lorenzo, G, Fiorino, L. (2002) Attualità e prospettive dei sistemicostruttivi cold-formed. Costruzioni metalliche No.1
Low-rise residential buildings built with cold-formed lightweight steel members 44Lawson, R.M. & Ogden, R.G. (2001) Recent developments in the light steel housingin the UK. In Proceedings <strong>of</strong> the 9th North steel conference <strong>of</strong> construction institute.Helsinki.Mkelinen, P., Kesti, J., Kaitila, O. (1998) Advanced method for light-weight steeltruss joining. In Proceedings <strong>of</strong> the Nordic steel construction conference '98. Bergen,Norway.NASFA (2000) Prescriptive Method For Residential <strong>Cold</strong>-<strong>Formed</strong> <strong>Steel</strong> Framing(Year 2000 Edition). NASFA (North American <strong>Steel</strong> Framing Alliance). Lexington,KY, USA.Pedreschi, R.F. & Sinha, B.P. (1996) The potential <strong>of</strong> press-joining in cold-formedsteel structures. Construction and building materials, Vol.10.PS1-95 (1983) Voluntary product standard PS1-95 for commercial and industrialplywood, U.S. Department <strong>of</strong> commerce, National institute <strong>of</strong> standard andtechnology. Gaithersburg, MD, USA.Schuster, R.M. (1996) Residential applications <strong>of</strong> cold-formed steel members inNorth America. In Proceedings <strong>of</strong> the 5th International Structural Stability ResearchConcilium – SSRC. Chicago.Yu, W.W. (2000) <strong>Cold</strong> <strong>Formed</strong> Design (3rd Edition). John Wiley & Sons. NewYork.
45Chapter IIDesign <strong>of</strong> cold-formed steel stud shearwalls<strong>Cold</strong>-formed/light gauge steel (CFS/LGS) buildings typically use woodstructural panel sheathing fastened to repetitive member framing to provide anadequate lateral force resisting system (LFRS) to resist seismic and windloads. Therefore, the evaluation <strong>of</strong> the shear strength values used in the design<strong>of</strong> these systems are critical to the accuracy and efficiency <strong>of</strong> an engineeringanalysis and design for the cold-formed steel stud shear walls (CFSSSW).The objective <strong>of</strong> this Chapter is to provide a concise basic design referencefor CFS/LGS LFRSs. The Chapter is organized in three main parts. In the firstpart (Section 2.1) the main shear wall design methodologies are illustrated.The semi-analytical evaluation <strong>of</strong> shear strength for CFSSSWs is examined inthe second part (Section 2.2). In the third part (Section 2.3) the units sheardesign values for CFSSSWs reported in the main Codes (UBC 1997, IBC2000) are examined.
46 Chapter II2.1 MAIN DESIGN METHODOLOGIES FOR SHEARSTRENGTH OF CFSSSWsTwo main design methodologies for the evaluation <strong>of</strong> the shear capacity <strong>of</strong>a CFSSSW exist, following methods similar to that used for wood-framedwalls: “segment” method; “perforated shear wall” method.The “segment” method is a traditional shear wall design methodology. Thebasic principles are demonstrated in the simple shear wall segment model <strong>of</strong>Figure 2.1.This model is commonly used in current engineering practice to designwall segments in a wood frame building to resist lateral loads. In this simpleapproach, the effects <strong>of</strong> contributions from various connections and wallportions that are not part <strong>of</strong> the “designed” LFRS are neglected, as shown inFigure 2.2a. Therefore, while the method provides a simple analysis, itrequires greater amounts <strong>of</strong> connection for each shear wall segment thatdecreases the construction speed and increases the costs. This method <strong>of</strong> shearwall design is most appropriate for heavily loaded walls and those with manylarge openings that effectively break a wall line into segments. An examplewould be the design <strong>of</strong> shear wall segments to either side <strong>of</strong> a garage openingthat supports more than a ro<strong>of</strong> load above. In other less demanding situationsthis process will tend to provide a conservative design with the largestamounts <strong>of</strong> hold-down connectors.This method is described in numerous technical resources on wood-framedshear wall design (Hoyle & Woeste 1986, Ambrose & Dimitry 1987, Beyer 1993,APA 1996, SSTD 10-97 1997).
Design <strong>of</strong> cold-formed steel stud shear walls 47unit shear vshearforce VBasic relations:htypicaloverturninganchorV = v wT = C = V h / wTvwCFigure 2.1: Model <strong>of</strong> a simple shear wall.In the “perforated shear wall” method the resistance <strong>of</strong> shear walls withun-restrained openings can be determined with reasonable accuracy (about ±5%) by an empirical method known as the Perforated <strong>Shear</strong> Wall (PSW)design method (Dolan & Heine 1997a, b, Dolan & Johnson 1997a, b, NAHBResearch Center 1997, 1998).The PSW design method is very simple, andonly requires that a fully-sheathed wall line with perforations for windows anddoors be restrained at the ends with a hold-down bracket or adequate cornerframing in lower capacity shear walls (Dolan & Heine 1997c), as shown inFigure 2.2b. For determining the shear wall capacity, all that is needed is theunit shear value for the shear wall construction, the area <strong>of</strong> wall openings, thelength <strong>of</strong> full-height wall segments, and the overall length <strong>of</strong> the wall. Thesevalues are inputs to a simple two-step equation that gives the overall wallcapacity without the use <strong>of</strong> internal connection detailing or hold-downs.In particular, the PSW design method for wood-frame shear wallsappearing in the IBC is based on the Sugiyama & Matsumoto’s (1994)equation. This equation gives the ratio <strong>of</strong> the strength <strong>of</strong> a shear wall withopenings to the strength <strong>of</strong> a fully sheathed shear wall without openings (F):
48 Chapter IIrF (2.1)3 2rwhere r is the sheathing area ratio as defined in the following equation:1r (2.2)Ao1h Liwhere Ao is the total area <strong>of</strong> openings, h is the height <strong>of</strong> the wall and Li is thelength <strong>of</strong> the full height wall segment.Wall 1 Wall 2 Wall 3Wallw 1 w 2 w 3w(a)V = v (w 1 + w 2 + w 3 )(b)V = F vwFigure 2.2: Comparison between Segment method (a) and PSW method (b).For both the Segment and the PSW methodology the evaluation <strong>of</strong> shearwall capacity <strong>of</strong> a fully sheathed shear wall without openings is required. Thisevaluation may be achieved by a semi-analytical approach based on the model<strong>of</strong> a simple shear wall or by the nominal shear value tables for specific wallconfigurations obtained on the basis <strong>of</strong> experimental results.2.2 SEMI-ANALYTICAL EVALUATION OF SHEARSTRENGTHThe shear capacity <strong>of</strong> a CFSSSW is quite complex and depends by manyfactors. If a shear wall is laterally braced by sheathings this factors may bygrouped as follows (Fig. 2.3): strength <strong>of</strong> the sheathings; strength <strong>of</strong> the sheathing-to-frame connections;
Design <strong>of</strong> cold-formed steel stud shear walls 49strength <strong>of</strong> the frame (stud buckling strength);strength <strong>of</strong> the frame-to-foundation connections.FrameSheathing-to-frameconnectionsFrame-to-foundationconnectionsFigure 2.3: Factors affecting CFSSSWs shear behavior.A different failure mode is associated to each factor reported above.Following the limit states design philosophy, the smallest value obtained fromall <strong>of</strong> these possible failure modes will control the shear capacity <strong>of</strong> the wall(v), as defined by the following relation:v min vS; vSF; vF; vFF(2.3)in which v S , v S-F , v F and v F-F are the shear strengths associate to sheathing,sheathing-to-frame connections, frame and frame-to-foundation connectionsfailure, respectively.In most cases, a shear wall fails due to the sheathing-to-frame collapse. Infact, all the CFSSSW components are designed according to capacity designprinciples, in such a way to promote the development <strong>of</strong> the full shear strength<strong>of</strong> sheathing-to-frame connections. For this reason, the studs (frame) aredesigned to avoid failure due to buckling in end studs. Analogously, the holddownand shear anchors (frame-to-foundation connections) are designed toprevent either shear failure at the base <strong>of</strong> the walls or failure due tooverturning. Moreover, the types <strong>of</strong> sheathings generally used in the
50 Chapter IICFSSSWs (wood-based and gypsum-based panels) are able to avoid thesheathing collapse. Consequently the evaluation <strong>of</strong> strength for the sheathingfailure usually is not performed (v S >> max {v S-F ; v F ; v F-F }).Strength calculations for the different failure modes <strong>of</strong> a CFSSSW laterallybraced with wood-based sheathings, as schematised in Table 2.1, are detailedbelow.CFSSSW ComponentsSheathingsSheathing-to-frame connections (S-F)Frame (F)Tension frame-to-foundation connections (F-F)N<strong>Shear</strong> frame-to-foundation connections (F-F)VFailure modesNeglectedBearing in the steel frame (bs)Tilting <strong>of</strong> the screw (ts)Screw shear (ss)Bearing in the wood panels (bp)<strong>Stud</strong> buckling (sb)Hold-down (hd)<strong>Shear</strong> in hold-down-to-frame connection (hd-fr)Tension in the hold-down-to-foundation connection (hd-fo)Anchor-to-frame connection (a-fr)Anchor-to-foundation connection (a-fo)Table 2.1: Failure modes in a CFSSSW braced laterally with wood based panels.2.2.1 Strength <strong>of</strong> the sheathing-to-frame connections (S-F)The wood-based sheathing-to-steel frame screw connections are subjectedto shear forces consequently their failure limit modes include, as reported inFigure 2.4: bearing failure in the steel frame; tilting failure <strong>of</strong> the screw; screw shear failure; bearing failure in the wood panels.Therefore, the shear strength <strong>of</strong> a sheathing-to-frame connection (F S-F ) isequal to the minimum <strong>of</strong> the shear strengths associated to each failure mode,as defined by the following relation:FSF minFSF, bs;FSF, ts;FSF, ss;FSF, bp(2.4)where:F S-F,bs : is the bearing strength <strong>of</strong> the screws for steel members;
Design <strong>of</strong> cold-formed steel stud shear walls 51F S-F,ts : is the tilting strength <strong>of</strong> the screws;F S-F,ss : is the shear strength <strong>of</strong> the screws;F S-F,bp : is the bearing strength <strong>of</strong> the screws for wood panels.Bearing failure in the steel frametilting failure <strong>of</strong> the screwscrew shear failurebearing failure in the wood panelsFigure 2.4: Failure modes <strong>of</strong> sheathing-to-frame connections under shear loading.Bearing failure in the steel frame (F S-F,bs )Because cold formed steel frame are relatively thin (0.6÷1.5mm) comparedwith the thickness <strong>of</strong> wood-based sheathings (10÷20mm) normally used inCFSSSW structures, it is possible to calculate the bearing strength <strong>of</strong> thescrews for steel members (F S-F,bs ) with the following equation:FSF, bs tf d fu,s(2.5)where:: is a coefficient defined as follows: = 2.1 in Eurocode 3 - Part 1.3 (ENV 1993-1-3 1996) = 2.7 in AISI (1999)t f : is the thickness <strong>of</strong> the cold-formed steel member;d: is the nominal diameter <strong>of</strong> the screw;f u,s : is the tensile strength <strong>of</strong> the cold-formed steel member.Tilting failure <strong>of</strong> the screw (F S-F,ts )The tilting strength <strong>of</strong> the screws (F S-F,ts ) is defined as follows:3 0.5tf d fu s3 0.5tf d fusFS F , ts 3.2 ,for ENV 1993-1-3 (1996) (2.6)FS F , ts 4.2 ,for AISI (1996) (2.7)
52 Chapter IIScrew shear failure (F S-F,ss )The shear resistance <strong>of</strong> screws must be documented by testing andprovided by the manufacturer. For avoiding a brittle and sudden fracture <strong>of</strong> ascrew subjected to a shear force, the shear strength <strong>of</strong> the screws (F S-F,ss ) mustbe larger than the bearing strength (F S-F,bs ) and tilting strength (F S-F,ts ) <strong>of</strong> thescrews (F S-F,ss 1.2 F S-F,bs and F S-F,ss 1.2 F S-F,ts in ENV 1993-1-3 (1996) orF S-F,ss 1.25 F S-F,bs and F S-F,ss 1.25 F S-F,ts in AISI (1996)). Some indicativevalues <strong>of</strong> the characteristic shear resistance <strong>of</strong> screws made <strong>of</strong> hardened orstainless steel are reported in Table 2.2.Nominal diameter (mm) Hardened steel Stainless steel4.8 5.2 4.65.5 7.2 6.56.3 9.8 8.58.0 16.3 14.3Table 2.2: Indicative shear resistance <strong>of</strong> screws (kN/screw).Bearing failure in the wood panels (F S-F,bp )The bearing strength <strong>of</strong> the screws for wood panels (F S-F,bp ) is defined bythe following equation (Faherty & Williamson 1999):ts du fb,wFS F , bp 3. 5CDKD(2.8)where:C D : is the duration factor, which is equal to 1.6 for wind andearthquake loads;K D : is a coefficient that depends on the diameter <strong>of</strong> the screw:K D = 2.2 for D 4.3mm;K D = 10 D + 0.5 for 4.3mm < D < 6.4mm;K D = 3.0 for D > 6.4mm;t s : is the thickness <strong>of</strong> the wood-based sheathing;d u : is the unthreaded shank diameter <strong>of</strong> the screw;f b,w : is the dowel bearing strength <strong>of</strong> the wood-based sheathing.
Design <strong>of</strong> cold-formed steel stud shear walls 53<strong>Shear</strong> strength <strong>of</strong> the wall associated to sheathing-to-frame connectionsstrength (v S-F )Two methods exist to calculate the shear strength associated to sheathingto-frameconnections: Easley et al.’s method; simplified method.The Easley et al.’s method (Easley et al. 1982) is a design procedure thatrelates the shear capacity per unit length (v S-F ) with the shear strength <strong>of</strong> thesheathing-to-frame connections (F S-F ), based on equilibrium. Based on theresults <strong>of</strong> observation tests performed on wood-frame shear walls withplywood panels, the fasteners’ forces in a typical sheathing <strong>of</strong> a loaded shearwall were assumed to be directed as shown in Figure 2.5. In particular: The fastener forces in the sheathing ends were assumed to have both x-and y-components. The x-components (F ex ) were assumed uniform inthe x-direction. The y-components (F eyi ) were assumed proportional tothe distances <strong>of</strong> the fasteners from the sheathing center line (x ei ). The fastener forces in the sheathing sides (F s ) were assumed to beuniform and to act only in the y-direction (along the stud). The F sforces were assumed to be proportional to their distances from thesheathing center line. The fastener forces in the interior studs (F si ) were assumed to act onlyin the y-direction (along the stud) and to be proportional to thedistances x si .Indicating with:a: the length <strong>of</strong> the sheathing;h: the height <strong>of</strong> the wall;n e : the number <strong>of</strong> the end fasteners;n s :n si :the number <strong>of</strong> the side fasteners, excluding those at the end;the number <strong>of</strong> the fasteners in each interior stud, excluding thoseat the end;m: the number <strong>of</strong> the interior studs.
54 Chapter IIInteriorFastenersFigure 2.5: Assumed sheathing fastener forces (Easley et al. 1982).the relations between the side fastener forces (F s ), the end fastener forces (F ei )and the shear force per unit length acting on the shear wall (v a ) are thefollowings:Fshs (2.9)v where: nsn ei1m4I2I e x ei2I s x sii1ea22F ei a h ei 2xei (2.10)va ne a 2n2asiIs0.5
Design <strong>of</strong> cold-formed steel stud shear walls 55Defining with max the largest value between that obtained from s and ei ,the shear strength per unit length (v S-F ) is obtained as follow:1vSF FSF(2.11)maxin which F S-F is defined in Equation (2.4).With the simplified method it is assumed that only the end screws resisthorizontal load, and consequently, the contribution <strong>of</strong> side and interiorfasteners is ignored. According to this hypothesis the shear strength per unitlength (v S-F ) is obtained from the value <strong>of</strong> sheathing-to-frame connectionsshear strength (F S-F ), multiplied by the number <strong>of</strong> the end fasteners per unitlength (n’ e ):vSF n' eFSF(2.12)2.2.2 Strength <strong>of</strong> the frame (stud buckling strength) (F)Considering that the end studs are subjected to high compression force dueto overturning, it is possible that these members will fail due to stud buckling.The sheathing, usually connected to studs by screws, significantly restrainsthe buckling behavior <strong>of</strong> the studs. Therefore, the strength <strong>of</strong> the sheathed studwall system is significantly larger than that <strong>of</strong> unsheathed studs.Unsheathed studIn general, considering an unsheathed stud it can present three differenttypes <strong>of</strong> buckling: local, distortional and global (flexural and/or torsional)buckling or their coupling.When global buckling occurs, any cross-section <strong>of</strong> the stud moves as arigid body with a half-wavelength comparable to that <strong>of</strong> the stud. This type <strong>of</strong>buckling is governed by the global slenderness <strong>of</strong> the stud and normallyimplies the collapse <strong>of</strong> the structure.Local buckling is characterized by a relatively short half-wavelength <strong>of</strong> theorder <strong>of</strong> magnitude <strong>of</strong> individual plate elements, while the fold lines remainstraight.Distortional buckling implies the rotation and the translation <strong>of</strong> the multipleelements <strong>of</strong> the cross-section. This bucking mode occurs at a half-wavelength
56 Chapter IIintermediate to local and global mode buckling. Also, the cross section getsmuch more distorted than in the local one.Both local and distortional modes do not imply the collapse <strong>of</strong> thestructure. In fact, in these cases post-buckling strength is developed.Figure 2.6 illustrates these three modes <strong>of</strong> buckling for an unsheathed stud.Figure 2.6: Buckling modes <strong>of</strong> an unsheathed stud.The behavior <strong>of</strong> cold-formed steel members is characterized by high nonlinearity;consequently, its accurate prediction is feasible only through a finiteelement analysis that takes in to account both mechanical and geometricalnon-linearity (Della Corte et al. 2003, Fiorino et al. 2003). As a result <strong>of</strong> thisdifficulty, the design methodologies currently assumed in many Codes adoptsemi-empirical approaches that predict the ultimate strength through thedetermination <strong>of</strong> the elastic buckling load and considering a series <strong>of</strong> ultimatestrength curves (Fiorino & Landolfo 2001).LOCAL BUCKLINGLocal buckling is typically treated by ignoring any interaction betweenelements (flanges, web and lips). Each element is considered independentfrom the others and classical plate buckling equations based on isolatedsimply supported plates are generally used. In this approach, termed “element
Design <strong>of</strong> cold-formed steel stud shear walls 57model”, each element <strong>of</strong> the section is predicted to buckle at a different stress.The critical stress <strong>of</strong> each element is obtained by the well-known Eulerformula:2 E t cr k 2 (2.13)12(1 ) b where b and t are respectively the width and the thickness <strong>of</strong> the consideredelement, E and are respectively the Young’s modulus and the Poisson’s ratio<strong>of</strong> the material and k is the buckling factor which depends on the type <strong>of</strong>element (double or simply supported element) and on the stress distributionalong the element. The buckling factor k is equal to 4 for a stiffened element(double supported element) and to 0.43 for an unstiffened element (simplysupported element) under uniform compression.In order to better predict the actual local buckling stress, semi-empiricalmethods including elements interaction have been proposed by Batista (1988)and Shafer & Peköz (2001). In these approaches the expressions for k aredetermined by empirical close-fit solutions to finite strip analysis results.For the determination <strong>of</strong> the axial strength under local buckling (N b,l )effective widths and effective cross-section properties are generally used.According to the semi-empirical Von Karman’s approach, the non-uniformdistribution <strong>of</strong> stresses, which crop up in the post-buckling range, can bereplaced by an equivalent uniform stress distribution equal to the yield limitstress (f y ) acting on the effective width <strong>of</strong> the plate (b eff ). The effective widthformula usually adopted is the well-known semi-empirical formula proposedby Winter:b eff b(2.14)where: 1 if 0. 673 0.22 1 1 if p 0. 673(2.15) p pin which the normalized plate slenderness pis given by:fyp (2.16)crp2
58 Chapter IIThe reduced properties <strong>of</strong> effective plate elements in compression may becombined with the full width <strong>of</strong> plate element in tension to give an effectivecross-section for use in strength calculations.DISTORTIONAL BUCKLINGDistortional buckling usually involves rotation <strong>of</strong> each flange and lip aboutthe flange-web junction in opposite directions as shown in Figure 2.6. Theweb undergoes flexure at the same half-wavelength as the flange buckle andthe whole section may translate in a direction normal to the web also at thesame half-wavelength as the flange and web buckling deformations. The webbuckle involves single curvature transverse bending <strong>of</strong> the web.A general model for the determination <strong>of</strong> the elastic distortional bucklingstress under axial compression has been originally developed by Lau &Hancock (1987). Figure 2.7 shows this analytical model that is based on aflange buckling where the flange is treated as a compression memberrestrained by a rotational and a transational spring. The rotational springstiffness k , represents the torsional restraint from the web and the transationalspring stuffiness k x , represents the torsional restraint to transational movement<strong>of</strong> the cross-section. Lau & Hancock showed that the transational springstiffness k x , does not have much significance and the value <strong>of</strong> k x was assumedto be zero. The key to evaluating this model is to consider the rotational springstiffness k , and the half buckling wavelength , while taking account <strong>of</strong>symmetry.Figure 2.7: “Flange buckling” model for distortional column buckling (Landolfo et al. 2002).
Design <strong>of</strong> cold-formed steel stud shear walls 59The Authors gave a detailed analysis in which the effect <strong>of</strong> the localbuckling stress in the web and <strong>of</strong> shear and flange distortion were taken intoaccount in determining expressions for k and . This gives rise to a ratherlong and detailed series <strong>of</strong> explicit equations for the distortional bucklingstress that, not-withstanding their cumbersome nature, are included in theAustralian/New Zealand Code (AS/NZS 4600 1996).A similar set <strong>of</strong> explicit equations bas also proposed by Schafer (2001) andwill be incorporated in future AISI Specifications.For the determination <strong>of</strong> the axial strength under distortional buckling(N b,d ), Hancock (1985) developed expressions on the basis <strong>of</strong> effective widthsfor distortional buckling.COUPLED BUCKLINGFor taking in-to account the interaction between local and global buckling,the axial strength (N b ) has to be based upon the effective cross-section,calculated for uniform compression.In Eurocode 3 - Part 1.3 (ENV 1993-1-3 1996) a well-known Ayrton-Perryformula is used for the calculation <strong>of</strong> the axial strength:N A f(2.17)where:A eff :Afb effy1 1(2.18)2 2 0.5 2 0.51 0.2 (2.19)is the area <strong>of</strong> effective cross-section at uniformcompression at yield limit stress;eff y is the normalized slenderness;NcrN cr :is the minimum elastic critical axial force for global(flexural and/or torsional) buckling for the gross crosssection;: is the imperfection factor corresponding to theappropriate buckling curve:= 0.34 for lipped channel section (curve b);= 0.49 for unlipped channel section (curve c).
60 Chapter IIIn AISI (1996) the axial strength (N b ) for concentrically loadedcompression members is calculated with the following equation:N A f A f(2.20)where:A e :ncf 0.6582fy if c 1.50.877 f if c > 1.5fn 2cfybeneffyis the area <strong>of</strong> effective cross-section at uniformcompression at stress f n ;yc is the normalized slenderness;cr cr :is the minimum elastic critical stress for global(flexural and/or torsional) buckling considering thegross cross-section.NEW METHODOLOGIES: DIRECT STRENGTH METHOD AND “WHOLE SECTION”APPROACHSchafer & Peköz (1998) have recently proposed a new procedure whichworks only with the gross properties <strong>of</strong> a member and can take into accountthe interaction between local and global buckling and also the interactionbetween distortional and global buckling.Use <strong>of</strong> the Direct Strength Method for columns requires (1) thedetermination <strong>of</strong> the elastic buckling axial load (N cr ) <strong>of</strong> the member and (2)using that information in a series <strong>of</strong> ultimate strength curves to predict thestrength (N b ) (Fiorino 2000).For the determination <strong>of</strong> the elastic buckling load, as an alternative to thetraditional analytical solutions, numerical solutions based on the “wholesection” approach may be used to accurately calculate the elastic bucklingbehavior necessary for step (1). In fact, besides to the traditional finite elementmethod (FEM) some friendly computer programs, mainly based on the finitestrip method (FSM) (CU-FSM 2003, THIN-WALL 2003) or the generalized
Design <strong>of</strong> cold-formed steel stud shear walls 61beam theory (GBT) (Davies & Leach 1994a, b) have been purposely writtenfor the determination <strong>of</strong> the local, distortional and global elastic critical loads.The procedure employed to calculate the axial strength is the sameunderlying empirical assumptions as the effective width method used in themain Specification. In fact, the axial strength (N b ) is a function <strong>of</strong> the elasticbuckling load (N cr ) and the yield load (N y ).In particular, the axial strength (N b ) is the minimum <strong>of</strong> axial strength forglobal (flexural and/or torsional) buckling (N b,g ), local buckling (N b,l ) anddistortional buckling (N b,d ):N b minNb , g; N b , l; N b , d(2.21)The axial strength for global buckling (N b,g ) is:Nb, g g Ny(2.22)with:20.877gg 0.658if g 1. 5 or g if 1. 52 g(2.23)in whichNyg is the normalized global slenderness and N cr,g is theNcr,gminimum <strong>of</strong> elastic critical axial loads for flexural, torsional and flexuraltorsionalbuckling.The axial strength for local buckling (N b,l ) is:Nb, l l Nb,g(2.24)with:l 1 if l 0. 776 or 1 0.15 1l if l l 0. 776 (2.25)lin which N elastic critical axial load for local buckling.0.4b,ll is the normalized local slenderness and N cr,l is theNcr,lThe axial strength for distortional buckling (N b,d ) is:Nb, d d Ny(2.26)with:g
62 Chapter IId 1 if d 0. 561 or 1 0.25 1d if d d 0. 561 (2.27)d0.6 Nyin which dis the normalized distortional slenderness and N cr,d is Ncr,d the elastic critical axial load for distortional buckling.<strong>Sheathed</strong> studIn a sheathed stud the bending strength and diaphragm action due to thepresence <strong>of</strong> the sheathings increase the load-carrying capacity considerably(Miller and Peköz 1993, 1994).In Eurocode 3 - Part 1.3 (ENV 1993-1-3 1996) only the diaphragmsbracingeffect on buckling <strong>of</strong> beams is considered, while the AISI (1996)Specification considers the effect <strong>of</strong> sheathing material on buckling <strong>of</strong>columns and beams. In particular, for the columns the AISI (1996) designrequirements are limited only to those studs that have identical wall materialattached to both flanges.In the evaluation <strong>of</strong> the axial strength (N b ) <strong>of</strong> a sheathed stud the AISI(1996) Specification follows the “Diaphragm stiffness” mechanical model.According to this approach the load-carrying capacity is governed by: column buckling <strong>of</strong> studs between fasteners in the plane <strong>of</strong> the wall(Fig. 2.4a); or overall column buckling <strong>of</strong> studs (Fig. 2.4b); or shear failure <strong>of</strong> the sheathing.Therefore, the axial strength (N b ) is equal to the minimum axial strengthassociated to the first two failure modes listed above, as defined by thefollowing relation:Nb minNbf; Nbo(2.28)where:N bf : is the axial strength associated to the column buckling <strong>of</strong> the studbetween fasteners;N bo : is the axial strength associated to the overall column buckling <strong>of</strong>the studs.
Design <strong>of</strong> cold-formed steel stud shear walls 63Moreover, it is needed to avoid the shear failure <strong>of</strong> the sheathing.(a) column buckling <strong>of</strong> studs between fasteners(b) overall column buckling <strong>of</strong> studsFigure 2.8: Buckling modes <strong>of</strong> a sheathed stud (AISI 1996).COLUMN BUCKLING OF STUDS BETWEEN FASTENERSIn case <strong>of</strong> column buckling <strong>of</strong> studs between fasteners in the plane <strong>of</strong> thewall, the failure mode can present local, distortional, global (flexural and/ortorsional) buckling or their coupling depending on the geometric configuration<strong>of</strong> the cross section and the spacing <strong>of</strong> fasteners. Consequently, in this case theevaluation <strong>of</strong> the axial strength (N bf ) is based on the same methodologiesillustrated for unsheathed studs without considering any interaction with thesheathing material in accordance with Equation 2.20 and considering anunbraced length equal to two times the distance between fasteners.OVERALL COLUMN BUCKLING OF STUDSThe overall column buckling <strong>of</strong> studs braced by sheathing material hasbeen mainly studied at Cornell University (Yu 2000). In particular, the earlierAISI provisions were developed on the basis <strong>of</strong> the Pincus & Fischer (1966),Errera et al. (1967), Apparao et al. (1969), Errera & Apparao (1976) andSimaan & Peköz (1976) research. In these studies, the sheathings wereattached either on both flanges or on one flange only <strong>of</strong> the studs. In addition,
64 Chapter IIboth the shear rigidity and the rotational restraint <strong>of</strong> the sheathings wereconsidered.For the purpose <strong>of</strong> simplicity, in the AISI Specification only the case <strong>of</strong>identical sheathings attached on both flanges is considered. Moreover, therotational restraint provided by sheathings is neglected.According to these hypotheses, in AISI (1996) the axial strength (N bo ) forconcentrically loaded compression members is calculated in accordance withEquation 2.20 with the elastic critical stress ( cr ) value obtained as follows: for singly symmetric C-sections, cr is the smallest <strong>of</strong> the followingelastic critical stresses: Q(2.29)crcr,ip a2, , ,,, ,4 ,, , cr op cr t Qcr op cr t Q cr opcr t Qcr(2.30)2 for doubly symmetric sections, cr is the smallest <strong>of</strong> the followingelastic critical stresses:cr cr,ip Qa(2.31)cr cr,op(2.32)In the above formulas: cr,ipis the elastic critical stress for flexural buckling in theplane <strong>of</strong> the wall considering the gross cross-sectionand an unbraced length equal to the length <strong>of</strong> the stud; cr,opis the elastic critical stress for flexural buckling in theout <strong>of</strong> plane <strong>of</strong> the wall considering the gross crosssectionand an unbraced length equal to the length <strong>of</strong>the stud; Qcr, t,Q cr,t cr,tQ a Q /Q tA2Qd 24Ar 0tis the elastic critical stress for torsional bucklingconsidering the gross cross-section and an unbracedlength equal to the length <strong>of</strong> the stud;
Design <strong>of</strong> cold-formed steel stud shear walls 65 s Q Q02 s'where:A: is the area <strong>of</strong> the gross cross-section;d: is the depth <strong>of</strong> the section;r 0 :is the polar radius <strong>of</strong> gyration <strong>of</strong> the cross sectionabout its shear center;s: is the fastener spacing (152mm s 305mm);s’ = 305mmQ0:is a parameter provided by AISI (1996) as function <strong>of</strong>the sheathing type; x 0 : x 1 0 r02is the distance from centroid to shear center.SHEAR FAILURE OF THE SHEATHINGTo prevent shear failure <strong>of</strong> the sheathing, a value <strong>of</strong> nominal strength(f bo =N bo / A) shall be used in the following equations so that the shear strain <strong>of</strong>the sheathing () does not exceed the permissible shear strain ( ) that isprovided by AISI (1996) as function <strong>of</strong> the sheathing type: E1d C1 (2.33)L 2 where: for singly symmetric C-sections:fbC0C1(2.34) f QE1fbcr,ipb2cr,op fbr0E0 x0D0fbx0D0 x0E02 f r f fx 2cr,opb0acr,t,Qbb0(2.35)for doubly symmetric sections:fbCC1 fcr,ip0b Qa(2.36)
66 Chapter IIE 1 = 0 (2.37)In the above formulas C 0 , E 0 , D 0 are initial column imperfections whichshall be assumed to be at least:C 0 = L/350in a direction parallel to the wall;E 0 = L/700in a direction perpendicular to the wall;D 0 = L/(10000 d) rad as measure <strong>of</strong> initial twist <strong>of</strong> the stud fromthe initial ideal, unbuckled shape.Moreover, if f b >0.5f y , then in the definitions for cr,ip , cr,op and cr,t , theYoung’s modulus (E) and the shear modulus (G) shall be replaced by E’ andG’, respectively, as defined below:fb fy fb E' 4 E(2.38)fysE'G' G(2.39)E<strong>Shear</strong> strength <strong>of</strong> the wall associated to stud buckling strength (v F )Assuming F F = N b as the strength associated to stud buckling failure, theshear strength per unit length <strong>of</strong> the wall (v F ) associated to this failure mode isobtained as follows:FFvF (2.40)hwith h height <strong>of</strong> the wall.RESULTS OF CURRENT STUDIESRecent studies have been dedicated to study cold formed steel stud wallssheathed with gypsum board panels (Miller & Peköz 1993, 1994; Lee &Miller 2001a, b; Talue & Mahendran 20001; Schafer & Hiriyur 2002).From these studies result that the “diaphragm stiffness” mechanical modeladopted by AISI (1996) may be inaccurate at least for the gypsum sheathings.In particular, Lee & Miller (2001a) report that the axial strength isindependent <strong>of</strong> stud spacing, reflecting the localized nature <strong>of</strong> the wallboarddeformations rather than the shear diaphragm behavior assumed in the current
Design <strong>of</strong> cold-formed steel stud shear walls 67AISI (1996) Specification. Moreover, using the differential equation <strong>of</strong>equilibrium the Authors derive an approach for determining the axial strength<strong>of</strong> a cold-formed steel stud wall sheathed with gypsum sheathings. In thisapproach, it is assumed that the axial load is applied to the centroid <strong>of</strong> thegross cross section for each stud and the bracing from the wallboardconnected by screws is represented by elastic springs.Shafer & Hiriyur (2002) summarize the deficiencies <strong>of</strong> models currentlyadopted by AISI (1996, 2001) and <strong>of</strong> the approach proposed by Lee & Miller(2001a). In particular, Shafer & Hiriyur carried out numerical analyses <strong>of</strong>sheathed wall systems using a plane stress FEM with imposed displacement,and a FSM with a discretized sheathing modeled. The Authors concludedfrom the numerical results that: (a) the “diaphragm stiffness” can be yet usedas basic mechanical model; (b) the diaphragm stiffness, per stud, is nonuniformand is not solely depended from stud spacing (as assumed in AISI1986) nor it is independent <strong>of</strong> stud spacing (as assumed in AISI 1996, 2001);(c) the sheathing resists against the weak axis buckling <strong>of</strong> the stud by means<strong>of</strong> shear stiffness, either locally <strong>of</strong> the material or globally for the diaphragm;(d) the sheathing does not have much influence on local buckling <strong>of</strong> studs; (e)in cases <strong>of</strong> highly dissimilar sheathing, such as in case <strong>of</strong> one-side sheathing,distortional buckling <strong>of</strong> studs influences the behavior (moreover both codifiedcurrent (AISI 1996, 2001) and novel (Lee & Miller 2001a) approaches do nottake in-to account this aspect; (f) in cases <strong>of</strong> sheathing on both sides the axialstrength significantly increases in comparison with one-side sheathing even ifsheathings are dissimilar or relatively weak (gypsum board); (g) a simpleapproach to evaluate the buckling capacity <strong>of</strong> unperforated studs with one-sideand/or dissimilar sheathing may be the FSM.However, additional experimental and theoretical research is needed forincreasing the knowledge <strong>of</strong> the stud-to-sheathing interaction and to providedesign methodologies that can easily and correctly evaluate the axial strength<strong>of</strong> cold-formed steel stud walls sheathed with panels.2.2.3 Strength <strong>of</strong> frame-to-foundation connections (F-F)The frame-to-foundation connections may by grouped in two types: tensionconnections and shear connections.
68 Chapter IIStrength <strong>of</strong> frame-to-foundation tension connections (F (F-F)N )Possible failure modes <strong>of</strong> tension connections are: failure in the hold-down (F (F-F)N,hd ); shear failure in the hold-down-to-frame connection (F (F-F)N,hd-fr ); tension failure in the hold-down-to-foundation connection(F (F-F)N,hd-fo ).Therefore, the strength <strong>of</strong> the tension frame-to-foundation connection(F (F-F)N ) is obtained by the minimum strength associated to each failure mode:F min F ; F F(2.41)( F F) N( F F) N , hd ( F F) N , hd fr;( F F) N , hd foFAILURE IN THE HOLD-DOWNThe strength corresponding to the failure in the hold-down (F (F-F)N,hd )regularly is not performed because the hold-down is normally purposelydesigned by the manufacturer to avoid its failure.SHEAR FAILURE IN THE HOLD-DOWN-TO-FRAME CONNECTIONThe strength corresponding to the shear failure in the hold-down-to-frameconnection (F (F-F)N,hd-fr ) depends on the type <strong>of</strong> connection used which isgenerally a bolted or screwed connection.In case <strong>of</strong> screwed connections, F (F-F)N,hd-fr is obtained by the minimum <strong>of</strong>the following values: the net section strength (F n ); the bearing/tilting strength (F b/t ); the screw shear strength (F s ).Figure 2.9 shows the failure mode associated to net section, bearing/tiltingand screw shear strengths.net section failurebearing / tilting failurescrew shear failureFigure 2.9: Failure modes <strong>of</strong> screwed connections under shear loading.
Design <strong>of</strong> cold-formed steel stud shear walls 69Because the hold down is thicker and stronger than the cold-formed steelstud, it is possible to calculate the strength by the equations reported below.The net section strength (F n ) is defined by the following equation:Fn Anet fu,s(2.42)where:A net is the net area <strong>of</strong> the cold-formed steel member;f u,s : is the tensile strength <strong>of</strong> the cold-formed steel member.The bearing/tilting strength (F b/t ) is defined as follows:Fb / t ns b / t tf d fu,s(2.43)where:n s : is the number <strong>of</strong> screws; b/t : is a coefficient defined as follows:if t hd = t f (tilting strength) 3.20.5/ d 2. in ENV 1993-1-3 (1996)t f 1 5b / tb / t 4.2t f/ d in AISI (1996)if t hd 2.5 t f (bearing strength) b/t = 2.1 in ENV 1993-1-3 (1996) b/t = 2.7 in AISI (1996)if t f < t hd < 2.5 t f b/t is obtained by linear interpolationt f : is the thickness <strong>of</strong> the cold-formed steel member;d: is the nominal diameter <strong>of</strong> the screw.The manufacturer usually provides the shear resistance (F s ). However,some indicative values <strong>of</strong> F s are given in Table 2.2 (see Section 2.2.1). Theshear strength <strong>of</strong> the screws (F s ) must be about 1.2 greater than thebearing/tilting strength (F b/t ) <strong>of</strong> the screws to avoid a brittle and suddenfracture <strong>of</strong> a screw.In case <strong>of</strong> bolted connections, F (F-F)N,hd-fr is obtained by the minimum <strong>of</strong> thefollowing values: the longitudinal shear strength <strong>of</strong> the sheet shear strength (F l );
70 Chapter II the net section strength (F n ); the bearing strength (F b ); the bolt shear strength (F v ).Figure 2.10 shows the above-introduced failure modes.Because the hold down is thicker and stronger than the cold-formed steelfame, it is possible to calculate the strength by the equations reported below.If the bolted part has a reduced edge distance in the direction <strong>of</strong> the appliedforce the connection can fails due to longitudinal shear collapse <strong>of</strong> the sheet.For this failure type, the nominal strength (F l ) is defined as follows:Fl e1 tf fu,s(2.44)where e 1 is the end distance from the center <strong>of</strong> the bolt to the adjacent end <strong>of</strong>the connected part, in the direction <strong>of</strong> load transfer (in ENV 1993-1-3 (1996)and AISI (1996)), or the distance from the center <strong>of</strong> the bolt to the nearestedge <strong>of</strong> an adjacent hole, in the direction <strong>of</strong> load transfer (in AISI (1996)only).longitudinal shear failure <strong>of</strong> the sheet shearbearing failurenet section failurebolt shear failureFigure 2.10: Failure modes <strong>of</strong> bolted connections under shear loading.For the net section strength (F n ) the ENV 1993-1-3 (1996) gives thefollowing formula: d Fn 1 3r Anet fu,s Anet fu,su (2.45)While, in case <strong>of</strong> channel sections having two or more bolts in the line <strong>of</strong>the force, the AISI (1996) defines F n as follows:
Design <strong>of</strong> cold-formed steel stud shear walls 71 x Fn1.0 0.36 Anet fu,s L(2.46)but F n 0.5 A net f u,s and F n < 0.9 A net f u,swhere:r: is the ratio between the number <strong>of</strong> bolts at the crosssection and the total number <strong>of</strong> bolts in the connection;u = 2e 2 p 2 with e 2 , the edge distance from the center <strong>of</strong> the bolt tothe adjacent edge <strong>of</strong> the connected part, in thedirection perpendicular to the load transfer and p 2 , thespacing center-to-center <strong>of</strong> bolts in the directionperpendicular to the direction <strong>of</strong> load transfer;x :is the distance from the shear plane to the centroid <strong>of</strong>the cross section;L: is the length <strong>of</strong> the connection.The bearing strength (F b ) is defined as follows:Fb nb be tf d fu,s(2.47)where:n b : is the number <strong>of</strong> bolts; be : is a coefficient defined as follows: be = 2.5, but be e 1 /1.2d in ENV 1993-1-3 (1996), where e 1 isthe end distance from the center <strong>of</strong> the bolt to the adjacent end <strong>of</strong>the connected part;in AISI (1996) be depends on the use <strong>of</strong> washers, thickness <strong>of</strong>connected part (t f ), type <strong>of</strong> joint, and f u,s /f y ; In particular, in case <strong>of</strong>t f < 4.76mm, for connections with washers under both bolt headand nut be ranges from 3.00 to 3.33, while for connectionswithout washers under both head and nut or with only one washer be ranges from 2.22 to 3.00.In ENV 1993-1-3 (1996), the bolt shear strength (F v ) is defined through thefollowing relation:Fv nb bo As fu,bo(2.48)in which:n b : is the number <strong>of</strong> bolts;
72 Chapter II bo :A s :f u,bo :is a coefficient that depends on the steel strength grade <strong>of</strong> the bolt: bo = 0.6 for strength grade 4.6, 5.6 and 8.8; bo = 0.5 for strength grade 4.8, 5.8, 6.8 and 10.9;is the tensile stress area <strong>of</strong> the bolt;is the ultimate tensile strength <strong>of</strong> the anchor steel.For the bolt shear strength (F v ) the AISI (1996) gives the followingformula:Fv nb Ab fv,bo(2.49)in which:n b : is the number <strong>of</strong> bolts;A b : is the gross cross-sectional area <strong>of</strong> the bolt;f v,bo : is the nominal unit shear strength <strong>of</strong> the bolt, provided by AISI(1996) as function <strong>of</strong> steel strength grade and diameter <strong>of</strong> bolt.TENSION FAILURE IN THE HOLD-DOWN-TO-FOUNDATION CONNECTIONThe failure mode in the connections between hold-down and foundationdepends on the type <strong>of</strong> anchor, depth <strong>of</strong> embedment, concrete strength, edgedistances and spacing between anchors (Hilti 2001).For both mechanical and adhesive-bonded anchors the main failure modesunder tension loading are concrete cone failure, pull-out (including anyexpansion sleeve), tension steel breakage. These different failure modes areshown in Figure 2.11.concrete cone failurepull-out failuresteel breakage failureFigure 2.11: Failure modes <strong>of</strong> anchors under tension loading (Hilti 2001).The tension strength <strong>of</strong> the hold-down-to-foundation connection(F (F-F)N,hd-fo ) is equal to the minimum strength associated to each differentfailure mode, as defined by the following relation:
Design <strong>of</strong> cold-formed steel stud shear walls 73F( F F ) N , hd fo min N c; N p; N s(2.50)where:N c : is the resistance against concrete cone failure;N p : is the resistance against pull-out failure;N s : is the tensile resistance <strong>of</strong> steel.The resistance against concrete cone failure (N c ) may be generally definedby the following relation: N r r(2.51)in which:N c,o :r N,s :r N,e :Nc c, o N , sN , eis the basic value <strong>of</strong> resistance against concrete cone failure, thatdepends on the type (AT) and diameter (d a ) <strong>of</strong> anchor, depth <strong>of</strong>embedment (d e ) and concrete strength (f ck ):N c,o =f(AT, d a , d e , f ck )is the anchor spacing reduction factor, that depends on type (AT)and diameter (d a ) <strong>of</strong> anchor, depth <strong>of</strong> embedment (d e ) and anchorspacing (s):r N,s =f(AT, d a , d e , s)1is the edge distance reduction factor, that depends on type (AT)and diameter (d a ) <strong>of</strong> anchor, depth <strong>of</strong> embedment (d e ) and anchoredge distance (e):r N,s =f(AT, d a , d e , e)1The resistance against pull-out failure (N p ) depends on the type <strong>of</strong> anchor(AT), its diameter (d a ) and depth <strong>of</strong> embedment (d e ):N p =f(AT, d a , d e ) (2.52)The following relation may generally be used to obtain the tensileresistance against steel failure (N s ):Ns As fu,a(2.53)in which:A s : is the tensile stress area <strong>of</strong> the anchor;f u,a : is the ultimate tensile strength <strong>of</strong> the anchor steel.
74 Chapter IIStrength <strong>of</strong> frame-to-foundation shear connections (F (F-F)V )The failure modes <strong>of</strong> shear connections include: shear failure in the anchor-to-frame connection (F (F-F)V,a-fr ); shear failure in the anchor-to-foundation connection (F (F-F)V,a-fo ).The strength <strong>of</strong> the shear frame-to-foundation connection (F (F-F)V ) is equalto the minimum shear strength related to the failure mode previously defined:F min F F(2.54)( F F) V( F F) V , afr;( F F) V , afoFAILURE IN THE ANCHOR-TO-FRAME CONNECTIONThe shear strength <strong>of</strong> the anchor-to-frame connection (F (F-F)V,a-fr ) may bycalculate following the approach illustrated for the determination <strong>of</strong> the shearfailure in the hold-down-to-frame connection.SHEAR FAILURE IN THE ANCHOR-TO-FOUNDATION CONNECTION.As for the tension failure in the hold-down-to-foundation connection, alsothe failure mode in the connections between anchor and foundation dependson the type <strong>of</strong> anchor, depth <strong>of</strong> embedment, concrete strength, edge distancesand spacing between anchors (Hilti 2001).For both mechanical and adhesive-bonded anchors the main failure modesunder shear loading are concrete edge failure and shear steel breakage, asshown in Figure 2.12.concrete edge breakoutsteel breakage failureFigure 2.12: Failure modes <strong>of</strong> anchors under shear loading (Hilti 2001).The shear strength <strong>of</strong> the anchor-to-foundation connection (F (F-F)V,a-fo ) isequal to the minimum shear strength associated to failure modes introduced,as defined by the following relation:F( F F ) V , a fo minVc; V s(2.55)
Design <strong>of</strong> cold-formed steel stud shear walls 75where:V c :V s :is the resistance against concrete edge failure;is the shear resistance <strong>of</strong> steel.The following relation may generally define the resistance against concreteedge failure (V c ): V r f(2.56)in which:V c,o :r V,se :f V,d :Vc c, o V , seV , dis the basic value <strong>of</strong> resistance against concrete edge failure, thatdepends on the type (AT) and diameter (d a ) <strong>of</strong> anchor, depth <strong>of</strong>embedment (d e ) and concrete strength (f ck ):V c,o =f(AT, d a , d e , f ck )is the anchor spacing and edge reduction factor, that depends ontype (AT) and diameter (d a ) <strong>of</strong> anchor, depth <strong>of</strong> embedment (d e ),anchor spacing (s) and edge distance (e):r N,s =f(AT, d a , d e , s, e)1is the loading direction factor, that depends on the direction <strong>of</strong>shear force ():f V,d =f()The shear resistance against <strong>of</strong> steel failure (V s ) may be generally obtainedby the following relation:Vs s As fu,a(2.57)in which: s : is a coefficient that depends on the steel strength grade <strong>of</strong> theanchor ( = 0.5 ÷ 0.6);A s : is the tensile stress area <strong>of</strong> the anchor;f u,a : is the ultimate tensile strength <strong>of</strong> the anchor steel.<strong>Shear</strong> strength <strong>of</strong> wall associated to frame-to-foundation connectionsstrength (v F-F )The shear strength per unit length associated to frame-to-foundationconnections strength (v F-F ) is the minimum value between shear strength per
76 Chapter IIunit length associated to tension (v (F-F)N ) and shear (v (F-F)V ) connectionsstrength:vF F minv( F F) N; v(F F) V(2.58)in which (v (F-F)N ) is obtained form strength <strong>of</strong> the frame-to-foundation tensionconnections (F (F-F)N ) as follows:F(F F) Nv(F F) N (2.59)hwith h height <strong>of</strong> the wall and (v (F-F)V ) is obtained form strength <strong>of</strong> the frameto-foundationshear connections (F (F-F)V ):v( F F) V n' F(F F) V(2.60)with n’ number <strong>of</strong> the end fasteners per unit length.2.3 UNITS SHEAR DESIGN VALUES FOR CFSSSWsThe basic LFRSs used in CFSSSWs currently recognized by main buildingCodes are: shear sheathing and diagonal bracings.For the sheathed CFSSSWs the Codes include wall sheathed with woodbasedstructural panels (plywood and oriented strand board (OSB)), sheetsteel, gypsum wallboard (GWB) and gypsum sheathing board (GSB). In thiscase design values are provided in the Codes.For diagonally braced CFSSSWs a rational set <strong>of</strong> design procedures withspecific force and drift limitations imposed for seismic event are presented inbuilding Codes.The nominal shear design values given by the main building Codes used inthe United States, such as 1997 Uniform Building Code (UBC 1997) and 2000International Building Code (IBC 2000), are illustrated and commented inSection 2.3.1. Furthermore, the provisions reported by the 2000 InternationalResidential Code for One- and Two-Family Dwelling (IRC 2000), for theapplication <strong>of</strong> the PSW method, are synthesized in the Section 2.3.2.2.3.1 UBC and IBC design tablesBuilding Codes make a distinction between design for wind and seismicloading. This distinction is based on the type <strong>of</strong> testing that has been used todevelop the design values for the shear strength. In fact, for all sheathed
Design <strong>of</strong> cold-formed steel stud shear walls 77CFSSSWs currently permitted in the 1997 UBC and 2000 IBC (plywood,OSB, sheet steel, GWB, GSB), tabulated design values are based exclusivelyon physical testing which included monotonic loading for wind design valuesand reversed cyclic loading for seismic design values.Testing for development <strong>of</strong> Code design values occurred in two phases(Serrette et al. 1996a, b and Serrette et al. 1997a, b). The results <strong>of</strong> the firstphase <strong>of</strong> testing were incorporated in the 1997 UBC and the results <strong>of</strong> thesecond phase <strong>of</strong> testing (combined with the results <strong>of</strong> the first phase) wereincorporated in the 2000 IBC.The typical test assembly in both phases <strong>of</strong> testing comprised 8ft.(2440mm) high walls having a width <strong>of</strong> 2ft. (610mm), 4ft. (1220mm) or 8ft.(2440mm) corresponding to aspect ratios (ratio <strong>of</strong> the wall height to width) <strong>of</strong>4:1, 2:1 and 1:1. For the 1997 UBC (the first phase <strong>of</strong> testing), all walls were4ft. (1220mm) wide except for gypsum sheathed walls that were 8ft.(2440mm) wide. The 2ft. (610mm) wide walls were part <strong>of</strong> the second phase<strong>of</strong> testing. For each test, the wall was anchored at both ends for overturningand between the ends for shear transfer. In the shear wall tests, the sheathingwas oriented parallel to framing (all edges blocked), except for the gypsumwallboard sheathing tests where the panels were installed perpendicular t<strong>of</strong>raming with strap blocking the abutting edges (see Chapter 3, Section 3.2.5for details).The typical results for the monotonic and reversed cyclic load tests, and theinterpretation <strong>of</strong> these test results, are illustrated in Figures 2.13 and 2.14,respectively.Using the measured wall response, as illustrated in Figures 2.13 and 2.14,the Code tabulated nominal design strengths for the wall configurations testedwere determined as follows.For wind designThe nominal wall strength was taken as the smallest <strong>of</strong> (see Fig. 2.13): 3.0 times the strength (averaging positive and negative values) at 0.5in.(12.7mm) <strong>of</strong> lateral displacement. the maximum strength (averaging positive and negative values) <strong>of</strong> thewall.
78 Chapter IIFor seismic designThe nominal wall strength was taken as the smallest <strong>of</strong> (see Fig. 2.14): 2.5 times the second loop envelope strength (averaging positive andnegative values) at 0.5in. (12.7mm) <strong>of</strong> displacement the maximum second loop envelope strength (averaging positive andnegative values).maximum loadload at 12.7mm lateral displacement12.7mm lateral displacementFigure 2.13: Monotonic shear load-lateral displacement response.+ max. stable load+ 2 nd lood envelopestable load at +12.7mm-12.7mm+12.7mmstable load at -12.7mm- 2 nd lood envelope- max. stable loadFigure 2.14: Reversed-cyclic shear load-lateral displacement response.
Design <strong>of</strong> cold-formed steel stud shear walls 79In both the 1997 UBC and 2000 IBC, design values are tabulated in terms<strong>of</strong> a nominal capacity (R n ). Allowable Stress Design (ASD) and Load andResistance Factor Design (LRFD) capacities are computed as:R n / for ASD (2.61) R n for LRFD (2.62)where is a safety factor and is a resistance factor.The tabulated design values for seismic design under the 1997 UBC and2000 IBC are reproduced in Tables 2.3 and 2.4, respectively. The tabulateddesign values for wind action are reproduced in Tables 2.5 and 2.6 for designunder the 1997 UBC and 2000 IBC, respectively. The safety and resistancefactors for the UBC and IBC are summarized in Table 2.7.Comparing the 2000 IBC tables with the 1997 UBC tables, it is evident thata larger number <strong>of</strong> design options is permitted by IBC. This difference, asindicated earlier, is the result <strong>of</strong> additional testing (second phase) that wascompleted after publication <strong>of</strong> the 1997 UBC.The seismic and wind design values in Tables 2.5 and 2.6 assume thatwalls are fully sheathed and hold down anchors are provided at each end <strong>of</strong>the wall as required by calculation. All panel edges are assumed to be blockedfor the shear wall applications. Some monotonic test data has shown that oneunblocked edge may reduce the fully-blocked capacity by about 50%, asshown in Chapter 3 (Section 3.2.1).No. 8 screws = 4.2 mm nominal diameter screwsTable 2.3: 1997 UBC nominal shear strength (R n ) values for seismic actions (lbs./foot).
80 Chapter IINo. 8 screws = 4.2 mm nominal diameter screwsTable 2.4: 2000 IBC nominal shear strength (R n ) values for seismic actions (lbs./foot).No. 8 screws = 4.2 mm nominal diameter screwsTable 2.5a: 1997 UBC nominal shear strength (R n ) values for wind actions (lbs./foot).
Design <strong>of</strong> cold-formed steel stud shear walls 81Table 2.5b: 1997 UBC nominal shear strength (R n ) values for wind actions (lbs./foot).No. 8 screws = 4.2 mm nominal diameter screwsTable 2.6a: 2000 IBC nominal shear strength (R n ) values for wind actions (lbs./foot).
82 Chapter IITable 2.6b: 2000 IBC nominal shear strength (R n ) values for wind actions (lbs./foot).Table 2.7: Safety and resistance factors per 1997 UBC and 2000 IBC.Following the Serrette’s comments regarding the tabulated design values itis possible to extrapolate <strong>of</strong> the Code design values in a rational manner thatmeets the intent and overall safety implied by the Code.Serrette specifies that some unpublished data show that for walls with thesame material on both sides (and identically attached) the shear values listedin the tables may be doubled. Although these conclusions are encouraging,additional testing is needed to verify performance. As a provisional measure,the Author suggests that it may be adequate to use only 90% <strong>of</strong> the doubledvalue with special attention given to the design <strong>of</strong> the chords and anchorage <strong>of</strong>the wall.Both the 1997 UBC and 2000 IBC Codes for gypsum board suggest thatsheathings should be applied perpendicular to framing with strap blockingadjacent to panel edges and solid block in the end bays. This limitation isbased on the configuration used in the testing for development <strong>of</strong> the Code
Design <strong>of</strong> cold-formed steel stud shear walls 83values. Serrette indicates that the behavior <strong>of</strong> a shear wall suggests that itwould be rational and safe to allow the use <strong>of</strong> the Code values for gypsumboard applied parallel to framing provided that all edges are, as required,blocked.For gypsum board shear walls, the Codes require the use <strong>of</strong> both flat strapand solid end bay blocks at abutting panel edges (when the abutting edge doesnot occur at a stud). Serrette reports that, because <strong>of</strong> the mechanism <strong>of</strong> loadtransfer at the abutting panel edge, solid-blocked end bays are not structurallynecessary for the shear wall application. Moreover He notes that solidblocking may be required to avoid global buckling <strong>of</strong> studs.2.3.2 IRC provisions on the PSW method utilizationIn addition to the design data provide in the UBC and IBC, some basicresearch has been conducted on perforated CFSSSWs. Based on this research,the 2000 IRC (IRC 2000) permits the seismic capacity <strong>of</strong> long walls withopenings to be computed on the basis <strong>of</strong> PSW method. The IRC provision islimited to structures located in zones characterized by relatively low seismicintensity. For applying the PSW method, the maximum aspect ratio <strong>of</strong> all fullheight sheathed segments between openings must be 2:1, including the endsegments <strong>of</strong> the wall. Therefore, the maximum unrestrained opening heightmust respect the limits indicated in IRC provision (see Table 2.8). The values<strong>of</strong> the ratio <strong>of</strong> the strength <strong>of</strong> a shear wall with openings to the strength <strong>of</strong> afully sheathed shear wall without openings (F) reported by IRC are shown inTable 2.9. According to the PSW approach, the value <strong>of</strong> the adjustment factor(F) depends on sheathing area ratio (r).1 feet = 305 mmTable 2.8: Maximum unrestrained opening height (H) per 2000 IRC.
84 Chapter IITable 2.9: Adjustment factors (F) for application <strong>of</strong> the PSW method per 2000 IRC.REFERENCESAISI (1986) AISI Specification for the design <strong>of</strong> <strong>Cold</strong>-<strong>Formed</strong> <strong>Steel</strong> structuralmembers. AISI (American Iron and <strong>Steel</strong> Institute). Washington DC.AISI (1996) <strong>Cold</strong>-<strong>Formed</strong> <strong>Steel</strong> Design manual. AISI (American Iron and <strong>Steel</strong>Institute). Washington DC.AISI (2001) North American Specification for the design <strong>of</strong> <strong>Cold</strong>-<strong>Formed</strong> <strong>Steel</strong>structural members (November 9, 2001 draft edition). AISI (American Iron and <strong>Steel</strong>Institute), Washington DC.Ambrose, J. & Dimitry, V. (1987) Design for Lateral Forces. John Wiley & Sons,Inc. New York.APA (1996) Use Panel Supplement. APA (The Engineered Wood Association).Tacoma, WA, USA.AS/NZS 4600 (1996) <strong>Cold</strong>-formed steel structures. AS/NZS (AustralianStandards/New Zealand Standards). Sydney.Apparao, T.V.S., Errera, S.J., Fischer, G.P. (1969) Columns braced by girts anddiaphragm. Journal <strong>of</strong> structural Division. ASCE, Vol.95:965-990Batista, E.M. (1988) Etude de la stabilité des pr<strong>of</strong>iles à parois minces et sectionsouverte de type U et C. Ph.D. Thesis, University <strong>of</strong> Liege. Liege.Beyer, D.E. (1993) Design <strong>of</strong> Wood Structures, Third Edition. McGraw-Hill, Inc.New York.CU-FSM (2003) http://www.ce.jhu.edu/bschafer/cufsm/index.htm. (UpgradedAugust 2003)Davies, J.M. & Leach, P. (1994a) First-order generalised beam theory. Journal <strong>of</strong>construction steel research. Elsevier, Vol.31.
Design <strong>of</strong> cold-formed steel stud shear walls 85Davies, J.M. & Leach, P. (1994b) Second-order generalised beam theory. Journal <strong>of</strong>construction steel research. Elsevier, Vol.31.Della Corte, G., De Martino, A., Fiorino, L., Landolfo, R. (2003) Numericalmodeling <strong>of</strong> thin-walled cold-formed steel C-sections in bending. In Proceedings <strong>of</strong>the Advances in Structures <strong>Steel</strong>, Concrete, Composite and Aluminum (ASSCCA'03).Sydney.Dolan, J.D. & Heine, C.P. (1997a) Monotonic Tests <strong>of</strong> Wood-frame <strong>Shear</strong> <strong>Walls</strong> withVarious Opening and Base Restraint Conditions. Report TE-1997-001, Brooks ForestProducts Research Center, Virginia Polytechnic Institute and State University.Blacksburg, VA, USA.Dolan, J.D. & Heine, C.P. (1997b) Sequential Phased Displacement Cyclic Tests <strong>of</strong>Wood-frame <strong>Shear</strong> <strong>Walls</strong> with Various Opening and Base Restraint Conditions.Report TE-1997-002, Brooks Forest Products Research Center, Virginia PolytechnicInstitute and State University. Blacksburg, VA, USA.Dolan, J.D. & Heine, C.P. (1997.) Sequential Phased Displacement Tests <strong>of</strong> Woodframed<strong>Shear</strong> <strong>Walls</strong> with Corners. Report TE-1997-003, Brooks Forest ProductsResearch Center, Virginia Polytechnic Institute and State University. Blacksburg,VA, USA.Dolan, J.D. & Johnson, A.C. (1997a) Monotonic Tests <strong>of</strong> Long <strong>Shear</strong> <strong>Walls</strong> withOpenings. Report TE-1996-001, Brooks Forest Products Research Center, VirginiaPolytechnic Institute and State University. Blacksburg, VA, USA.Dolan, J.D. & Johnson, A.C. (1997b) Cyclic Tests <strong>of</strong> Long <strong>Shear</strong> <strong>Walls</strong> withOpenings. Report TE-1996-002, Brooks Forest Products Research Center, VirginiaPolytechnic Institute and State University. Blacksburg, VA, USA.Easley, J.T., Foomani, M., Dodds, R.H. (1982) Formulas for wood shear walls.Journal <strong>of</strong> structural Division. ASCE, Vol.105, No.11:2460-2478.Errera, S.J. & Apparao, T.V.S.R. (1976) Design <strong>of</strong> I-shaped columns with diaphragmbracing. Journal <strong>of</strong> structural Division. ASCE, Vol.102.Errera, S.J., Pincus, G., Fischer, G.P. (1967) Columns and beams braced bydiaphragms. Journal <strong>of</strong> Structural Division. ASCE, Vol.93:295-318.ENV 1993-1-3 (1996) Eurocode 3: Design <strong>of</strong> steel structures – Part 1-3: Generalrules - Supplementary rules for cold formed thin gauge members and sheeting. CEN(European Committee for Standardization). Bruxelles.Faherty, K.F. & Williamson, T.G. (1999) Wood Engineering and constructionhandbook (Third edition). McGraw-Hill.
86 Chapter IIFiorino, L. (2000) Il metodo “direct strength” per il progetto di pr<strong>of</strong>ili “coldformed”in acciaio (Tesi di Laurea). Dipartimento di Analisi e ProgettazioneStrutturale, Facoltà di Ingegneria, Università di Napoli “Federico II”. Napoli.Fiorino, L. & Landolfo, R. (2001). Il metodo “direct strength” per la progettazione dimembrature in parete sottile formate a freddo in acciaio. In Proceedings <strong>of</strong> the XVIIICongresso CTA (CTA 2001), Vol.2. Venezia.Fiorino, L. & Landolfo, R. (2003) Il ruolo delle imperfezioni geometriche nellacalibrazione di modelli agli elementi finiti per pr<strong>of</strong>ili sottili inflessi con sezione a Cformata a freddo. In Proceedings <strong>of</strong> the XIX Congresso CTA (CTA 2003). Genova.Hancock, G,J. (1985) Distortional buckling <strong>of</strong> storage rack columns. Journal <strong>of</strong>structural engineering. ASCE, Vol.111, No.12:2770-2783.Hilti (2001) Hilti North America product technical guide.Hoyle, R.J., Jr. & Woeste, F.E. (1986) Wood Technology in the Design <strong>of</strong> Structures,Fifth Edition. Iowa State University Press. Ames, IA, USA.IBC (2000) International Building Code: 2000. International Code Council, Inc. FallsChurch, VA, USA.IRC (2000) International Residential Code for One- and Two-Family Dwelling:2000. International Code Council, Inc. Falls Church, VA, USA.Landolfo, R., Di Lorenzo, G, Fiorino, L. (2002) Attualità e prospettive dei sistemicostruttivi cold-formed. Costruzioni metalliche No.1Lau, S.C.W. & Hancock, G.J. (1987) Distortional buckling formulas for channelcolumns. Journal <strong>of</strong> structural engineering. ASCE, Vol.113, No.5.Lee, Y. & Miller, T.H. (2001a) Axial strength determination for gypsum-sheathed,cold-formed steel wall stud composite panels. Journal <strong>of</strong> structural engineering.ASCE, Vol.127, No.6:608-615.Lee, Y. & Miller, T.H. (2001b) Limiting heights for gypsum-sheathed, cold-formedsteel wall studs. Practice periodical on structural design and construction. ASCE,Vol.6, No.2:83-89.Miller, T.H. & Peköz, T. (1993) <strong>Behavior</strong> <strong>of</strong> cold-formed steel wall stud assemblies.Journal <strong>of</strong> structural engineering. ASCE, Vol.119, No.2:641-651.Miller, T.H. & Peköz, T. (1994) <strong>Behavior</strong> <strong>of</strong> gypsum-sheathed cold-formed steel wallstuds. Journal <strong>of</strong> structural engineering. ASCE, Vol.120, No.5:1644-1650.NAHB Research Center (1997) Monotonic Tests <strong>of</strong> cold-formed steel shear wallswith openings. NAHB (National Association <strong>of</strong> Home Builders). Upper Marlboro,MD, USA.
Design <strong>of</strong> cold-formed steel stud shear walls 87NAHB Research Center (1998) The Performance <strong>of</strong> Perforated <strong>Shear</strong> <strong>Walls</strong> withNarrow Wall Segments, Reduced Base Restraint, and Alternative Framing Methods.NAHB (National Association <strong>of</strong> Home Builders). Upper Marlboro, MD, USA.Pincus, G. & Fischer, G.P. (1966) <strong>Behavior</strong> <strong>of</strong> diaphragm-braced columns andbeams. Journal <strong>of</strong> Structural Division. ASCE, Vol.92:323-350.prEN 1998-1 (2001) Eurocode 8: Design <strong>of</strong> structures for earthquake resistance –Part 1: General rules – <strong>Seismic</strong> actions and rules for buildings. CEN (EuropeanCommittee for Standardization). Bruxelles.Schafer, B.W. (2001) Thin-walled column design considering local, distorsional andEuler buckling. Proceedings <strong>of</strong> the Structural Stability Research Council, AnnualTechnical Session and Meeting.Schafer B.W. & Peköz T. (1998). Direct strength prediction <strong>of</strong> cold-formed steelmembers using numerical elastic buckling solution. In Proceedings <strong>of</strong> the 2thInternational conference on thin-walled structures. Singapore.Schafer, B.W. & Peköz T. (1999) Local distortional buckling <strong>of</strong> cold-formed steelmembers with edge stiffened flanges. In Proceedings <strong>of</strong> the 4th Internationalconference on steel and aluminium structures (ICSAS ’99). Helsinki.Schafer, B.W. & Hiriyur, B. (2002) Analysis <strong>of</strong> sheathed cold-formed steel wallstuds. In Proceedings <strong>of</strong> the 16 th International Specialty Conference on <strong>Cold</strong>-formed<strong>Steel</strong> Structures. St. Louis, MO, USA:501-513.Serrette, R., Nguyen, H., Hall, G. (1996a) <strong>Shear</strong> wall values for light weight steelframing. Report No. LGSRG-3-96, Light Gauge <strong>Steel</strong> Research Group, Department<strong>of</strong> Civil Engineering, Santa Clara University. Santa Clara, CA, USA.Serrette, R., Hall, G., Nguyen, H. (1996b) Dynamic performance <strong>of</strong> light gauge steelframed shear walls. In Proceedings <strong>of</strong> the 13 th International Specialty Conference on<strong>Cold</strong>-formed <strong>Steel</strong> Structures. St. Louis, MO, USA:487-498.Serrette, R.L., Encalada, J., Juadines, M., Nguyen, H. (1997a) Static racking behavior<strong>of</strong> plywood, OSB, gypsum, and fiberboard walls with metal framing. Journal <strong>of</strong>Structural Engineering. ASCE, Vol.123, No.8:1079-1086.Serrette, R., Encalada, J., Matchen, B., Nguyen, H., Williams, A. (1997b) Additionalshear wall values for light weight steel framing. Report No. LGSRG-1-97, LightGauge <strong>Steel</strong> Research Group, Department <strong>of</strong> Civil Engineering, Santa ClaraUniversity. Santa Clara, CA, USA.Simaan, A. & Peköz, T. (1976) Diaphragm braced members and design <strong>of</strong> wall stud.Journal <strong>of</strong> structural Division. ASCE, Vol.102.
88 Chapter IISSTD 10-97 (1997) Standard for Hurricane Resistant Residential Construction.Southern Building Code Congress International, Inc. Birmingham, AL, USA.Sugiyama, H & Matsumoto, T. (1984) Empirical equations for the estimation <strong>of</strong>racking strength <strong>of</strong> plywood-sheathed shear walls with openings. Summaries <strong>of</strong>Technical Papers <strong>of</strong> Annual Meeting, Transactions <strong>of</strong> the Architectural Institute <strong>of</strong>Japan, No.338.Talue, Y. & Mahendran, M. (2000) Behaviour <strong>of</strong> cold-formed steel wall frames linedwith plasterboard. Journal <strong>of</strong> constructional steel research. Elsevier. Vol.57:435-452.THIN-WALL (2003) http://www.civil.usyd.edu.au/case/thinwall.php. (UpgradedAugust 2003)UBC (1997) Uniform Building Code: Volume 2. International Conference <strong>of</strong> BuildingOfficials. Whittier, CA. USA.Yu, W.W. (2000) <strong>Cold</strong> <strong>Formed</strong> Design (3rd Edition), John Wiley & Sons. NewYork.
89Chapter IIITesting <strong>of</strong> cold-formed steel stud shearwalls: review <strong>of</strong> existing literatureA large number <strong>of</strong> experimental research programs have been performed tostudy the structural behavior <strong>of</strong> cold-formed steel stud shear walls (CFSSSW)laterally braced with sheathings and/or with diagonal steel straps (McCreless& Tarpy 1978, Tarpy & Hauenstein 1978, Tarpy 1980, Tarpy & Girard 1982,Tissell 1993, Serrette 1994, Serrette & Ogunfunmi 1996, Serrette et al. 1996a,b, 1997a, b, NAHB Research Center 1997, Gad et al. 1999a, b, Selenikovichet al. 1999, COLA-UCI 2001, Dubina & Fulop 2002, Branston et al. 2003).This Chapter contains a review <strong>of</strong> the main tests concerning the structuralbehavior <strong>of</strong> CFSSSW carried out in Northern America, Europe and Australia.The main goal <strong>of</strong> the review has been to investigate the influence <strong>of</strong> the basicparameters on the lateral behavior <strong>of</strong> CFSSSW.The Chapter is organized in two main parts. In the first part (Section 3.1) asummary <strong>of</strong> the main existing test results is presented. The individuation <strong>of</strong>basic factors that influence the lateral load response <strong>of</strong> CFSSSWs and theanalysis <strong>of</strong> their influence are illustrated in the second part (Section 3.2).3.1 SUMMARY OF MAIN EXISTING TEST PROGRAMSA summary <strong>of</strong> the main research programs regarding the testing <strong>of</strong>CFSSSW carried out in Northern America, Europe and Australia is describedin this Section. A general listing <strong>of</strong> the tests presented in this Section is
90 Chapter IIIreported in Table 3.1. A more complete listing <strong>of</strong> the test data is given inAppendix A.Author No <strong>of</strong> tests Bracing systemsMcCreless & Tarpy (1978) NA 16 M GWBTarpy & Hauenstein (1978) NA 18 M GWBTarpy (1980) NA 4 M , 8 C GWB, CPTarpy & Girard (1982) NA 14 M GWB, PLYTissell (1993) NA 8 M OSB, PLYSerrette (1994) NA 12 M GWB, GSB, OSB, PLY, X-BSerrette & Ogunfunmi (1996) NA 13 M GSB, GWB, X-BSerrette et al. (1996a, b) NA 24 M , 16 C GWB, OSB, PLYSerrette et al. (1997a) NA 33 M GWB, FBW, OSB, PLYSerrette et al. (1997b) NA 16 M , 28 C OSB, PLY, SSS, X-BNAHB Research Center (1997) NA 4 M OSB, GWBGad et al. (1999a, b) AX-BSelenikovich et al. (1999) NA 6 M , 10 C OSB, GWBCOLA-UCI (2001) NA 18 C OSB, PLYDubina & Fulop (2002) E 7 M , 9 C SCS, GWB, OSBBranston et al. (2003) NA 6 M , 6 C OSB, PLYNA : North American tests; A : Australian tests; E : European testsM : monotonic tests; C : cyclic testsCP: cement plaster; FBW: FiberBond wallboard; GSB: gypsum sheathing board; GWB: gypsumwallboard; OSB: oriented strand board; PLY: plywood; SCS: steel corrugated sheet; SSS: steelsheet sheathing; X-B: steel flat strap X-bracingTable 3.1: Listing <strong>of</strong> tests <strong>of</strong> CFSSSW.3.1.1 McCreless & Tarpy (1978)This experimental research consisted <strong>of</strong> the testing <strong>of</strong> sixteen shear wallsmade <strong>of</strong> steel studs and gypsum wallboard (GWB) with various aspect ratiosunder monotonic loads. The tests were carried out in accordance with ASTME 564-76 (1976). The wall construction used was representative <strong>of</strong> the type <strong>of</strong>construction usually used for internal wall partitions.The objectives <strong>of</strong> the testing program were: To determine the variation <strong>of</strong> the shear strength when the aspect ratio(height/width) changing from 0.33 (2440/7320mm) to 2 (3660/3660). To establish the allowable degree <strong>of</strong> panel distortion before major wallpanel damage.
Testing <strong>of</strong> cold-formed steel stud shear walls: review <strong>of</strong> existing literature 91 To determine if the addition <strong>of</strong> a single horizontal stiffener located atmid-height in the plane <strong>of</strong> the wall could improve the shear behavior.The wall sizes <strong>of</strong> specimens were 3660x3660mm, 3660x4880mm,3660x7320mm, 3050x3660mm, 3050x4880mm, 3050x7320mm,2440x2440mm, 2440x3660mm, 2440x4880mm and 2440x7320mm (height xlength) with aspect ratios that ranges from 0.33 to 1.00. Each wall wasassembled with 89x0.84mm (web depth x thickness) C (lipped)-sections studsspaced at 610mm on center. Double back-to-back coupled studs were used atends <strong>of</strong> each wall. The studs were attached to 92x38x0.84mm (web depth xflange size x thickness) U (unlipped)-sections track with 4.8x13mm (diameterx length) low pr<strong>of</strong>ile head screws. GWB, 12.7mm thick, was attached to bothsides <strong>of</strong> the stud assembly with 3.5x25mm bugle head screws spaced at305mm at the perimeter and in the field <strong>of</strong> the panel. Clip angles were used toanchor the specimens to the load frame.The Authors observed that for shorter walls bending deformationdominated. In this case, the bottom track deformed around the exterior cornertension anchorage point and then the screws in tension corner rotated throughthe GWB, followed by cracking separation <strong>of</strong> the wallboard. The final failurewas due to excessive rotation. For longer walls, where the shear deformationcontrolled the behavior, the edge screws rotated through the panel and thefinal failure was produced by the stud framing shearing through the GWBalong the top.McCreless & Tarpy concluded from the test results that: For the aspect ratio varying between 0.33 and 1.00 the shear strengthwas constant but the shear stiffness decreased; The first noticeable wallboard damage occurred at about 6 to 13mmtotal displacement (for the shorter walls) and at about 6mm (for thelonger walls). The real damage occurred at about 13 to 19mm totaldisplacement (for the shorter walls) and at about 6 to 13mm (for thelonger walls).
92 Chapter III3.1.2 Tarpy & Hauenstein (1978)The testing program performed by Tarpy & Hauenstein included eighteenfull-scale walls made <strong>of</strong> steel studs and GWB with seven different types <strong>of</strong>wall panel construction and anchorage details.The main objectives <strong>of</strong> the experimental research were: To determine the effect <strong>of</strong> different construction and anchorage detailson shear resistance <strong>of</strong> stud shear walls. To evaluate the damage thresholds load levels. To provide a comparison between the performances <strong>of</strong> wood-framedand steel-framed shear walls.One wall type consisted <strong>of</strong> 51x102mm (width x depth) wood-studs, whileothers were constructed using 89x38x0.81mm (web depth x flange size xthickness) C-sections studs spaced at 610mm on center. GWB, 12.7mm thick,placed in horizontal position was attached to both sides <strong>of</strong> the specimens. Thefasteners to connect the panels to the steel frame were 3.5x25mm (diameter xlength) bugle head screws whereas to connect the panels to the wood frame35mm annular head nails were used.The Authors observed from the test results that: For avoiding uplift failure an adequate attachment should be adoptedto connect the track and floor framing systems. The reduction <strong>of</strong> the fasteners spacing around the wall perimeter couldprovide higher shear strength. For design purposes, a safety factor <strong>of</strong> 2.0 was recommended fordesign purposes to ensure that the design load level does not exceedthe damage threshold level.3.1.3 Tarpy (1980)Nine different types <strong>of</strong> GWB and cement plaster (CP) attached to lightgauge steel stud were tested under monotonic and cyclic loading protocol byTarpy. The tests were carried out in accordance with ASTM E 564-76 (1976)
Testing <strong>of</strong> cold-formed steel stud shear walls: review <strong>of</strong> existing literature 93The main test objectives were: To investigate the behavior <strong>of</strong> the different sheathing types. To study the effect <strong>of</strong> GWB fasteners spacing. To determine the effect <strong>of</strong> cyclic loading versus monotonic loading onthe shear behavior. To analyze the behavior <strong>of</strong> different construction techniques andanchorage details. To establish the thresholds for damage <strong>of</strong> the walls due to lateraldisplacement. To study the contribution to shear capacity <strong>of</strong> a 45° stud placed at thebottom corner between the chord members and the adjacent stud.The wall sizes <strong>of</strong> specimens were 2440x2440mm or 2440x3660mm (heightx length). The frame was made using 89x38x13x0.84mm (web depth x flangesize x lip size x thickness) C (lipped)-sections studs at 610mm on center. Thestuds, with a mean yield strength <strong>of</strong> 331MPa, were attached to 92x38x0.84mmU-sections track with 4.8x13mm (diameter x length) low pr<strong>of</strong>ile head screws.GWB, 12.7mm thick and 22.2mm thick CP placed in vertical position wasconnected to the frame using different fastener type and spacing. In particular,the following fastener type and spacing were used: 3.5x25mm bugle headscrews spaced at 305mm; 3.5x25mm bugle head screws spaced at 610mm;3.5x25mm bugle head screws spaced at 152/305mm (perimeter/field);3.5x13mm pan washer head screws spaced at 197mm; 3.5x10mm bugle headscrews spaced at 305mm.Tarpy concluded from the test results that: The use <strong>of</strong> CP increased the shear strength and the stiffness. The use <strong>of</strong> two layer <strong>of</strong> GWB increased the shear capacity, whiledecreasing the shear stiffness, in comparison with single layer. The reduction <strong>of</strong> the fastener spacing increased the shear strength andstiffness. Cyclic load decreases shear strength and damage threshold level. The corner anchorage influenced the shear behavior dramatically.Hold-down exhibited higher shear strength than bolt and washer
94 Chapter IIIanchors. Densely spaced powder actuated fasteners (connected to asupporting concrete beam) provided similar restraint to the hold-down. The shear resistance did not vary extensively when using differenttypes <strong>of</strong> interior shear anchorage. The use <strong>of</strong> a 45° stud placed at the bottom corner between the chordmembers and the adjacent stud had little effect on the shear capacity.3.1.4 Tarpy & Girard (1982)The study <strong>of</strong> Tarpy & Girard was performed in response to a need todevelop design criteria for steel stud sear wall panels with differentconstruction details and sheathing materials. The materials used for thesheathings were GWB, gypsum sheathing board (GSB) and plywood (PLY).The experimental program was based on the testing <strong>of</strong> fourteen specimensunder monotonic load following the requirements <strong>of</strong> ASTM E 564-76 (1976).The objectives <strong>of</strong> the research were: To determine the effect <strong>of</strong> different construction techniques andanchorage details on the shear resistance <strong>of</strong> stud shear walls withdifferent types <strong>of</strong> sheathing. In particular, the parameters examinedwere: The effect <strong>of</strong> using light gage clip angles and powder-actuatedfasteners in place <strong>of</strong> bolts and washers to anchor the base <strong>of</strong> thewall and the effect <strong>of</strong> anchoring the wall through transverse floorjoists. The effect <strong>of</strong> PLY or gypsum exterior sheathing in place <strong>of</strong> GWB. The effect <strong>of</strong> using fillet welds instead <strong>of</strong> self drilling screws toattach the studs to the tracks. The effect <strong>of</strong> using a 406mm rather a 610mm stud spacing. To establish the thresholds for damage <strong>of</strong> the walls due to lateraldisplacement.All wall sizes were 2440x2440mm (height x length), except for onespecimen that had a wall size <strong>of</strong> 2440x3660mm. The stud wall systems wereconstructed using 89x25x13x0.84mm C-sections studs attached to92x38x0.84mm U-sections track. Double back-to-back coupled studs were
Testing <strong>of</strong> cold-formed steel stud shear walls: review <strong>of</strong> existing literature 95employed at the ends <strong>of</strong> each wall. GWB, 12.7mm thick, was attached to bothsides <strong>of</strong> the specimens, except for two specimens, that had GWB as internalpanel and PLY (12.7mm thick) or GSB (12.7mm thick), respectively, asexterior panels. The sheathing orientation was always horizontal. All panelswere connected to the frame with 3.5x25mm (diameter x length) bugle headscrews spaced at 305mm at the perimeter and in the field <strong>of</strong> the panel. Clipangles fixed with bolts or powder-actuated fasteners were used to connect thebase <strong>of</strong> some walls.Tarpy & Girard noted that all wall types had the same basic failure mode.The bottom track deformed around the anchorage device at the uplift corner <strong>of</strong>the wall and the cracking <strong>of</strong> the GWB happened at the same locations fromthe corner fasteners to the edge <strong>of</strong> the panel.They concluded that: When the bolt and washer anchorage details were used without clipangles the shear capacity decreased. Moreover, the use <strong>of</strong> closelyspaced powder actuated fasteners negligibly increased the shearbehavior in comparison to using corner clips. When the wall wasanchored through the floor joist it showed lower shear capacity thanwhen it was connected directly to the test frame. Therefore, it wassuggested a rigid attachment to connect the wall panel to the floor orro<strong>of</strong> framing systems and it was recommended the use <strong>of</strong> clip angles. The use <strong>of</strong> PLY increased the shear strength whereas the use <strong>of</strong> GSBdecreased it in comparison with the employ <strong>of</strong> GWB. The use <strong>of</strong> welded stud to track connections provided the same shearstrength as screw connections. The reduction <strong>of</strong> the stud spacing did not increase significantly theshear strength and stiffness. For design purposes, a safety factor <strong>of</strong> 2.0 was recommended todetermine the design shear strength from the ultimate shear strengthfor the type <strong>of</strong> stud shear walls examined.
96 Chapter III3.1.5 Tissell (1993)Tissell conducted for the American Plywood Association eight monotonicloading tests on walls that were sheathed with either oriented strand board(OSB) or PLY and that had various frame thicknesses.The tests were carried out to achieve the principal following goals: To examine the effect <strong>of</strong> fasteners size and spacing. To study the influence <strong>of</strong> frame thickness.All wall sizes were 2440x2440mm (height x length). The frame was madeusing 64x41x1.88mm (web depth x flange size x thickness) C-sections studsat 610mm on center attached to 64x41x1.88mm U-sections track for thespecimens 1, 7 and 8. The frame used for other specimens were made using89x41x1.50 studs at 610mm on center attached to 89x41x1.50 track(specimens 2 and 3) and 89x41x1.19 studs at 610mm on center attached to89x41x1.19 track (specimens 4, 5 and 6).Fasteners types were 4.2mm diameter screws for the 1.19mm framethickness and 4.8mm diameter screws or 3.7mm diameter pins for the 1.50and 1.88mm frame thickness. Different fasteners schedule was used. In fact,the edge fasteners spacing varied form 76 to 152mm while the field fastenersspacing was 305mm.The different sheathing types for tests included 9.5mm thick PLY(specimens 1, 2, 4 and 5), 15.9mm thick PLY (specimen 8), 11.1mm thickOSB (specimens 3 and 6) and 15.1mm thick OSB (specimen 7). The sheathingorientation was vertical in each case.The Author reported that in most cases failure occurred due to buckling <strong>of</strong>the single end studs or the bottom track at the anchor bolts. These prematurecollapses prevented the full development <strong>of</strong> the shear capacity <strong>of</strong> the panels.For this reason the test results did not <strong>of</strong>fer a correct valuation <strong>of</strong> the behavior<strong>of</strong> the sheathing panels.
Testing <strong>of</strong> cold-formed steel stud shear walls: review <strong>of</strong> existing literature 973.1.6 Serrette (1994)This experimental program consisted <strong>of</strong> the monotonic load testing <strong>of</strong>twelve CFSSSW. The walls were laterally braced with 51x0.84mm (width xthickness) X-bracing steel flat strap (X-B) on one side only (specimen 1),12.7mm thick GWB on both sides (specimen 2), 12.7mm thick GWB and12.7mm thick GSB in combination with X-B (specimen 3), 11.9mm thickPLY (specimens from 4 to 8) or 11.1mm thick OSB (specimens from 9 to 12)on one side only. All sheathings were vertically oriented, except for specimens6 and 7 that had sheathings horizontally oriented.The 2440mm by 2440mm steel frame was identical for all walls. The framewas made using 152x41x0.84mm (web depth x flange size x thickness) C-sections studs at 610mm on center attached to 152x32x0.84mm U-sectionstrack. Double back-to-back coupled studs were used at ends <strong>of</strong> walls.The panels to frame connections were 3.5mm diameter screws forspecimens 2, 3, 4, and 12; 4.2mm diameter screws for the specimens 6, 7, 8and 11; and 2.9mm diameter pins for the specimens 5 and 9. All fastenerswere spaced at 152mm at the perimeter and at 305mm in the field.From the tests results, it is possible to conclude that: The PLY panels carried slightly higher loads in comparison with OSBpanels. The use <strong>of</strong> 2.9mm diameter pins decreased the maximum shearstrength in comparison with 3.5 and 4.2mm diameter screws. The walls with panels oriented vertically and with blocked panelsoriented horizontally provided essentially the same shear strength. When blocking is omitted for the walls with horizontal panels, theshear capacity <strong>of</strong> the wall was reduced by more than 50%.3.1.7 Serrette & Ogunfunmi (1996)A series <strong>of</strong> monotonic loading tests were conducted by Serrette &Ogunfunmi on 13 walls. These tests included three different shear resistingsystems: framed walls with X-B (type A); framed walls with GSB on the faceand GWB on the back (type B); and framed walls with GSB and X-B on theface and GWB on the back (type C).
98 Chapter IIIThe main objectives <strong>of</strong> the investigation were: To study the contribution <strong>of</strong> X-B, GSB and GWB, and thecombination <strong>of</strong> X-B, GSB, GWB to the in-plane shear resistance <strong>of</strong>steel stud walls.The 2440mm by 2440mm steel frame was identical for all walls. The framewas made using 152x32x0.84mm (web depth x flange size x thickness) C-sections studs at 610mm on center attached to 152x0.84mm (web depth xthickness) U-sections track. At the ends <strong>of</strong> each wall, double back-to-backcoupled studs were used to avoid chord buckling. The fasteners used for theframe connections were 4.2x13mm (diameter x length) wafer-head screws.Clip angles were used to connect each wall specimen to the base <strong>of</strong> the testframe.The different shear resisting systems included: Type A: framed walls with 51x0.84mm (width x thickness) X-B on theface. The straps were attached to the frame using gusset connectionsthat were designed for the yield strength <strong>of</strong> the strap. Type B: framed walls with 12.7mm thick GSB on the face and12.7mm thick GWB on the back. The gypsum panels were orientatedvertically and were attached to the frame using 3.5x25mm bugle headscrews spaced at 152mm at the perimeter and at 305mm in the field. Type C: framed walls with both Type A and B shear resisting systems.All specimens were raised with GSB and X-B on the face and GWBon the back except for one specimen that was built with X-B on bothsides.The Authors reported that for type A walls, failure resulted from excessivelateral deflections that followed the yielding <strong>of</strong> the tension X-B. For type Band C walls, at approximately half <strong>of</strong> the maximum load, screw rotationoccurred at the perimeter edge, and at the maximum load, the paper along theedges <strong>of</strong> the panels broke at the locations <strong>of</strong> the screws. Type B wallsprovided about 2.1 times the maximum load <strong>of</strong> type A walls, type C wallswith one X-B on one side increased the maximum load by approximately 1.3
Testing <strong>of</strong> cold-formed steel stud shear walls: review <strong>of</strong> existing literature 99times over type B walls, and type C wall with X-B on both sides amplified themaximum load by about 1.8 times in comparison with type B walls.Serrette & Ogunfunmi concluded that: The use <strong>of</strong> X-B plus gypsum board reduced the permanent deflection<strong>of</strong> the wall and increased the shear strength without decreasing thestiffness. The use <strong>of</strong> X-B plus gypsum board is not practical due to the need topretension the straps and the need for additional screws to connect thestraps.3.1.8 Serrette et al. (1996a,b)Serrette conducted twenty-four monotonic loading tests and sixteen cyclicloading tests on walls with various sheathing types. All specimens weresheathed with OSB or PLY on a side, except for 10 specimens <strong>of</strong> themonotonic tests that were sheathed with OSB on a side and GWB on the otherside or with GWB on both sides. The tests were planned to generate designdata for specific wall constructions and also answer certain fundamentaldesign questions.The monotonic test program was divided in two phases with differentobjectives.The first phase included walls sheathing on one side only and wasaddressed to the following issues: To compare the differences in the behavior <strong>of</strong> OSB and PLY. To examine the effect on the shear strength <strong>of</strong> a variation <strong>of</strong> the aspectratio (height/width) from 1 (2440/2440) to 2 (2440/1220). To examine the effect <strong>of</strong> dense fasteners schedules.The second phase consisted <strong>of</strong> walls sheathing on both sides and wasaddressed to the following questions: To study the behavior <strong>of</strong> walls with OSB on a side and GWB on theother. To study the behavior <strong>of</strong> walls with GWB on both sides.The objectives <strong>of</strong> cyclic test program were the followings:
100 Chapter III To determine the relative strength <strong>of</strong> walls with OSB and with PLY. To study the effect <strong>of</strong> dense fasteners schedules. To determine the relative strength <strong>of</strong> walls in cyclic and in monotonictests.The wall sizes <strong>of</strong> specimens were 2440x2440mm or 2440x1220mm (heightx length) for monotonic tests and 2440x1220mm for cyclic tests. The framewas made using 89x41x10x0.84mm C-sections studs at 610mm on centerattached to 89x32x0.84mm U-sections track. Double back-to-back coupledstuds were employed at ends <strong>of</strong> each wall to avoid studs buckling. Holddowns(tie-downs) were used to connect each wall specimen to the base <strong>of</strong> thetest frame.The different sheathing types, sheathing orientations and screws spacingfor monotonic tests included: 2440x2440mm framed walls with 15.9mm thick PLY verticallyorientated with 152/305mm (perimeter/field) screw spacing. 2440x2440mm or 2440x1220mm framed walls with 11.1mm thickorientated strand board vertically or horizontally orientated withfasteners spacing varying between 152/305mm and 51/305mm. 2440x1220mm framed walls with 11.1mm thick orientated strandboard on one side with fasteners spacing varying between 152/305mmand 51/305mm and 12.7mm thick gypsum wallboard on the other sidewith 178/178mm screw spacing, both external and internal sheathingswere vertically orientated. 2440x2440mm framed walls with 12.7mm thick GWB on both sidewith fasteners spacing varying between 178/178mm and 102/102mm,both external and internal sheathings were horizontally orientated.For cyclic tests the sheathings used were 11.1mm thick orientated strandboard or 15.9mm thick PLY. The panels were always vertically orientated andthe screws spacing varying between 152/305mm and 51/305mm.For both monotonic and cyclic tests, the fasteners used were: 4.2x13mm(diameter x length) wafer-head screws for the frame connections; 4.2x25mmflat head screws for the PLY and OSB panel and 4.2x32mm bugle headscrews for gypsum wallboard.
Testing <strong>of</strong> cold-formed steel stud shear walls: review <strong>of</strong> existing literature 101From the monotonic tests results, the Authors concluded that: The overall behavior <strong>of</strong> the PLY and OSB panel assemblies waspractically identical. In particular the PLY walls carried slightly higherloads. The sheathings oriented horizontally exhibited slightly higher shearstrength than the panels oriented vertically. The shear strength was practically the same for the aspect ratio varyingbetween 1 and 2. The reduction <strong>of</strong> the fastener spacing increased significantly the shearstrength. The walls with OSB panels on one side and GWB on the other sideexhibited similar failure behavior, but degraded more gradually thanthe walls with OSB on one side alone in terms <strong>of</strong> shear capacity. The walls with GWB panels on both sides had much lower shearstrength than walls with OSB sheathing.Serrette et al. concluded form the results <strong>of</strong> the cyclic tests that: PLY and OSB panel assemblies sowed a little difference in the cyclicshear strength. As in the monotonic tests, the wall shear strength increasedsignificantly with the reduction <strong>of</strong> the fastener spacing. The shear behavior <strong>of</strong> walls observed in cyclic tests was somewhatlower than the shear behavior exhibited in monotonic tests for walls <strong>of</strong>similar construction details.3.1.9 Serrette et al. (1997a)In this paper, the Authors presented the results <strong>of</strong> thirty-three full-scalemonotonic racking tests and twenty small-scale lateral shear tests on PLY,OSB, GWB and FiberBond wallboard (FBW) attached to light gauge steelstud.The main test objectives were: To investigate the behavior <strong>of</strong> the different sheathings material. To examine the effect <strong>of</strong> fasteners type and size.
102 Chapter III To examine the effect <strong>of</strong> fasteners spacing for gypsum and FBW. To compare the behavior <strong>of</strong> the panels oriented vertically and panelsoriented horizontally with steel flat strap and solid blocking attachedacross the mid-height. To compare the full-scale and small-scale test results.Two different frames were used in the full-scale tests: type A and type B.The type A frame was 2440x2440mm (height x length) in size constructedwith ASTM A446 Grade A galvanized steel members. The studs were152x41x10x0.84 C-sections spaced at 610mm on center and the tracks were152x25x0.84mm U-sections. The chord studs were two back-to-back coupledpr<strong>of</strong>iles. The type B frame was identical to type A except that 51x0.84mm(width x thickness) steel flat strap was attached across the mid-height <strong>of</strong> thewall and that solid blocking was installed above the strap in the and bays. Thetype A and B frames were sheathed with: 11.9mm thick PLY; 11.1mm thickOSB; 12.7mm thick FBW; 12.7mm thick GWB. The panels were placedeither one side or both sides and they were oriented either vertically orhorizontally depending on the test. The frame fasteners were 4.2x13mm(diameter x length) wafer-head screws. Panels were attached to the frameusing either 3.5x25mm bugle-head screws, 4.2x32mm flat-head screws withcountersinking nibs, or 3.7mm diameter steel pins depending on the test.Hold-downs were used to connect each wall specimen to the base <strong>of</strong> testframe.The small-scale specimens consisting <strong>of</strong> single 610x610mm panelsattached to opposite flanges <strong>of</strong> the studs that were oriented horizontally with asingle stud on top and double studs placed back-to-back on the bottom. Thespecimens were sheathed with panels including 11.9mm thick PLY; 11.1mmthick OSB; 12.7mm thick FBW; 12.7mm thick GWB. The panels wereconnected with three 3.5x25mm bugle-head screws (152mm on centerspacing) to the top stud and with two rows <strong>of</strong> six screws (102mm on centerspacing) to the bottom studs.The full-scale tests failed initially by fasteners rotation (tilting) about theplane <strong>of</strong> the stud flange. In some tests the chord studs were subjected to local
Testing <strong>of</strong> cold-formed steel stud shear walls: review <strong>of</strong> existing literature 103crushing at the bearing end. Otherwise, generally the specimens failed eitherwhen the edges <strong>of</strong> the panels broke <strong>of</strong>f at the screw fastener or when the panelpulled over the head <strong>of</strong> the screws. In some cases where 3.5mm diameterscrews were used in PLY and OSB panels, fracture <strong>of</strong> the screws occurred.The Authors reported for the full-scale tests the following conclusions: The behavior <strong>of</strong> the PLY and OSB panels was comparable, whereasthe strength <strong>of</strong> gypsum and FBW walls was relatively low. The use <strong>of</strong>GWB on the interior <strong>of</strong> the wall and PLY on the exterior produced ahigher shear capacity, by approximately 18%, in comparison with thePLY wall. The use <strong>of</strong> 3.7mm diameter nails decreased the maximum shearstrength in comparison with 3.5 and 4.2mm diameters screws. Themaximum shear strength was not influenced by the size <strong>of</strong> the fastener.The failure mode for the specimens with 3.5mm diameter screws wasfracture <strong>of</strong> fasteners and thus walls with 3.5mm diameter screws mayfail at lower loads than walls with 4.2mm diameter screws. For gypsum and FBW the reduction <strong>of</strong> the fastener spacing increasedsignificantly the shear strength. The walls with blocked panels oriented horizontally providedessentially the same shear capacity but higher stiffness than acomparable wall with panels oriented vertically. When blocking wasomitted from the walls with horizontal panels, the shear capacity <strong>of</strong> thewall was reduced by more than 50%.For the small-scale tests the conclusions <strong>of</strong> the Authors were: Both the strength and stiffness <strong>of</strong> the PLY specimens were more thanthat <strong>of</strong> the OSB specimens. The strength <strong>of</strong> gypsum and FBW wallswas less than that <strong>of</strong> PLY and OSB specimens. The normalized shear strength for small-scale tests was similar asthose for full-scale tests, thus the small-scale tests were considered tobe useful in an evaluation <strong>of</strong> the relative resistance <strong>of</strong> different wallassemblies.
104 Chapter III3.1.10 Serrette et al. (1997b)The Authors illustrated in this work the results <strong>of</strong> sixteen monotonic andtwenty eight cyclic shear tests conducted on walls assembled with PLY, OSB,steel sheet sheathing (SSS) and X-B attached to light gauge steel frame ononly one side.The objectives <strong>of</strong> the test program were the followings: To obtain design data for walls with high aspect ratios (varying from 2to 4). To define limits for framing thickness for sheathing attached with4.2mm diameter screws. To study the behavior <strong>of</strong> different types <strong>of</strong> sheathings (PLY, OSB,SSS). To evaluated the performance <strong>of</strong> X-B. To examine the effect <strong>of</strong> various fastener schedules.Both monotonic and cyclic tests were conducted on walls with89x43x13mm (web depth x flange size x lip size) C-sections studs at 610mmon center and with 89x32 (web depth x flange size) U-sections track. Doublestuds (back-to-back) were used at the ends <strong>of</strong> the walls. All PLY and OSBpanels were orientated vertically. The fastener types used were 4.2x13mmmodified truss head screws for the frame connections, 4.2x25mm (diameter xlength) flat head screws for the PLY and OSB panels, and 4.2x13mmmodified truss head screws for the X-B and SSS. Hold-downs were used toconnect each wall specimen to the base <strong>of</strong> the test frame.For monotonic tests, the studs were 0.84mm thick except for one casewhere 1.09mm thick studs were used (tests 3-4). The following assemblieswere tested: 2440x1220mm walls with 114x0.84mm (width x thickness) and191x0.84mm X-B (tests 1-4). 2440x610mm walls with 11.1mm thick OSB attached to the frameusing screws spaced at 305mm in the field and at 152, 102 and 51mmat the perimeter (tests 5-10).
Testing <strong>of</strong> cold-formed steel stud shear walls: review <strong>of</strong> existing literature 1052440x610mm walls with 0.46 and 0.69mm thick SSS attached to theframe using screws spaced at 305mm in the field and at 152 and 102 atthe perimeter (tests 11-14).2440x1220mm walls with 0.46mm thick SSS attached to the frameusing screws spaced at 305mm in the field and at 152 at the perimeter(tests 15-16).For the cyclic tests, the studs were 0.84mm thick except for some cases. Infact, for A1-A8 tests the end studs were 1.09mm thick, while for B1-B2 andB3-B4 tests all studs were 1.09 and 1.37mm thick respectively. The differentshear resisting systems included: 2440x1220mm walls with 11.9mm thick PLY and 11.1mm thick OSBattached to the frame using screws spaced at 305mm in the field and at76 and 51mm at the perimeter (tests A1-A8). 2440x1220mm walls with 11.9mm thick PLY attached to the frameusing screws spaced at 305mm in the field and at 152mm at theperimeter (tests B1-B4). 2440x1220mm walls with 114x0.84mm (width x thickness) and191x0.84mm X-B (tests C1-C4). 2440x1220mm walls with 0.46mm thick SSS attached to the frameusing screws spaced at 305mm in the field and at 152 at the perimeter(tests D1-D2). 2440x1220mm walls with 0.46mm thick SSS attached to the frameusing screws spaced at 305mm in the field and at 152mm at theperimeter (tests D1-D2). 2440x610mm walls with 11.1mm thick OSB attached to the frameusing spaced at 305mm in the field and at 152, 102 and 51mm at theperimeter (tests E1-E6). 2440x610mm walls with 0.69mm thick SSS attached to the frameusing screws spaced at 305mm in the field and at 102 and 51mm at theperimeter (tests F1-F4).For the monotonic tests, Serette et al. reported that the walls with114x0.84mm X-B failed due to local buckling <strong>of</strong> the end studs, differently, the
106 Chapter IIIwalls with 191x0.84mm X-B failed due to local buckling in the top track andend studs, aggravated by bending due to the eccentricity <strong>of</strong> the strap force.For the walls with OSB panels with a 51mm edge screw spacing, the endstuds buckled just above the track. With a 102mm edge screw spacingdisplacements became excessive. With a 152mm edge screw spacing failurewas initiated by buckling <strong>of</strong> the end stud at the hold-down.Failure <strong>of</strong> walls with SSS resulted from rupture <strong>of</strong> the steel sheet along theline <strong>of</strong> the screws at the edges. Diagonal “tension field” patterns were notobserved.In the case <strong>of</strong> cyclic tests, for orientated strand board and PLY sheathingswith aspect ratio <strong>of</strong> 2, failure was initiated by screw heads pulling through thesheathing or screw pulling out <strong>of</strong> the framing in 1.09mm thick framing (testsA1-A8 and B1, B2), but in 1.37mm thick framing (tests B3, B4) some screwsfailed in shear.Failure modes in walls with X-B (C1-C4) were similar to those observed inmonotonic tests <strong>of</strong> similar specimens.Analogously, for orientated strand board sheathings with an aspect ratio <strong>of</strong>4 (tests E1-E6) failure modes were similar to those observed in monotonictests <strong>of</strong> similar specimens.Finally, failure modes for walls with SSS (D1, D2, F1-F4) resulted from acombination <strong>of</strong> screws pulling out <strong>of</strong> the framing, rupture <strong>of</strong> the steel sheetalong the line <strong>of</strong> screws at the edges, and in some cases local buckling <strong>of</strong> theend studs.From the tests results, the Authors concluded that: The shear strength appreciably decreased when the aspect ratioincreased from 2 to 4. The use <strong>of</strong> thicker and back-to-back coupled end studs for the wallswith PLY and OSB panels allowed to fully develop the shear strength<strong>of</strong> the panels-to-frame connections also in the cases in which densefasteners schedules were used. 4.2mm screws should be limited to1.09mm thick framing. In fact, this screw behaved well in the 0.84 and1.09mm thick frames (screws pull-out or pull-through failure) butfractured in shear when 1.37mm thick frames were used.
Testing <strong>of</strong> cold-formed steel stud shear walls: review <strong>of</strong> existing literature 107 The walls sheathed with SSS had a ductile behavior without suddendecreases in shear load capacity; moreover, the use <strong>of</strong> thick sheathingsincreased the shear resistance, but the failure mode moved fromrupture at the edges <strong>of</strong> the sheathing to screw pull-out from theframing. In the design <strong>of</strong> walls with X-B, the designer must consider that theforce in the strap may be larger than that corresponding to the nominalyield strength; also, if X-Bs are installed on one side <strong>of</strong> the wall only,the effect <strong>of</strong> eccentricity should be considered. Decreasing the screws spacing result in the increased maximum shearload.3.1.11 NAHB Research Center (1997)In this paper, the National Association <strong>of</strong> Home Builders (NAHB)Research Center presented the results <strong>of</strong> four monotonic load tests <strong>of</strong>12190mm long, cold-formed steel (CFS) framed shear walls with openings.The goals <strong>of</strong> the experimental program were the followings: To study the capacity <strong>of</strong> steel-framed shear walls as influenced by thepresence <strong>of</strong> openings and, in particular, to investigate the suitability <strong>of</strong>using the “Perforated <strong>Shear</strong> Wall” (PSW) design method, originallydeveloped for wood structures (Sugiyama & Matsumoto, 1993), also incase <strong>of</strong> light-gauge steel-framed shear walls. To briefly investigate the effects <strong>of</strong> reduced anchoring constraints inview <strong>of</strong> future research to account for restraint provided by cornerswithout including hold-down brackets. To provide a direct comparison between the performances <strong>of</strong> woodframedand steel-framed shear walls.All shear walls specimens were 2440x12190mm (height x length) in size.The frames were constructed <strong>of</strong> 89x38x0.84mm (web depth x flange size xthickness) C-sections studs spaced at 610mm on center. Exterior sheathingsconsisted <strong>of</strong> 11.1mm thick OSB oriented vertically and fastened to the frameswith 4.2mm diameter screws spaced 152mm along the perimeter and 305mmin the field <strong>of</strong> the panels. Interior sheathings were 12.7mm thick GWB
108 Chapter IIIoriented vertically and attached to the frames with 3.5mm diameter screwsspaced 178mm along the perimeter and 254mm in the field.The wall 1 was fully sheathed, while the walls 2A and 2B had one2032x1219mm (height x length) door and one 1727x2400mm window.Besides the same openings present in the wall 2A and 2B, the wall 4 had one2032x3658mm door. The specimens 1, 2A and 4 were constructed withtypical details. In particular two hold-down anchors were used on each <strong>of</strong>these walls (one at each end). On the contrary, the specimen 2B wasconstructed without hold-down anchors.It was reported in the NAHB document that similar modes <strong>of</strong> failure wereobserved in the specimens with hold-down anchors. The initial loading waslinear until the screws began to pull through the GWB, then; it was observed aslight reduction in stiffness. As the load approached ultimate capacity theOSB panels cracked at the perimeter screw connections.The wall without hold-down anchors also showed failure <strong>of</strong> the interiorpanels, although the exterior panels and the bottom track were unable todistribute the uplift forces at the end <strong>of</strong> the wall. In fact, the bottom trackfailed in bending due to uplift at the location <strong>of</strong> the first anchor bolt.The NAHB presented the following conclusions: The calculation <strong>of</strong> the shear capacity using the PSW design methodappeared valid, but revealed a conservative prediction <strong>of</strong> ultimateshear strength. Hold-down reduced uplift and increased the ultimate shear capacity byallowing more sheathing-to-frame screws to resist shear. The lateral load resisting mechanism for both wood-framed and steelframedshear walls appeared to be similar.3.1.12 Gad et al. (1999a, b)The Authors illustrated in this work an important investigation in theseismic performance <strong>of</strong> residential structures with CFS frames. The researchinvolved an extensive racking and dynamic testing program on the both twoandtree-dimensional framing assemblies with X-B bracing.
Testing <strong>of</strong> cold-formed steel stud shear walls: review <strong>of</strong> existing literature 109The objectives <strong>of</strong> the experimental program were the followings: To study the interaction between the different components <strong>of</strong> a typicalwall assemblage. To quantify the lateral stiffness and strength contributions <strong>of</strong>plasterboard and determine its reliability under cyclic loads. To investigate the inertial loading effect <strong>of</strong> brick veneer walls on theframing assembly. To develop guidelines that enable prediction <strong>of</strong> the behavior <strong>of</strong>complete structures.The experimental program was divided into two steps: testing <strong>of</strong> twodimensionalunlined frames with different frame connection types and testing<strong>of</strong> a one-room-house at various stages <strong>of</strong> construction.The two-dimensional specimens measured 2400x2400mm (height x length)and were constructed from CFS channel sections with steel grade <strong>of</strong> G300.The section <strong>of</strong> the studs was 75x32x1.2mm (web depth x flange size xthickness), for the plates (stud track) the section was 78x31x1.2mm and forthe noggings (blocking placed between all studs) was 72x34x1.2mm. Each X-B was 1.0 thick and 25mm wide with steel grade <strong>of</strong> G250. For simulating themass <strong>of</strong> a steel sheet ro<strong>of</strong>, a 350kg concrete beam was bolted to the top <strong>of</strong> theframe.The different connection types used were: Tab-in-slot connections, which are essentially pinned connections.These connections represent the lower bound response. Welded connections, which represent the upper bound response.On the walls with tab-in-slot connections were conducted slow cyclicracking and dynamic tests. In particular, the dynamic tests included pluck(applying a hammer blow on the concrete mass on the wall panel), swept sinewave and simulated earthquakes.The tests conducted on the welded frames were swept sine wave andsimulated earthquakes only.The one-room-house specimen measured 2300x2400x2400mm high andwas constructed from full-scale components. It represents a section <strong>of</strong> a
110 Chapter IIIrectangular house with plan dimensions <strong>of</strong> 11000x16000mm. The mass,applied on the test house through a concrete slab fixed to the joists, was2300kg. This mass corresponded to that due to ro<strong>of</strong> tiles, battens, insulation,ceiling lining and trusses for a plan area <strong>of</strong> 11000x2400mm. The two walls inthe east-west direction were framing assemblies with X-B bracing while thetwo walls in the north-south direction were non-load bearing and had standard900x2100mm door openings.All construction details were standard except for the hold-down that wasover-designed to eliminate a potential uplift failure. All the framing memberswere 75x35x1.0mm CFS channel sections with steel grade <strong>of</strong> G550. Tab-inslotconnections were used for to connect the stud, plates and noggings.Plasterboard lining, 10mm thick, was used for the ceiling and the walls, andconnected to the frame with 4.1x25mm (diameter x length) bugle head selfdrilling screws spaced 200mm along the wall vertical edges, 600mm along thetop and bottom plates, 300mm in the field <strong>of</strong> the ceiling and 400mm in thefield <strong>of</strong> the walls. Skirting boards, 55mm ceiling cornices and set corner jointswere used in conjunction with the plasterboard lining. The brick veneer wallswere connected to the studs by metal clip-on brick ties.The house was tested in the east-west and north-south directions atdifferent stages <strong>of</strong> construction. The tests conducted were mainly slow cyclicracking, swept sine wave and simulated earthquakes.From the two-dimensional tests results, the Authors concluded that theimportant component in unlined single frames is the strap bracing system. Inparticular they reported that: The failure <strong>of</strong> the frame was governed by the failure <strong>of</strong> the X-B. The dynamic characteristics <strong>of</strong> the frame were governed by the initialtension in the straps. In fact, the welded frame had a lower naturalfrequency (7.0Hz) than the tab-in-slot frame (6.3Hz) and thiscontradicted the expectation that the welded frame would be stifferthan the frame with tab-in-slot. The type <strong>of</strong> connections between the framing members did not seem tohave an influence on the structural response <strong>of</strong> the braced frames.
Testing <strong>of</strong> cold-formed steel stud shear walls: review <strong>of</strong> existing literature 111Gad et al. concluded from the three-dimensional test results that residentialsteel frames used in the tests performed well under racking and earthquakeloads. In particular, the Authors reported their conclusions for each differentstage <strong>of</strong> construction.For unlined frames: The behavior was governed by the X-B system. The initial tension in the X-B increased the frame stiffness <strong>of</strong> theframe and when the X-B yield then the true stiffness <strong>of</strong> the X-B system(strap and its connections) defined the stiffness <strong>of</strong> the frame. The type <strong>of</strong> strap bracing-to-plate connections governed the failureload and mechanism.For the lined frames: Plasterboard fixed as non-structural component provided higherstiffness, load carrying capacity and damping than X-B. When X-B and plasterboard were combined, the overall stiffness andstrength <strong>of</strong> the system is simple addition <strong>of</strong> individual contributionsfrom X-B and plasterboard. The plasterboard combined with ceiling cornices, skirting board andset corner joints, resisted about 60-70% <strong>of</strong> the applied racking loadwhereas the X-B resisted 30-40%.For brick veneer walls: In-plane brick veneer walls attached to the frame via clip-on ties didnot contribute to the stiffness <strong>of</strong> the system. Different displacements between the frame and the out-<strong>of</strong>-plane brickveneer walls were mainly accommodated by deformation <strong>of</strong> the studflanges rather than deformation <strong>of</strong> brick ties.3.1.13 Selenikovich et al. (1999)Selenikovich et al. presented the results <strong>of</strong> monotonic and cyclic tests onsix-teen full-size shear walls with and without openings.The objectives <strong>of</strong> the study were: To establish the effect <strong>of</strong> size <strong>of</strong> openings on shear wall performance. To compare the shear strength <strong>of</strong> the walls with previsions <strong>of</strong> the PSWdesign method (Sugiyama & Matsumoto, 1993).
112 Chapter III To determine the effect <strong>of</strong> cyclic loading on shear behavior. To examine the effect <strong>of</strong> the addition <strong>of</strong> internal GWB.The specimens were built in accordance with the “Builder’s <strong>Steel</strong>-<strong>Stud</strong>Guide” (AISI, 1996). All walls were 2440x12192mm (height x length) in sizewith the same type <strong>of</strong> framing, sheathing, fasteners, and fasteners schedules.The frames consisted in 89x38x0.84mm (web depth x flange size x thickness)C-sections studs at 610mm on center. Double studs (back-to-back) were usedat the ends <strong>of</strong> the walls and around doors and windows. Exterior sheathingswere 11.1mm thick OSB sheathing oriented vertically. Interior 12.7mm thickGWB sheathings oriented vertically were on an additional monotonic test. Thefasteners to connect the steel frame members were 4.2mm (diameter) lowpr<strong>of</strong>ile head screws whereas to connect the sheathing to the frame were used4.2mm bugle head screws. Sheathing screws were spaced 152mm onperimeter and 305mm in field to attach OSB panels, and 178mm on perimeterand 254mm in field for GWB. Hold-downs were used to connect each wallspecimen to the base <strong>of</strong> test frame.The Authors observed that the predominant failure mode was head pullthrough<strong>of</strong> sheathing screws and bending <strong>of</strong> frame elements. They concludedthe following: Long, fully sheathed walls were significantly stiffer and stronger butless ductile than walls with openings. The predictions <strong>of</strong> the PSW design method were conservative at alllevels <strong>of</strong> monotonic and cyclic loading. Cyclic loading did not influence the elastic behavior <strong>of</strong> the walls butreduced their deformation capacity. The strength <strong>of</strong> fully sheathed walls was affected more significantly bycyclic loading than walls with openings. Adding <strong>of</strong> GWB panels increased the shear strength and stiffness <strong>of</strong>fully sheathed walls under monotonic load.3.1.14 COLA-UCI (2001)The City <strong>of</strong> Los Angeles – University <strong>of</strong> California (COLA – UCI) testswere carried out with the aim to develop an understanding <strong>of</strong> the probable
Testing <strong>of</strong> cold-formed steel stud shear walls: review <strong>of</strong> existing literature 113dynamic behavior <strong>of</strong> PLY and OSB panels attached to wood frame walls orlight-gauge steel frame by fasteners such as nails or screws.The main goals <strong>of</strong> the study were: To determine whether the shear wall system could be modeled in theirlinear displacement range as principally shear deforming systems. To determine the cyclic force-displacement relationships forcommonly used light-framed walls with shear panels. To provide data for the improvement <strong>of</strong> the design <strong>of</strong> lateral-loadresisting shear wall systems. To make recommendations to the City <strong>of</strong> Los Angeles if code changesare warranted by the data and data analysis.A total <strong>of</strong> thirty-six groups <strong>of</strong> 2440x2440mm (height x length) shear wallwith three specimens per group were tested under cyclic load. The groupsfrom 1 to 13 and from 20 to 36 had wood frame walls, whereas the groupsfrom 14 to 19 had light-gauge steel frame.The specimens with steel frame included 11.1mm thick OSB or 11.9 thickPLY, which were attached to frame with 4.2x25mm (diameter x length) buglehead screws spaced 305mm in the field and 51, 102, or 152 at the perimeter.The 89x41x10x0.84 C-sections studs were spaced at 610mm on center andwere connected to the 89x38mm (web depth x thickness) U-sections track.Double studs were coupled back-to-back at the end <strong>of</strong> the wall to prevent localand flexural buckling in the chords. Strap hold-down anchors were used toconnect each wall specimen to the base <strong>of</strong> test frame.Tests results showed that: A reduction <strong>of</strong> the fastener spacing nonlinearly increased the shearstrength and stiffness for both the light-gauge steel framed and woodframed stud walls. With the same sheathing types and fastener spacing, steel-framed wallsexhibited somewhat higher shear strength and ductility but lesshysteretic damping than wood-framed walls.
114 Chapter III3.1.15 Dubina & Fulop (2002)The experimental program presented by Dubina & Fulop was based on sixseries <strong>of</strong> full-scale tests with different cladding arrangements. Each seriesconsisted <strong>of</strong> identical wall panels, tested statically both monotonic and cyclic.The objectives <strong>of</strong> test program were the followings: To compare monotonic and cyclic behavior <strong>of</strong> wall-stud shear walls. To confirm the previous results about the effect <strong>of</strong> interior gypsumcladding. To study the effect <strong>of</strong> openings. To compare the behavior <strong>of</strong> different cladding materials and crossbracing. To provide experimental information for the calibration <strong>of</strong> finiteelement models.All shear walls specimens were 2440x3600mm (height x length) in size.The CFS frames consisted in 600S175-62 studs (150x1.5mm (web depth xthickness) C-sections) at 600mm on center, while the tracks were 600T225-62(154x1.5 (web depth x thickness) U-sections). Double studs (back-to-back)were used at the ends <strong>of</strong> the walls and around openings.The different wall specimen series included: Series 0: constituted by one wall specimen consisting <strong>of</strong> CFS frameswithout some shear resisting system. Series I: represented by three wall specimens with exterior claddingconsisting <strong>of</strong> steel corrugated sheet (SCS) LTP20/0.5 placed inhorizontal position and fixed to the frame using SL2-T-A14(4.8x22mm (diameter x length)) self-tapping screws spaced at 114mmat sheet ends and at 229mm in the field. Series II: composed by three wall specimens with exterior claddingsimilar to those <strong>of</strong> the series I and with interior cladding consisting <strong>of</strong>12.5mm thick GWB placed in vertical position and fixed to the frameat 250mm in the field and at the perimeter <strong>of</strong> the panel. Series III: constituted by two wall specimens braced by means <strong>of</strong>110x1.5mm (width x thickness) steel straps on both sides <strong>of</strong> the frame.
Testing <strong>of</strong> cold-formed steel stud shear walls: review <strong>of</strong> existing literature 115The straps were fixed to the wall structures using SPEDEC SL4-F-4.8x16 (4.8x16mm (diameter x length)) and SD6-T16-6.3x25(6.3x25mm (diameter x length)) self-drilling screws. The numbers <strong>of</strong>screws were designed for the yield strength <strong>of</strong> the strap.Series IV: composed by three wall specimens similar to those <strong>of</strong> theseries II except for the presence <strong>of</strong> the one 1200mm wide door.Series OSB I: composed by two wall specimens with exteriorconsisting <strong>of</strong> 10mm thick OSB placed in vertical position and fixed tothe frame using bugle head self-drilling screws <strong>of</strong> 4.2mm diameterspaced at 250mm in the field and at 105mm at the perimeter <strong>of</strong> thepanel.Series OSB II: composed by three wall specimens similar to those <strong>of</strong>the series OSB I except for the presence <strong>of</strong> the one 1200mm widedoor.The Authors reported that for Series I and II local deformation in theuplifted corners was followed by pr<strong>of</strong>ile-end distortion, gradual deformationin connections and failure occurred in seam lines. The behavior <strong>of</strong> Series IVwas very similar to the ones in Series I and II, with much stronger cornersuplift. For the Series III after buckling <strong>of</strong> compressed straps in the early stage,the local deformation <strong>of</strong> the lower track followed. Important plastic elongation<strong>of</strong> the straps was observed, but because <strong>of</strong> this unexpected failure <strong>of</strong> thecorner occurred. In the case <strong>of</strong> Series OSB I the failure mechanism <strong>of</strong> thespecimens was different from SCS specimens due to different sheetingorientation. Failure <strong>of</strong> the specimens was sudden when one vertical row <strong>of</strong>screws unzipped from the stud and both pull over the screw head, and failure<strong>of</strong> OSB margin was observed. For the Series OSB II important inclination <strong>of</strong>the screws developed in the OSB panels-to-lower track connection, followedby sudden rupture <strong>of</strong> this connection line.The Authors concluded that: Very significant pinching, and reduced energy dissipation characterizethe hysteretic behavior.
116 Chapter III The behavior <strong>of</strong> gypsum panels was satisfactory. In fact they couldfollow even extreme deformation <strong>of</strong> the wall without significantdamage.3.1.16 Branston et al. (2003)In an attempt to draw a link between the existing database <strong>of</strong> steel frame /wood panel shear tests carried out in the USA and any future experiment withCanadian products, a series <strong>of</strong> 12 match tests was conducted by Branston etal..The goal <strong>of</strong> the research project was to reproduce the results <strong>of</strong> some testscompleted by Serrette et al. (1996a) and COLA-UCI (2001) using steel andwood panel products purchased in the USA and following the procedures setup by previous researchers. In particular, the overall long-term objective <strong>of</strong> theshear wall research is to investigate the performance <strong>of</strong>, and to provideguidelines for the design <strong>of</strong> the light gauge steel structures when subjected toearthquake loading.In this research program, twelve full-scale steel frame shear walls, witheither OSB or PLY sheathing, were tested (6 monotonic load tests and 6 cyclicload tests).The frame was made using 89x41x10x0.84 C-sections studs spaced at610mm on center attached to the 89x38mm (web depth x thickness) U-sections track. Double studs were coupled back-to-back at the end <strong>of</strong> the wallto prevent local and flexural buckling in the chords. The fasteners used for theframe connections were 4.2x13mm wafer-head screws. The panels wereconnected to the frame with 4.2x38mm bugle head screws. Wall specimenswere connected to the base <strong>of</strong> test frame with hold-downs (tie-downs) forspecimens OSB 4-8 US M-, OSB 4-8 US C- and PLY 8-8 US M- and withstrap hold-down anchors for specimens PLY 8-8 US C-.The different tests included: OSB 4-8 US M- A, B, C: Monotonic tests <strong>of</strong> 1220x2440mm (height xlength) walls with 0.84mm thick steel framing sheathed on one sidewith 11mm thick OSB. Self-drilling sheathing screws were spaced at
Testing <strong>of</strong> cold-formed steel stud shear walls: review <strong>of</strong> existing literature 117102mm at the perimeter and at 305mm in the field. (Previous tests:Serrette et al. (1996a) OSB – 1D3, 1D4).OSB 4-8 US C- A, B, C: Cyclic tests <strong>of</strong> 1220x2440mm (height xlength) walls with 0.84mm thick steel framing sheathed on one sidewith 11mm thick OSB. Self-drilling sheathing screws were spaced at102mm at the perimeter and at 305mm in the field. (Previous tests:Serrette et al. (1996a) AISI OSB – 3, 4).PLY 8-8 US M- A, B, C: Monotonic tests <strong>of</strong> 2440x2440mm (height xlength) walls with 0.84mm thick steel framing sheathed on one sidewith 12mm thick PLY. Self-drilling sheathing screws were spaced at152mm at the perimeter and at 305mm in the field. (Previous tests:Serrette et al. (1996a) PLY – 1A6, 1A7).PLY 8-8 US C- A, B, C: Cyclic tests <strong>of</strong> 2440x2440mm (height xlength) walls with 0.84mm thick steel framing sheathed on one sidewith 12mm thick PLY. Self-drilling sheathing screws were spaced at152mm at the perimeter and at 305mm in the field. (Previous tests:COLA-UCI (2001) 14A. 14B, 14C).In general, the failure <strong>of</strong> all wall specimens was restricted to the wood tosteel connections and the studs did not fail in compression, nor did the holddownssuffer any type <strong>of</strong> failure.From the monotonic tests results, the Authors concluded that a variation inthe performance <strong>of</strong> the walls from the different research programs wasobserved. In a number <strong>of</strong> instances the shear capacity and stiffness <strong>of</strong> the testsspecimens differed by a substantial amount. The variation in strength <strong>of</strong> thewalls can be attributed in general to the different material properties that mayhave existed in both the steel and wood panel members. With respect to thePLY 8-8 US C- A, B, C walls, the higher ultimate strength and stiffnessobtained for the COLA-UCI tests can most likely be traced to the use <strong>of</strong>sheathing structural 1 grade panels in the original tests, whereas regularsheathing grade PLY was used in the construction <strong>of</strong> the match tests.The addition <strong>of</strong> a single horizontal stiffener located at the mid-height <strong>of</strong> thewall did not increase the shear capacity and was not recommended since itincreased the construction difficulties and the cost <strong>of</strong> installation.
118 Chapter III3.2 FACTORS AFFECTING CFSSSW BEHAVIOR UNDERLATERAL LOADING: THEY INDIVIDUATION ANDANALYSISThe performance <strong>of</strong> house structures braced with cold-formed/light gaugesteel (CFS/LGS) framing under horizontal load is determined by thehorizontal (diaphragms) and vertical (stud walls) lateral force resistingsystems (LFRSs) behavior. If both horizontal diaphragms and vertical studwalls are frames braced with structural panels and/or with diagonal bracing,the same basic structural parameters influence their shear behavior. Forinvestigating this influence, the rather large number <strong>of</strong> experimental programsconducted on CFSSSW with different assemblies has been illustrated in theprevious Sections. From the examination <strong>of</strong> these experimental programs, it ispossible to individuate the following basic factors that influence the lateralbehavior <strong>of</strong> CFSSSW: sheathing (type, thickness, orientation); framing (stud size, thickness and spacing, presence <strong>of</strong> X-bracing); fastener (type, size, spacing); geometry (wall aspect ratio, openings); type <strong>of</strong> loading (monotonic or cyclic); construction techniques and anchorage details.Their effects on shear wall behavior are synthesized in the following. Amore complete summary <strong>of</strong> the conclusions obtained by several researchers isgiven in Appendix B.3.2.1 Sheathing (type, thickness, orientation)The basic behavior <strong>of</strong> different sheathing types and thicknesses has beenstudied by Tarpy (1980), Tarpy & Girard (1982), Serrette et al. (1996a, b,1997a, b), Salenikovich et al. (1999), Dubina & Fulop (2002).Those studies included walls constructed with PLY, OSB, GWB, GSB,FBW, CP, SSS, and SCS. For understanding the different structural capacityassociated to different sheathing types and thicknesses, a comparison betweenthe average values <strong>of</strong> shear strength derived from the existing experimental
Testing <strong>of</strong> cold-formed steel stud shear walls: review <strong>of</strong> existing literature 119results is reported in Table 3.2. These values are normalized with respect toaverage values <strong>of</strong> shear strength for walls braced with 11.1mm thick OSB.From these comparisons, it is possible to conclude that the PLY provided alittle (about 10%) higher shear strength in comparison with the OSB; whereasthe capacity <strong>of</strong> the GWB and GSB is much (about 60%) lower than that <strong>of</strong> theOSB. Moreover, the adding <strong>of</strong> GWB to the opposite side <strong>of</strong> the wall assemblyincreased the shear strength by about 40%. Finally, the SSS presented arelatively smaller (about 10%) shear strength than those <strong>of</strong> OSB.Sheathing type and thickness No <strong>of</strong> specimens Average Standard deviationOSB t=11.1mm 1.00PLY t=11.9mm 13 1.10 0.09GWB t=12.7mm + GWB t=12.7mm 2 0.83 0.01OSB t=11.1mm+GWB t=12.7mm 4 1.39 0.58SSS t=0.46mm 1 0.91SSS t=0.69mm 3 0.86 0.12GWB t=12.7mm+GSB t=12.7mm 2 0.78 0.36+:double sheathing (internal and external sheathings)t: thicknessTable 3.2: Normalized shear capacity for different sheathing type and thickness.Serrette & Ogunfunmi (1996) and Serrette et al. (1994, 1997a) examinedthe influence <strong>of</strong> sheathing orientation and the contribution <strong>of</strong> horizontal steelstraps installed at mid-height <strong>of</strong> the walls and fastened to the blocking. Acomparison between the shear strength for walls with sheathing orientedvertically and horizontally, with and without solid blocking, is reported inFigure 3.1. In particular, this comparison demonstrates that the panels orientedparallel to the studs provided the same shear strength than those appliedperpendicular to the studs with strap blocking. In addition, when in the case <strong>of</strong>panels perpendicular to studs blocking was omitted, the shear capacity <strong>of</strong> thewall, was reduced by more than 50%.
120 Chapter III3025Ultimate shearstrength[kN/m]VERTICALHORIZONTAL + SOLID BLOCKHORIZONTAL201510Serrette et al .(1996a)1A2,1A31A5,1A6Serrette et al .(1997a)OSB-T4OSB-T5Serrette et al .(1994)687Serrette et al .(1997a)PLY-T4PLY-T7PLY-T6Serrette et al .(1997a)GYP-T2GYP-T150OSB OSB PLY PLY GWB+GWBFigure 3.1: Influence <strong>of</strong> the sheathing orientation.3.2.2 Framing (stud size, thickness and spacing, presence <strong>of</strong> X-bracing)The effects <strong>of</strong> framing stud size, thickness and spacing have been studiedby Tarpy & Girard (1982), Tissel (1993) and Serrette et al. (1997b). Thosestudies indicated that the use <strong>of</strong> thicker (1.09mm thickness) and multiplechord studs (back-to-back coupled C-sections) allowed the development <strong>of</strong> thefull shear strength <strong>of</strong> the wall panels. In addition, the reduction <strong>of</strong> the studspacing did not increase significantly the shear performance.The contribution <strong>of</strong> steel flat strap tension X-bracing has been investigatedby Serrette & Ogunfunmi (1996), Serrette et al. (1997b) and Gad et al.(1999a). In particular, Serrette et al. concluded that, although the adding <strong>of</strong>flat strap improved the shear behavior, their employment is not practical.3.2.3 Fastener (type, size, spacing)An extensive experimental study on the effect <strong>of</strong> fastener type, size andspacing has been performed by Tarpy & Hauenstein (1978), Tarpy (1980),Tarpy & Girard (1982), Tissel (1993), Serrette et al. (1996a, b, 1997a, b), Gadet al. (1999a), COLA-UCI (2001). Those studies showed that the reduction <strong>of</strong>the fastener spacing at the panel edges improved significantly the shearperformance. Furthermore, they proved that for PLY (11.9mm thick) or OSB
Testing <strong>of</strong> cold-formed steel stud shear walls: review <strong>of</strong> existing literature 121(11.1mm thick) panels fastened to members with a thickness from 0.84mm to1.09mm, 4.2x25mm (diameter x length) flat-head or bugle-head self-drillingscrews should be used, while for gypsum panels (12.7mm thick) 3.5x25.4mmbugle-head self-drilling screws should be adopted.3.2.4 Geometry (wall aspect ratio, openings)McCreless & Tarpy (1978), Tarpy & Girard (1982) and Serrette et al.(1996a, 1997b) studied the effect <strong>of</strong> the wall aspect ratio (height/length)variation. The shear strength values obtained from the cited test results arereported as a function <strong>of</strong> aspect ratio (H/L) in Figure 3.2. The Figureillustrates, according to the McCreless & Tarpy (1978) and Serrette et al.(1996a) investigations, how the shear strength is practically insensitive to theaspect ratio, when this is in the range [0.3 , 2]. Moreover, according to resultsgiven in Serrette et al. (1997b), the shear strength appreciably decreases whenthe aspect ratio increases from 2 to 4.The NAHB Research Center (1997), Salenikovich et al. (1999) and Dubina& Fulop (2002) examined the influence <strong>of</strong> the opening size. The shearstrength values obtained from their tests are reported as a function <strong>of</strong> thesheathing area ratio (r) in Figure 3.3, where r is defined in following equation:1r (3.1)Ao1h Liwith Ao: the total area <strong>of</strong> openings; h: the height <strong>of</strong> the wall; and Li: the length<strong>of</strong> the full height wall segment.The Figure shows that a reduction <strong>of</strong> r increases the shear capacity. TheNAHB Research Center and Salenikovich et al. also investigated thesuitability <strong>of</strong> using the PSW design method, originally developed for woodstructures (Sugiyama & Matsumoto 1994), also in case <strong>of</strong> CFSSSW. Inparticular, they concluded that the PSW method reveals a conservativeprediction <strong>of</strong> shear strengths.
122 Chapter IIIM78: McCreless & Tarpy (1978); TG82: Tarpy & Girard (1982); S+96a:Serrette et al. (1996a); S+97a: Serrette et al. (1997a)H: height <strong>of</strong> the wall; L: length <strong>of</strong> the wallFigure 3.2: Influence <strong>of</strong> the aspect ratio.N97: NAHB Research Center (1997); S+99: et al. (1999); FD02: Dubina &Fulop (2002)-m: monotonic test; -c: cyclic test=1/(1+Ao/HLi): sheathing area ratioAo: total area <strong>of</strong> openings; H: height <strong>of</strong> the wall; Li: length <strong>of</strong> the full heightwall segmentFigure 3.3: Influence <strong>of</strong> the openings.
Testing <strong>of</strong> cold-formed steel stud shear walls: review <strong>of</strong> existing literature 1233.2.5 Type <strong>of</strong> loading (monotonic or cyclic)The effect <strong>of</strong> cyclic loading on the lateral strength, stiffness and ductility <strong>of</strong>steel stud shear walls systems has been investigated by Serrette et al. (1996a,b and 1997b), Salenikovich et al. (1999), COLA-UCI (2001), Dubina & Fulop(2002) and Branston et al. (2003). The results <strong>of</strong> those studies showed thatcyclic loadings reduce the shear performance <strong>of</strong> steel stud shear walls, incomparison with monotonic loads.The ultimate shear strengths obtained under both monotonic and cyclicloading tests, using nominally identical specimens are shown in Figure 3.4.The comparison between monotonic and cyclic test results reveals that theshear strength under cyclic loads is about 10% in average lower than thatunder monotonic load.Moreover, a typical cyclic response <strong>of</strong> CFSSSW is characterized bysignificant pinching <strong>of</strong> the hysteresis response, with reduced energydissipation capacity, as shown in Figure 3.5 for a test performed by Branstonet al. (2003).S+96a: Serrette et al. (1996a); S+96ab: Serrette et al. (1996a, b); S+97b:Serrette et al. (1997b); S+99: Salenikovich et al. (1999); FD02: Dubina &Fulop (2002); B03: Branston et al. (2003)Figure 3.4: Influence <strong>of</strong> cyclic loading.
124 Chapter IIIFigure 3.5: Cyclic response for OSB 4-8 US C-A test performed by Branston et al. (2003).3.2.6 Construction techniques and anchorage detailsThe study <strong>of</strong> the effect <strong>of</strong> construction techniques and anchorage detailshas been performed by Tarpy & Hauenstein (1978), Tarpy (1980), Tarpy &Girard (1982), NAHB Research Center (1997) and Gad et al. (1999a). Almostall the cited references highlight the important effect <strong>of</strong> the corner foundationanchorage details on the shear response <strong>of</strong> steel stud walls. In fact, if the upliftloads are not directly transmitted from the end studs to the foundation by rigidattachment as such as clip angles or hold-downs, then a significant bending <strong>of</strong>the bottom track occurs, up to failure with a reduced shear strength andstiffness.REFERENCESASTM E 564-76 (1976) Standard Practice for Static Load Test for <strong>Shear</strong> Resistance<strong>of</strong> Framed <strong>Walls</strong> for Buildings. ASTM (American Society for Testing and Materials).West Conshohocken, PA, USA.
Testing <strong>of</strong> cold-formed steel stud shear walls: review <strong>of</strong> existing literature 125AISI (1996) Builder’s <strong>Steel</strong>-<strong>Stud</strong> Guide. Publication RG-9607, AISI (American Ironand <strong>Steel</strong> Institute). Washington DC.Brantson, A., Boudreault, F., Rogers, C.A. (2003) Testing on steel frame / woodpanels shear walls. Progress Report, Departement <strong>of</strong> Civil Engineering and AppliedMechanics, McGill University. Montreal.COLA-UCI (2001) Report <strong>of</strong> a testing program <strong>of</strong> light-framed walls with woodsheathedshear panels. Final report to the City <strong>of</strong> Los Angeles Department <strong>of</strong>Building and Safety, Structural Engineers Association <strong>of</strong> Southern California. Irvine,CA, USA.Dubina, D. & Fulop, L.A. (2002) <strong>Seismic</strong> performance <strong>of</strong> wall-stud shear walls. InProceedings <strong>of</strong> the 16 th International Specialty Conference on <strong>Cold</strong>-formed <strong>Steel</strong>Structures. St. Louis, MO, USA: 483-500.Gad, E.F., Duffield, C.F., Hutchinson, G.L., Mansell, D.S., Stark, G. (1999a) Lateralperformance <strong>of</strong> cold-formed steel-framed domestic structures. EngineeringStructures, Elsevier, Vol.21, No.1: 83-95.Gad, E.F., Chandler, A.M., Duffield, C.F., Stark, G. (1999b) Lateral behaviour <strong>of</strong>plasterboard-clad residential steel frames. Journal <strong>of</strong> Structural Engineering, ASCE,Vol.125, No.1: 32-39.McCreless, S. & Tarpy, T.S. (1978) Experimental investigation <strong>of</strong> steel stud shearwall diaphragms. In Proceedings <strong>of</strong> the 4 th International Specialty Conference on<strong>Cold</strong>-formed <strong>Steel</strong> Structures. St. Louis, MO, USA: 647-672.NAHB Research Center (1997) Monotonic Tests <strong>of</strong> cold-formed steel shear wallswith openings. (NAHB) National Association <strong>of</strong> Home Builders. Upper Marlboro,MD, USA.Salenikovich, A.J., Dolan, J.D., Easterling, W.S. (2000) Racking performance <strong>of</strong> longsteel-frame shear walls. In Proceedings <strong>of</strong> the 15 th International Specialty Conferenceon <strong>Cold</strong>-formed <strong>Steel</strong> Structures. St. Louis, MO, USA: 471-480.Serrette, R. (1994) Light gauge steel shear wall test. Light Gauge <strong>Steel</strong> ResearchGroup, Department <strong>of</strong> Civil Engineering, Santa Clara University. Santa Clara, CA,USA.Serrette, R.L. & Ogunfunmi, K. (1996) <strong>Shear</strong> resistance <strong>of</strong> gypsum-sheathed lightgaugesteel stud walls. Journal <strong>of</strong> structural engineering, ASCE, Vol.122, No.4: 386-389.Serrette, R., Nguyen, H., Hall, G. (1996a) <strong>Shear</strong> wall values for light weight steelframing. Report No.LGSRG-3-96, Light Gauge <strong>Steel</strong> Research Group, Department <strong>of</strong>Civil Engineering, Santa Clara University. Santa Clara, CA, USA.
126 Chapter IIISerrette, R., Hall, G., Nguyen, H. (1996b) Dynamic performance <strong>of</strong> light gauge steelframed shear walls. In Proceedings <strong>of</strong> the 13 th International Specialty Conference on<strong>Cold</strong>-formed <strong>Steel</strong> Structures. St. Louis, MO, USA: 487-498.Serrette, R.L., Encalada, J., Juadines, M., Nguyen, H. (1997a) Static racking behavior<strong>of</strong> plywood, OSB, gypsum, and fiberboard walls with metal framing. Journal <strong>of</strong>Structural Engineering, ASCE, Vol.123, No.8: 1079-1086.Serrette, R., Encalada, J., Matchen, B., Nguyen, H., Williams, A. (1997b) Additionalshear wall values for light weight steel framing. Report No.LGSRG-1-97, LightGauge <strong>Steel</strong> Research Group, Department <strong>of</strong> Civil Engineering, Santa ClaraUniversity. Santa Clara, CA, USA.Sugiyama, H & Matsumoto, T. 1984. Empirical equations for the estimation <strong>of</strong>racking strength <strong>of</strong> plywood-sheathed shear walls with openings. Summaries <strong>of</strong>Technical Papers <strong>of</strong> Annual Meeting, Transactions <strong>of</strong> the Architectural Institute <strong>of</strong>Japan, No.338.Tarpy, T.S. (1980) <strong>Shear</strong> resistance <strong>of</strong> steel-stud wall panels. In Proceedings <strong>of</strong> the5 th International Specialty Conference on <strong>Cold</strong>-formed <strong>Steel</strong> Structures. St. Louis,MO, USA: 331-348.Tarpy, T.S. & Girard, J.D. (1982) <strong>Shear</strong> resistance <strong>of</strong> steel-stud wall panels. InProceedings <strong>of</strong> the 6 th International Specialty Conference on <strong>Cold</strong>-formed <strong>Steel</strong>Structures. St. Louis, MO, USA: 449-465.Tarpy, T.S. & Hauenstein, S.F. (1978) Effect <strong>of</strong> construction details on shearresistance <strong>of</strong> steel-stud wall panels. Vanderbilt University. Nashville, TN, USA. Aresearch project sponsored by American Iron and <strong>Steel</strong> Institute. Project No.1201-412.Tissell, J.R. (1993) Wood structural panel shear walls. Report No.154, APA (TheEngineering Wood Association). Tacoma, WA, USA.
127Chapter IVEvaluation <strong>of</strong> seismic capacity:the monotonic testThe number <strong>of</strong> experimental tests, which have been performed to study thelateral behavior <strong>of</strong> cold-formed steel stud shear walls (CFSSSWs) is ratherwide. The basic factors that influence the shear response <strong>of</strong> CFSSSWs havebeen objects <strong>of</strong> previous studies, as presented in Chapter 3. Although theexisting experimental database appears sufficient, there has been littleresearch on the lateral-load transfer from the horizontal diaphragms to studwalls. The same consideration applies for the influence <strong>of</strong> construction details,such as bearing stiffeners and joist track pr<strong>of</strong>iles, anchorage details,connections between joists, bearing stiffeners, joist track and top stud track.Moreover, there has not been specific study on the effect <strong>of</strong> gravity loads onthe shear walls behavior even if it may be anticipated to be small. For thisreason, an experimental phase based on two identical stud shear wall subassemblies,tested under both monotonic and cyclic loading has beendedicated to evaluate the seismic capacity.In this Chapter, the following Section (Section 4.1) is dedicated to definethe study case and the relevant assumptions. In the Section 4.2 the generaldesign principles are presented. The experimental program is illustrated inSection 4.3. In particular, for both monotonic and cyclic tests the description<strong>of</strong> test specimens, the test set-up and instrumentation are presented in Sections4.3.1 through 4.3.3. While the Section 4.3.4 is devoted to illustrate the testprocedure for the only monotonic test. Finally, the test results for themonotonic test are presented in Section 4.4.
128 Chapter IV4.1 THE STUDY CASE: BASIC ASSUMPTIONSThe study case examined is a typical one-family one-story dwelling as thatshows in Figure 4.1. The plan dimensions <strong>of</strong> the house are about 7 x 11m,while its height is about 6m. The assumptions on the main dimensions <strong>of</strong> thestructure are presented in Table 4.1.The structure is a stick-built construction in which both horizontal (ro<strong>of</strong>and floors) and vertical (walls) diaphragms are cold-formed frames sheathedwith structural panels.L=11.4mW=7.0m(a) first floorNW=6.4m(b) east elevationFigure 4.1: Typical analyzed stick-built house.
Evaluation <strong>of</strong> seismic capacity: the monotonic test 129Number <strong>of</strong> stories (n) 2Length (L)11.4 mWide (W)7.0 mHeight (H)6.4 mRo<strong>of</strong> slope 100%Area (A) 75 m 2Table 4.1: Main structural dimension.ElementUnit loadro<strong>of</strong> 0.75 kN/m 2floor 0.75 kN/m 2walls 0.35 kN/m 2Table 4.2: Unit dead loads.According to the units load reported in Table 4.2, the assumedcharacteristic gravity loads, to be considered for computing the lateral seismicforces, are: dead loads: g k = 2.2 kN/m 2 (including ro<strong>of</strong>, floor and walls); snow loads: q ks = 0.5 kN/m 2 ; live loads: q kl = 2.0 kN/m 2 ;As it may be observed by comparison between dead, snow and live loadvalues, the great advantage <strong>of</strong> this structural typology is the lightness. In factthe dead loads represent only about 50% <strong>of</strong> the total load.Therefore, according to rules given in Eurocode 1 – Part 1 (ENV 19911996) for the loads that must be considered acting together with seismic loads,dead and live loads are combined in this way:wk gk EIqks qkl= 3.0 kN/m 2 (4.1)in which:w k :is the seismic weight; EI = 0.3 is the combination coefficient.For the choice <strong>of</strong> the seismic area, it is assumed that the house is located ina medium seismic zone in Central Italy (design value <strong>of</strong> the peak groundacceleration a g =0.25g). The soil conditions assumed are, according to
130 Chapter IVclassification <strong>of</strong> the Eurocode 8 (prEN 1998-1 2001): (A) rock; (B) stiff soil;(C) s<strong>of</strong>t soil; (D) very s<strong>of</strong>t soil; and (E) alluvium soil. Finally, the Type 1 (farfield) design elastic spectrum S aed (T) reported in Eurocode 8 is adopted: T Saed( T ) ag S1 2.5 1 if 0 T T B TBSaed ( T ) ag S 2.5if T B T T C (4.2) TCSaed ( T ) ag S 2. 5 T if T C T T D TCTDSaed ( T ) ag S 2.52 T if T T Dwhere:S aed (T):is the design elastic spectrum acceleration;T: is the first mode vibration period;S: is the soil factor;: is the damping factor (=1 for a damping ratio =0.05)a g :is the design peak ground acceleration;T B and T C : are the limits <strong>of</strong> constant spectral acceleration branch;T D :is the value that defines the beginning <strong>of</strong> the constantdisplacement response range.The factors S, T B , T C , and T D , for the horizontal direction are reported inTable 4.3.Soil type S T B T C T DA 1.00 0.15 0.4 2.0B 1.20 0.15 0.5 2.0C 1.15 0.20 0.6 2.0D 1.35 0.20 0.8 2.0E 1.40 0.15 0.5 2.0Table 4.3: Values <strong>of</strong> parameters describing the Eurocode 8 Type 1 elastic response spectrum.For the purpose <strong>of</strong> seismic analysis the following hypotheses are adopted: the ground motion acting in North-South direction (see Fig. 4.1); the floor and ro<strong>of</strong> sheathings act as rigid diaphragms; the possible torsional effects are neglected;
Evaluation <strong>of</strong> seismic capacity: the monotonic test 131the dynamic lateral behavior <strong>of</strong> the structure is represented by thedynamic lateral behavior <strong>of</strong> the walls;the “Segment” method is used for describing the shear behavior <strong>of</strong> theCFSSSWs, assuming that the sum <strong>of</strong> the length <strong>of</strong> the full height wallsegments (w i ) in North-South direction is w i =18.0m;the dynamic lateral behavior <strong>of</strong> the CFSSSWs is described by a SDOFsystem;the acting lateral force corresponding to design seismic action shouldbe less than the force corresponding to the elastic limit state <strong>of</strong> theCFSSSWs.According to the listed assumptions, it is possible to define basicparameters <strong>of</strong> the SDOF system representing a piece <strong>of</strong> wall with unit length(1m). In fact, the seismic weight per unit length (w s ) results:wk Aws = 12.5 kN/m (4.3) wiand, considering the following lateral stiffness per unit length (k) (Gad et al.1999):k = 0.5 – 3.0 kN/mm/m (4.4)it is possible to compute the natural vibration period (T) <strong>of</strong> the SDOF:ws gT 2/ = 0.1 – 0.3 s (4.5)kFinally, a damping ratio =0.05 is adopted.4.2 GENERAL DESIGN PRINCIPLESThe structure has been designed in accordance with the PrescriptiveMethod For Residential <strong>Cold</strong>-<strong>Formed</strong> <strong>Steel</strong> Framing (NASFA 2000).The wall height <strong>of</strong> the example house is 2500mm. <strong>Stud</strong>s are made <strong>of</strong>100x50x10x1.00mm (web depth x flange size x lip size x thickness) C(channel lipped)-section, while joists consist <strong>of</strong> 260x40x10x1.50mm C-section. The studs and the joists are spaced 600mm on center. The walls aresheathed with 9.0mm thick oriented strand board (OSB) external panels and12.5mm thick gypsum wallboard (GWB) internal panels. The floor sheathings
132 Chapter IVare made <strong>of</strong> 18.0mm thick OSB panels. The panel-to-wall framingconnections are 4.2x25mm self-drilling flat head screws for the OSB panelsand 3.5x25mm self-drilling bugle head screws for GWB panels.All CFSSSW components (steel members, panels and connections) aredesigned according to capacity design principles, in such a way to promote thedevelopment <strong>of</strong> the full shear strength <strong>of</strong> panel-to-wall framing connections.For determining the panel-to-wall framing connections spacing, the lateralforce (v S ) acting on a wall with unit length may by calculated by the followingformula:vS Saed( T ) ws(4.6)in which the weight per unit length is w s =12.5 kN/m (from Eq. 4.3), a g =0.25,=1, and the design elastic spectrum acceleration (S aed (T)) may be obtainedfrom Equation 4.2 for different soil types, as reported in Figure 4.2.Considering the natural vibration period T ranging from 0.1 to 0.3s (accordingto Eq. 4.5), the maximum values <strong>of</strong> the design elastic spectrum acceleration(S aed (T=0.1-0.3s) max ) and corresponding lateral force values may be obtained,as reported in Table 4.4.Finally, considering the maximum value <strong>of</strong> the acting lateral force(v S =11kN/m), panel-to-wall framing connections spaced at 150mm at theperimeter and at 300mm in the field may be adopted. In fact, for this fastenerspacing, the estimated lateral strength is about v R =18kN/m, while the forcecorresponding to the elastic limit state is about v E = v R / 1.5 = 12kN/m.All calculations are shown in detail in Appendix C.
Evaluation <strong>of</strong> seismic capacity: the monotonic test 1331.00.9Saed(T) / g0.8E0.70.60.5CD0.40.30.2AB0.1T [s]0.00.0 0.1 0.2 0.3 0.4 0.5 0.6 0.7 0.8 0.9 1.0 1.1 1.2 1.3 1.4 1.5 1.6 1.7 1.8 1.9 2.0Figure 4.2: Eurocode 8 Type 1 elastic spectrum acceleration.Soil type Saed(T=0.1-0.3s) max / g v S (kN/m)A 0.63 7.9B 0.75 9.4C 0.72 9.0D 0.84 10.5E 0.88 11.0max 0.88 11.0Table 4.4: Maximum elastic spectrum acceleration and corresponding lateral force values.4.3 TEST PROGRAMAlthough the existing experimental database is rather wide, there has beenlittle research on the lateral-load transfer from the horizontal diaphragms tostud walls. The same consideration applies for the influence <strong>of</strong> constructiondetails, such as bearing stiffeners and joist track pr<strong>of</strong>iles, anchorage details,connections between joists, bearing stiffeners, joist track and top stud track.Moreover, there has not been specific study on the effect <strong>of</strong> gravity loads onthe shear walls behaviour even if it may be anticipated to be small.
134 Chapter IVFor this reason, the main part <strong>of</strong> the experimental program has been basedon two full-scale identical CFSSSW sub-assemblies, tested under bothmonotonic and cyclic loading.4.3.1 Description <strong>of</strong> test specimensThe generic specimen <strong>of</strong> the stud shear wall sub-assembly is shown inFigures 4.3 a and b. In particular, Figure 4.3a provides a drawing <strong>of</strong> thegeneric specimen, while Figure 4.3b shows a picture <strong>of</strong> its set-up.The sub-assembly is a satisfactory model <strong>of</strong> the typical lateral loadresisting systems <strong>of</strong> house structures braced with CFSSSWs and sheathed withstructural panels. Typical construction details are shown in Figures 4.4 and4.5. In particular, Figure 4.4a illustrates a drawing <strong>of</strong> the detail <strong>of</strong> thefoundation anchorage <strong>of</strong> the end studs; besides the installation <strong>of</strong> the holddownconnector is shown in Figure 4.4b. Figure 4.5 shows, instead, the detail<strong>of</strong> the connections between floor joists and wall studs.The specimen was designed in accordance with general design principlesgiven in the Section 4.3. In fact, the generic wall framing, which was 2400mmlong and 2500mm height, consisted <strong>of</strong> single top and bottom tracks made <strong>of</strong>100x40x1.00mm (web depth x flange size x thickness) U (unlipped)-sectionsand both single intermediate and double back-to-back end studs, made <strong>of</strong>100x50x10x1.00mm (web depth x flange size x lip size x thickness) C(lipped)-sections, spaced 600mm on center. The floor framing consisted <strong>of</strong>260x40x10x1.50mm C-section joists, which were spaced 600mm on center,with single span <strong>of</strong> 2000mm and <strong>of</strong> 260x40x1.00mm U-section tracks.
Evaluation <strong>of</strong> seismic capacity: the monotonic test 135(a) Drawing <strong>of</strong> specimens(b) Set-up <strong>of</strong> specimensFigure 4.3: Global 3D view <strong>of</strong> the generic sub-assembly.end studhold-downconnectorhold-downanchorintermediatestudshearanchorstud trackX-bracing(a) Drawing <strong>of</strong> detail <strong>of</strong> foundation anchorages(b) installation <strong>of</strong> a hold down connectorFigure 4.4: A close-up view <strong>of</strong> the connection between end studs and foundation.joist trackfloor OSBpanelbearingstiffenerstud trackend studjoistX-bracingwallOSB panelwallGWB panelFigure 4.5: A close-up view <strong>of</strong> the connection between the floor joists and the wall studs.
136 Chapter IVAll frame members were cold-formed and fabricated from FeE350G(S350GD+Z/ZF) hot dipped galvanized (zinc coated) (EN 10142 2002) Gradesteel (nominal yield strength f y =350MPa and nominal tensile strengthf t =420MPa). The used cold-formed steel (CFS) pr<strong>of</strong>iles were manufactured bythe Company GUERRASIO (Roccapiemonte, Salerno, Italy). They are shownin Figure 4.6.Wall and floor external sheathings were made <strong>of</strong> Type 3 oriented strandboard (OSB/3) (EN 300 1997), which were manufactured by the CompanyKRONO FRANCE. The thicknesses <strong>of</strong> the wall and floor OSB sheathingswere 9.0 and 18.0mm, respectively. The internal sheathings <strong>of</strong> the wall weremade <strong>of</strong> 12.5mm thickness gypsum wallboards (GWB) (ISO 6308 1980),which were manufactured by the Company BPB ITALIA. The sheathingorientation was always vertical. Both OSB and GWB sheathings are shown inFigure 4.7 a and b, respectively.The fasteners adopted for the frame (steel-to-steel) connections were4.2x13mm (diameter x length) self-drilling modified-truss head screws. Forthe stud-to-OSB and stud-to-GWB sheathing connections, 4.2x25mm selfdrillingflat head screws and 3.5x25mm self-drilling bugle head screws wereused, respectively. These screws were spaced at 150mm at the perimeter andat 300mm in the field. 4.2x38mm self-drilling flat head screws were adoptedfor joist-to-OSB sheathing connections. The screws, which were used toassemble the specimens, are shown in Figure 4.8. They were manufactured bythe Company TECFI s.r.l. (Villaricca, Naples, Italy).The foundation was simulated by two 280x380mm (depth x width)rectangular concrete beams. The walls were connected to the foundation byintermediate shear anchors and purposely-designed welded steel hold-downconnectors were used at the end studs (see Fig. 4.9). In particular, as shearanchors 8.0mm diameter mechanical anchors were employed (see Fig. 4.10a),while adhesive-bonded anchors were adopted to connect the hold-downconnectors with the foundation (see Fig. 4.10b). Both the used mechanical andadhesive-bonded anchors were manufactured by the Company HILTIITALIA.
Evaluation <strong>of</strong> seismic capacity: the monotonic test 137(1) (2) (3) (4) (5)(1) bearing stiffener; (2) stud; (3) stud track;(4) joist; (5) joist track.Figure 4.6: CFS pr<strong>of</strong>iles (manufactured by GUERRASIO).(2)(1)(a) (1) OSB wall sheathing; (2) OSB floor sheathingmanufactured by KRONO FRANCE(b) GWB sheathing manifactured by BPB ITALIAFigure 4.7: Sheathings.(1) (2) (3) (4)(1) 3.5x25mm bugle head; (2) 4.2x32mm flat head; (3)4.2x25mm flat head; (4) 4.2x13mm modified truss head.Figure 4.8: Self-drilling screws (manufactured by TECFI s.r.l.).
138 Chapter IVFigure 4.9: Hold-down connector.(1)(2)HST M8 mechanical anchorsAdhesive-bonded anchors(1) HIT-RE 500; (2) HIS-N(8.8) M20 3.5x25mm bugle head.Figure 4.10: (a) shear and (b) hold-down anchors (manufactured by HILTI ITALIA).All the components <strong>of</strong> the stud shear wall sub-assembly (members,sheathings and connections) have been designed according to capacity designprinciples, in such a way to promote the development <strong>of</strong> the full shear strength<strong>of</strong> sheathing-to-wall framing connections. For this reason, the shear anchorsand the hold-down connectors have been designed to prevent either shearfailure at the base <strong>of</strong> the walls or failure due to overturning. Besides, doublelipped C-sections at the ends <strong>of</strong> the walls have been adopted to avoid failuredue to buckling in end studs.
Evaluation <strong>of</strong> seismic capacity: the monotonic test 139Global transverse stability <strong>of</strong> the sub-assembly was achieved by means <strong>of</strong>pre-tensioned steel round bar X-bracing (see Figures 4.3a, 4.4a and 4.5).Main details <strong>of</strong> the specimen components are given in Table 4.5, whereasdrawings <strong>of</strong> the main construction details <strong>of</strong> the sub-assembly specimen arereported in Appendix D.<strong>Cold</strong> formed steel (CFS) membersFeE350G (S350GD+Z/ZF) hot dipped galvanized (zinc coated) steel<strong>Steel</strong> grade(Nominal yield strength f y =350MPa; nominal tensile strength f t =420MPa)<strong>Stud</strong>sC 100x50x10x1.00mm (2400mm long) (by GUERRASIO)Wall membersTracksU 100x40x1.00mm (2700mm long) (by GUERRASIO)JoistC 260x40x10x1.50mm (2200mm long) (by GUERRASIO)FloortracksU 260x40x1.00mm (2700mm long) (by GUERRASIO)membersBearing stiffeners C 100x50x10x1.00mm (260mm long) (by GUERRASIO)Sheathings1200x2500x12.5mm (width x height x thickness) GWB vertically orientedInteriorWall(PLACOLAST PLACO by BPB ITALIA)sheathings1250x2500x9.0mm Type 3 OSB vertically oriented (KRONOPLY 3 byExteriorKRONO FRANCE)1250x2500x18.0mm Type 3 OSB vertically oriented (KRONOPLY 3 byFloor sheathingKRONO FRANCE)Concrete beams foundationConcrete type C20/25 (characteristic strength on a cube 150x150x150mm f ck,cube =25MPa)Dimensions 380x280mm rectangular section (3590mm long)Frame-to-foundation connectionsHold-downPurposely-designed welded steel hold-downconnectorHold-down anchors HIT-RE 500 with HIS-N(8.8) M20 adhesive-bonded anchors (by HILTI ITALIA)<strong>Shear</strong> anchors HST M8 mechanical anchors (by HILTI ITALIA) spaced at 100mm<strong>Steel</strong>-to-steel connections4.2x13mm (diameter x lenght) modified truss head self drilling screws (byCFS membersTECFI s.r.l.)CFS members-to-hold6mm diameter boltsdown connector<strong>Steel</strong>-to-Sheathing connections3.5x25mm bugle head self drilling screws (by TECFI s.r.l.) spaced atInterior150mm at the perimeter and at 300mm in the field<strong>Walls</strong>4.2x25mm flat head self drilling screws (by TECFI s.r.l.) spaced at 150mmExteriorat the perimeter and at 300mm in the field4.2x32mm flat head self drilling screws (by TECFI s.r.l.) spaced at 150mmFloorfor sheathing-to-track connections and at 250mm for sheathing-to-joistconnectionsTable 4.5: Full-scale specimen materials and construction data.
140 Chapter IV4.3.2 Test set-upTwo types <strong>of</strong> load were applied: gravity and racking loads.The CFSSSW sub-assembly simulated a section <strong>of</strong> a rectangular house withplan dimension equal to a x b = 3.6x4.2m. The applied total gravity load wasequal to 45kN. This load was equivalent to dead (including ro<strong>of</strong>, floor andwalls), snow and live loads applied to the plan area, it being: w k x a x b =3.0x3.6x4.2=45kN, where w k is the seismic weight (see Eq. 4.1).Racking loads were uniformly applied to the floor by means <strong>of</strong> twoprogrammable servo-hydraulic actuators (MTS System Corporation), each onecharacterised by a range <strong>of</strong> displacement <strong>of</strong> 500mm and a load capacity <strong>of</strong>500kN. The concentrated actuators’ loads were transformed into a distributedload applied to the floor panels by means <strong>of</strong> a purposely-designed loadtransfer system that is shown in Figure 4.11. It consisted <strong>of</strong> transversal andlongitudinal hot rolled members. In particular, four CPN100 transversalpr<strong>of</strong>iles were positioned over the floor sheathings, while the transversalmembers placed lower down the floor sheathings were two CNP100 (externalpr<strong>of</strong>iles) and two flat straps (internal pr<strong>of</strong>iles). The upper and bottomtransversal members were bolted back-to-back using two 8.0mm diameterbolts spaced at 250mm on center. In such a way the transversal pr<strong>of</strong>ile and thefloor sheathings were closely connected together. As longitudinal membersfour HEA100 (two for each side) pr<strong>of</strong>iles were used. These pr<strong>of</strong>iles werebolted with the transversal pr<strong>of</strong>ile using four 14mm diameter bolts for eachjoint, as illustrated in Figure 4.11.The load actuators were restrained to keep the horizontal position and asliding-hinge is placed between the load actuator and the ends part <strong>of</strong> thelongitudinal members, in order to act as a filter transferring to the structureexclusively horizontal racking loads. This testing apparatus allowed thecapacity <strong>of</strong> the floor to transmit forces to the walls to be checked, up to failure<strong>of</strong> the vertical stud-to-sheathing connections. The Figure 4.12 shows theglobal view <strong>of</strong> the test set-up.
Evaluation <strong>of</strong> seismic capacity: the monotonic test 141HEA100CNP100No. 2 - 8mmdiameter boltsspaced at 250mmon centerNo. 4 -14mmdiameterboltsHEA100CNP100Flat strap100x6mmFigure 4.11: Load transfer system.
142 Chapter IVFigure 4.12: Test set-up.4.3.3 InstrumentationFourteen linear variable differential transducers (LVDTs) were used tomeasure displacements <strong>of</strong> the specimens during the tests, as shown in Figures4.13 a and b. In particular, five LVDTs were installed for each wall (Fig.4.13a): LVDTs w1 was used to measure the horizontal displacements at thetop <strong>of</strong> the wall (lateral in-plane displacement); LVDTs w2 and w3 measuredthe horizontal displacements at the bottom <strong>of</strong> the wall (lateral in-planesliding); LVDTs w4 and w5 measured the vertical displacements at the bottom<strong>of</strong> the wall (uplift and compression). One LVDT (f1) was installed for eachfoundation beam (Fig. 4.13a) to measure the horizontal displacement. Finally,two LVDTs (d1 and d2) were installed on the floor (Fig. 4.13b) to measure thelateral longitudinal displacements.The horizontal displacements <strong>of</strong> the floor (d1 and d2) and walls (w1, w2and w3) were measured using LVDTs with a range <strong>of</strong> displacement <strong>of</strong> 250mmand an accuracy <strong>of</strong> 0.02mm. For measuring the horizontal displacements <strong>of</strong>the foundations (f1 and f2) LVDTs with a range <strong>of</strong> displacement <strong>of</strong> 100mm
Evaluation <strong>of</strong> seismic capacity: the monotonic test 143and an accuracy <strong>of</strong> 0.01mm were used. Finally, the vertical displacements <strong>of</strong>the walls (w4 and w5) were measured using LVDTs with a range <strong>of</strong>displacement <strong>of</strong> 20mm and an accuracy <strong>of</strong> 0.01mm. All LVDTs used for thistesting program were Penny & Giles Controls.Only for a wall (wall 2), two clinometers with a range <strong>of</strong> measuring <strong>of</strong> 20°and an accuracy <strong>of</strong> 0.02° (i1 and i2) were used to measure the angle betweenthe end studs at the bottom <strong>of</strong> the wall and the horizontal plane.The load was measured through the actuator load cells.Data was acquired at 20Hz (one data point every 0.05 seconds).aw1a2Wall 2d2w4w5w2i1(a) <strong>Walls</strong>actuator load (No. 2)LVDT (No. 14)inclinometer (No. 2)i2w3f1a1Wall 1(b) Floord1Figure 4.13: Instrument arrangement.4.3.4 Test procedure for the monotonic testIn the monotonic loading regime, the specimen was subjected to progressivehorizontal deflection. In particular, the loading procedure for the monotonictest was articulated in two phases.In the first phase, to evaluate the permanent set at 2, 4, 6 and 10mm, thespecimen were unloaded at these displacements. In the second phase, thespecimen was loaded up to a displacement <strong>of</strong> 150mm without unloaded. Thistest protocol involved displacements at rate <strong>of</strong> 0.10mm/s for displacementsless than 10mm and at rate <strong>of</strong> 0.20mm/s for displacement exceeded 10mm.
144 Chapter IV4.4 TEST RESULTSThe measured responses <strong>of</strong> all instruments are reported in Appendix E.The global behavior <strong>of</strong> the CFSSSW sub-assembly under monotonicracking loads may be represented through the relationship between themeasured unit shear resistance (v) and the mean displacement (d) <strong>of</strong> thespecimen. In particular, the value <strong>of</strong> v and d are defined as:V1 V2v (4.7)L td 1 dd 2(4.8)2where:V 1 and V 2 : are the forces measured by the actuators a1 and a2, respectively;d 1 and d 2 : are the displacements measured by the actuators a1 and a2,respectively;L t =4.800m: is the total length <strong>of</strong> the walls.The v-d response curve is showed in Figure 4.14.In the same Figure the values <strong>of</strong> the experimental lateral strength(v EXP =18.5kN/m), estimated lateral strength (v R =17.9kN/m) and acting seismicforce (v S =11.0kN/m) are also reported. From the comparison between theexperimental and the estimate lateral strength, it is possible to observe that thecalculation <strong>of</strong> the shear strength using the semi-empirical methodologiesillustrated in the Chapter 2 (developed in detail in Appendix C for the studycase) appears to be valid, it revealing a small conservative prediction <strong>of</strong> 3%.
Evaluation <strong>of</strong> seismic capacity: the monotonic test 1452Experimental lateral strength (v EXP = 18.5kN/m)Estimate lateral strength (v R = 17.9kN/m)1Acting seismic force (v S = 11.0kN/m)34Figure 4.14: Unit shear resistance (v) vs. mean displacement (d) curve.In Figure 4.14 the following significant load steps are represented: Step 1: lateral displacement equal to 10mm. At this step, in OSBsheathings-to-frame connections the tilting <strong>of</strong> the screws about theplane <strong>of</strong> the stud flange started, while for the GWB sheathings-t<strong>of</strong>rameconnections the bearing <strong>of</strong> the GWB panels begun. At thisdisplacement level, the deformations <strong>of</strong> walls as well as the localdeformation <strong>of</strong> the sheathing-to-frame connections were not evident,as shown in Figure 4.15. Step 2: maximum shear resistance (lateral displacement equal to36mm). At this load step the tilting <strong>of</strong> the screws in the OSBconnections, as well as the bearing in the GWB panels were evident, asshown in Figures 4.16 b and c, respectively. Also the globaldeformation <strong>of</strong> walls was clearly observable, as shown in Figure 4.16a. Step 3: lateral displacement equal to 80mm. At this displacement level,in both the OSB and GWB-to-frame connections the screw headsinitiated to pull through the sheathings, as shown in Figures 4.17 c andd. At this point, due to the rotation <strong>of</strong> the sheathings, the upper sides <strong>of</strong>
146 Chapter IVthe GWB panels knocked against the joist, as shown in Figure 4.17b.Probably this phenomenon produced a residual shear resistance(constant shear force for displacement varying from 70 to 110mm).Step 4: lateral displacement equal to 130mm. At this step, the screwheads had completely pulled through the sheathings, as shown inFigures 4.18 c and d. As a consequence, the sheathings werecompletely unzipped along the panel edges, as shown in Figure 4.18b.(a) Deformation <strong>of</strong> the Wall(b) Deformation <strong>of</strong> the OSB connections(c) Deformation <strong>of</strong> the GWB connectionsFigure 4.15: Specimen condition at Step 1(d=10mm).For all displacement levels, the evolution <strong>of</strong> the deformation <strong>of</strong> thespecimen was coherent with the sheathing-to-wall framing connectionsfailure. In fact, wall framing deformed into a parallelogram and the sheathingshad rigid body rotation, as shown in Figures 4.15a, 4.16a, 4.17a and 4.18a.Moreover, any buckling phenomenon was not observed for the studs as wellas deformations <strong>of</strong> the OSB sheathing-to-floor framing connections were notobserved during the testing. On the contrary, for floor tracks, a local bucklingphenomenon occurred for lateral displacement larger than about 30mm.
Evaluation <strong>of</strong> seismic capacity: the monotonic test 147Finally, both the shear and the tension anchors did not suffer any type <strong>of</strong>failure.(a) Deformation <strong>of</strong> the wall(b) Deformation <strong>of</strong> the OSB connections(c) Deformation <strong>of</strong> the GWB connectionsFigure 4.16: Specimen condition at Step 2 (maximum shear resistance - d=36mm).
148 Chapter IV(a) Deformation <strong>of</strong> the wall(b) GWB panel-to-joist contact(c) Deformation <strong>of</strong> the OSB connections(d) Deformation <strong>of</strong> the GWB connectionsFigure 4.17: Specimen condition at Step 3 (d=80mm).
Evaluation <strong>of</strong> seismic capacity: the monotonic test 149(a) Deformation <strong>of</strong> the wall(b) Unzipping(c) Deformation <strong>of</strong> the OSB connections(d) Deformation <strong>of</strong> the GWB connectionsFigure 4.18: Specimen condition at Step 4 (d=130mm).
150 Chapter IVThe Figure 4.19 shows the force (V) vs. displacement (d) response curvesfor the two tested walls. In particular, force vs. displacement curves obtainedfrom measures <strong>of</strong> the actuators a1 and a2 have been reported for the walls 1and 2, respectively. From the comparison <strong>of</strong> lateral responses <strong>of</strong> two wallssome interesting observations are possible:the walls had the same behavior for displacements less than about30mm (displacement for which the applied load approached themaximum shear resistance), while they exhibited different response forlarger displacements; the maximum shear resistances were 47 and 44kN for wall 1 and 2,respectively; therefore, the wall 1 was more resistant than wall 2 <strong>of</strong>about 7%.The measure <strong>of</strong> all horizontal LVDTs placed on the specimen in terms <strong>of</strong>force vs. horizontal displacement relationships are illustrated in Figures 4.20 aand b. In particular, the Figure 4.20a shows the force measured from theactuator a1 as a function <strong>of</strong> the displacements recorded by the LVDTs locatedon the side <strong>of</strong> the wall 1 (LVDTs a1; d1; w1,1; w1,2; w1,3 and f1), while theforce measured from the actuator a2 as a function <strong>of</strong> the displacementsrecorded by the LVDTs located on side <strong>of</strong> the wall 2 (LVDTs a2; d2; w2,1;w2,2; w2,3; f2) are shown in Figure 4.20b. From the examination <strong>of</strong> theseFigures, for both walls it is possible to observe that: the anchorage between the beam foundations <strong>of</strong> the specimen and thelaboratory floor was full effective; in fact the displacements measuredby LVDTs f1 and f2 were slight (displacements less than 0.2mm); the load transfer system between the load actuators and the floor <strong>of</strong> thespecimen was effective; in fact the difference between thedisplacements recorded by actuators (a1 and a2) and those measuredby the LVDTs placed on the floor (d1 and d2) were slight(displacements less than 0.9mm); the load transfer system between the floor and the walls was effective;in fact, the floor-to-walls sliding was small; in particular, thedifference between the displacements measured by the LVDTs placedon the floor (d1 and d2) and those recorded by the LVDTs located onthe top side <strong>of</strong> the walls (w1,1 and w2,1) were less than 4mm.
Evaluation <strong>of</strong> seismic capacity: the monotonic test 151Figures 4.21 a and b show the forces measured from the actuators (a1 anda2 for Figures 4.21a and b, respectively) as a function <strong>of</strong> the verticaldisplacements recorded by the LVDTs located at the bottom side <strong>of</strong> the walls(w1,4; w1,5 and w2,4; w2,5 for Figures 4.21a and b, respectively). From theexamination <strong>of</strong> these curves, for both walls it is possible to observe that thevertical displacements measured on the tension side were larger than thoserecorded on the compression side. In particular, this behavior was moreevident for displacements less than those corresponding to the maximum shearresistance.Figure 4.19: <strong>Shear</strong> (V) vs. displacement (d) curves for wall 1 and wall 2.(a) wall 1 (b) wall 2Figure 4.20: <strong>Shear</strong> (V) vs. displacement (d) measured by horizontal LVDTs.
152 Chapter IV(a) wall 1(b) wall 2Figure 4.21: <strong>Shear</strong> (V) vs. displacement (d) measured by vertical LVDTs.4.5 REFERENCESEN 300 (1997) Oriented Strand Boards (OSB) - Definitions, Classification andSpecifications. CEN (European Committee for Standardization). Bruxelles.ENV 1991-1 (1996) Eurocode 1: Basis <strong>of</strong> Design and Actions on Structures – Part 1:Basis <strong>of</strong> Design. CEN (European Committee for Standardization). Bruxelles.EN 10142 (2002) Continuously hot-dip zinc coated low carbon steel sheet and stripfor cold forming. Technical delivery conditions. CEN (European Committee forStandardization). Bruxelles.Gad, E.F., Duffield, C.F., Hutchinson, G.L., Mansell, D.S., Stark, G. (1999) Lateralperformance <strong>of</strong> cold-formed steel-framed domestic structures. EngineeringStructures, Elsevier, Vol.21, No.1: 83-95.ISO (1980) Gypsum plasterboard – Specification. ISO (International Organization forStandardization). Geneva.NASFA (2000) Prescriptive Method For Residential <strong>Cold</strong>-<strong>Formed</strong> <strong>Steel</strong> Framing(Year 2000 Edition). NASFA (North American <strong>Steel</strong> Framing Alliance). Lexington,KY, USA.prEN 1998-1 (2001) Eurocode 8: Design <strong>of</strong> structures for earthquake resistance –Part 1: General rules – <strong>Seismic</strong> actions and rules for buildings. CEN (EuropeanCommittee for Standardization). Bruxelles.
153Chapter VEvaluation <strong>of</strong> seismic demandsAn experiment can provide only information on capacities, but, because <strong>of</strong>the strong interrelation between capacity and demand, due consideration mustbe given to seismic demand issues. This requires some significant problems tobe preliminarily solved: the development <strong>of</strong> reliable mathematical models <strong>of</strong> the hysteresisbehaviour <strong>of</strong> panel shear walls typical <strong>of</strong> light-gauge cold-formedframed constructions; the assessment <strong>of</strong> deformation demands under a sufficiently largedatabase <strong>of</strong> earthquake ground motions is needed.The need to carry out this type <strong>of</strong> statistical-numerical analysis derivesfrom the peculiar hysteresis behaviour <strong>of</strong> cold-formed steel stud shear wall(CFSSSW) systems, which are characterized by strong pinching and reducedductility. In fact, commonly performed studies on the evaluation <strong>of</strong> seismicdemand have been derived on the basis <strong>of</strong> a bilinear hysteresis assumption. Inthis Chapter, the calibration <strong>of</strong> a mathematical model, able to well interpretingthe hysteretic behavior <strong>of</strong> CFSSSWs’s response, is illustrated in Section 5.1.The evaluation <strong>of</strong> the seismic demand using the calibrated mathematicalmodel and some accelerograms <strong>of</strong> Central Italian earthquakes is presented theSection 5.2. Finally, because the applicability <strong>of</strong> the standard load histories toCFSSSW systems need to be verified, Section 5.3 is dedicated to define adeformation history for a cyclic testing.
154 Chapter V5.1 MODEL OF THE HYSTERETIC BEHAVIOR OF CFSSSWSYSTEMSOn the basis <strong>of</strong> experimental evidence <strong>of</strong> existing tests on CFSSSWsystems, a mathematical model, able to well interpret several behavioralaspects <strong>of</strong> their response, has been used (Della Corte et al. 1999). Inparticular, the proposed model is able to account for the following aspects <strong>of</strong>the mechanical cyclic behavior: non linearity; pinching.In the following, the mathematical formulation <strong>of</strong> the used model is firstlydescribed. Then, model parameters are calibrated for the simulation <strong>of</strong> someavailable experimental tests. The comparison between numerical andexperimental results shows the reliability <strong>of</strong> the model in capturing the stablepart <strong>of</strong> the hysteretic behavior. A this stage <strong>of</strong> the research the model is unableto describe the unstable part <strong>of</strong> the cyclic response.For describing the shear behavior <strong>of</strong> CFSSSWs, the relationship betweenshear force (V) and lateral displacement () is used.It is appropriate to preliminarily state some fundamental concepts,extensively used in the following. The basic parameter for the description <strong>of</strong> ageneric loading history is the deformation excursion, which is constituted by aloading branch and by the subsequent unloading branch <strong>of</strong> the V- path. Thedeformation range <strong>of</strong> excursion ( p ) is the deformation range between thebeginning and the peak deformation <strong>of</strong> the excursion (ATC 1992). As it willbe explained herein after, the beginning <strong>of</strong> a loading branch and the end <strong>of</strong> anunloading branch, always stand on a straight line passing through the originwith a slope equal to the one concerned with the hardening <strong>of</strong> the system, asshown in Figure 5.1.The adopted mathematical function for describing the shear behavior <strong>of</strong>CFSSSWs is introduced in two steps. In fact, the mathematical formulation isfirstly referred to systems without pinching effect. Then, pinching phenomenatypically present in the lateral behavior <strong>of</strong> these structures are introduced.
Evaluation <strong>of</strong> seismic demands 155Figure 5.1: Basic definitions (Della Corte et al. 1999).5.1.1 The loading branch without pinchingFor the description <strong>of</strong> the loading branch in absence <strong>of</strong> pinching, amathematical formulation proposed by Richard & Abbott (1975) has beenadopted. This formulation, expressed in terms <strong>of</strong> shear force (V) versus lateraldisplacement () relationship, can be written as follows:k0 khV kh(5.1)1n nk0kh1 V0 where:k 0 : is the initial stiffness <strong>of</strong> the system;k h : is the slope <strong>of</strong> the straight-line asymptote <strong>of</strong> the V- curve(hardening line);V 0 : is the intersection between V axis and hardening line;n: is a shape parameter, which regulates the sharpness <strong>of</strong> transitionfrom the elastic to the fully plastic behavior (increasing values <strong>of</strong> ncorrespond to an increasing sharpness).
156 Chapter VFigure 5.2 illustrates the graphical representation <strong>of</strong> the Richard-Abbottmathematical formulation, also reporting the meaning <strong>of</strong> adopted symbols.Besides to the parameters previously specified, the conventional yield andultimate limits need to be specified. In particular, the conventional yieldstrength is defined as the intersection between the straight-line with a slopeequal to k 0 going through the origin and the hardening line. The conventionalultimate strength is defined as the point corresponding to the maximum value<strong>of</strong> the shear force (limit <strong>of</strong> the stable part <strong>of</strong> the hysteretic behavior).Consequently it is possible to define the shear force (V y ) and displacement ( y )corresponding to the conventional yield point and the ultimate force (V u ) anddisplacement ( u ) corresponding to the conventional ultimate point, as shownin Figure 5.2.Numerical upper bound curveExperimental responseFigure 5.2: The loading branch without pinching.5.1.2 The loading branch with pinchingFor describing pinching, two limit curves are introduced, representing anupper bound and a lower bound to possible V- values, respectively. Bothcurves have a Richard-Abbot type law, with the following parameters:k 0 , V 0 , k h , n for the upper bound curve;
Evaluation <strong>of</strong> seismic demands 157k 0p , V 0p , k hp , n pfor the lower bound curve.A point (V, ) <strong>of</strong> the real path is considered to belong also to a Richard-Abbott type curve, whose, parameters are defined as follows:k k k k t(5.2)Vkn0t 0 p 00 p0t V0p V0V0phtpt t(5.3) k k k t(5.4)hphhp n n n t(5.5)pwhere the parameter t, ranging in [0, 1], defines the transition law from thelower bound to the upper bound curve. Its mathematical formulation is to bedefined in such a way to reproduce the shape <strong>of</strong> the curve as experimentallyobserved. In the proposed model, in order to describe a pinching-typebehavior, parameter t is defined by the following relationship:2 / limt (5.6) / limin which, t 1 , t 2 and lim are three additional parameters to be defined on thebasis <strong>of</strong> experimental data. Figure 5.3 illustrates, qualitatively, the description<strong>of</strong> pinching with reference to one single excursion from the origin.tt1pt1 1 Figure 5.3: The loading branch without pinching (Della Corte et al. 1999).
158 Chapter VIn case <strong>of</strong> a generic deformation history, the parameter lim must be relatedto the maximum experienced deformation in the direction <strong>of</strong> the loadingbranch being described. Therefore, it could be evaluated through theparameter , defined by the following relationship: (5.7)limwhere:0: is the absolute value <strong>of</strong> the deformation corresponding to thestarting point <strong>of</strong> the current excursion; max : is the maximum absolute value <strong>of</strong> deformation experienced, in allprevious loading history, in the direction <strong>of</strong> loading branch to bedescribed (Figure 5.4).5.1.3 The unloading branchThe unloading-branch is assumed to be linear with a slope equal to theinitial stiffness k 0 up to the intersection with the straight line obtained drawingthe parallel to the hardening line going through the origin, as showed in Figure5.5. This allows the Bauschinger effect to be considered.0maxFigure 5.4: The loading branch without pinching (Della Corte et al. 1999).
Evaluation <strong>of</strong> seismic demands 159Figure 5.5: The unloading branch (Della Corte et al. 1999).5.1.4 Calibration <strong>of</strong> the modelIn order to investigate on the capability <strong>of</strong> the illustrated model forinterpreting the stable part <strong>of</strong> the hysteretic behavior <strong>of</strong> CFSSSWs, the values<strong>of</strong> upper bound curve (k 0 , V 0 , k h , n), lower bound curve (k 0p , V 0p , k hp , n p ) andtransition (t 1 , t 2 , ) parameters need to be evaluated. Besides to theexperimental results obtained with the monotonic tests carried out in thisresearch, other existing experimental cyclic tests have been considered. Inparticular, monotonic and cyclic test results have been used to evaluate upperbound curve and transition parameters, respectively. While, the results <strong>of</strong> bothmonotonic and cyclic tests have been used to estimate the lower bound curveparameters.All existing selected experimental cyclic tests were tests performed onCFSSSWs similar to those tested in the current research. In fact, theconsidered walls were sheathed with oriented strand board (OSB) panels andhad panel-to-wall framing connections spaced at about 150mm at theperimeter and at about 300mm in the field. In particular, the selected tests arelisted hereafter: S+96ab-1(OSB1): AISI OSB1 – Serrette et al. (1996a,b); S+96ab-1(OSB2): AISI OSB2 – Serrette et al. (1996a,b); S+97b-18(E1): AISI E1 – Serrette et al. (1997b); S+97b-18(E2): AISI E2 – Serrette et al. (1997b); C01-4(A): 17A - COLA–UCI (2001).
160 Chapter VA summary <strong>of</strong> the geometry and material data <strong>of</strong> specimens is given inTable 5.1.All tests have been performed with fully reversing cyclic displacementsfollowing the TCCMAR (Technical Coordinating Committee for MasonryResearch) sequentially phased displacement procedure, suggested by theStructural Engineers Association <strong>of</strong> South California (SEAOSC 1997).The TCCMAR procedure uses the concept <strong>of</strong> the first major event (FME),which is defined as the first significant limit state that occurs during the test.In case <strong>of</strong> CFSSSWs the FME is defined as the yield limit state (YLS). TheFME can be determined from preliminary load tests on an identical testspecimen.S+96ab-1S+97b-18(OSB1) and (OSB2)(E1) and (E2)C01-4 (A)Type <strong>of</strong> loading Cyclic Cyclic CyclicWall size (1) 2440 x 1220 2440 x 610 2440 x 2440Aspect ratio (2) 2.00 4.00 1.00Openings No openings No openings No openings<strong>Steel</strong> grade (3) A653 Grade SQ 33 A653 Grade SQ 33 A446 Grade A<strong>Stud</strong>s (4) C 89x41x10x0.84/610 C 89x43x13x0.84/610 C 89x41x10x0.84/610Tracks (5) U 89x32x0.84 U 89x32x0.84 U 89x38x0.84Frame screws (6) 4.2x13 wafer-head 4.2x13 mod. truss head 4.2x13 mod. truss headSheathings (7) 11.1mm tick OSB 11.1mm tick OSB 11.1mm tick OSBSheathing fasteners (6) 4.2x25 flat head 4.2x25 flat head 4.2x25 bugle headSpacing sheathingfasteners (8)152/305 152/305 152/305Type <strong>of</strong> anchorage Tie hold-down Hold-down Strip hold-down(1) height x length (mm)(2) height / length(3) A653 Grade SQ 33: Yield strength = 228 MPa, Ultimate tensile strength = 311 MPa(3) A446 Grade A: Yield strength = 228 MPa, Ultimate tensile strength = 311 MPa(4) C: lipped channel section web depth x flange size x lip size x thickness / spacing (mm)(4) Double back-to-back coupled studs were employed at ends <strong>of</strong> walls(5) U: unlipped channel section web depth x flange size x thickness (mm)(6) diameter x length (mm)(7) 610 x 2440 mm panel size(8) perimeter/field (mm)Table 5.1: Wall geometry and material data.The TCCMAR procedure consists <strong>of</strong> applying three cycles <strong>of</strong> fullyreversing, displacement-controlled load at each wall displacement incrementrepresenting 25%, 50%, and 75% <strong>of</strong> the FME displacement. Then, the walldisplacement is increased for one load cycle to 100% <strong>of</strong> the FMEdisplacement. Next, cycles <strong>of</strong> displacement for one cycle each at 75%, 50%,
Evaluation <strong>of</strong> seismic demands 161and 25% <strong>of</strong> the maximum displacement (100% <strong>of</strong> the FME displacement) areapplied. This is followed by three cycles <strong>of</strong> displacement at maximumdisplacement (100% <strong>of</strong> the FME displacement) to stabilize the loaddisplacementresponse <strong>of</strong> the wall. Then, the next increment <strong>of</strong> increaseddisplacement (125% <strong>of</strong> the FME displacement) is applied, followed by similarstabilization cycles <strong>of</strong> loading. This incremental cyclic load-displacementsequence is continued to 150%, 175%, 200%, 250%, 300% <strong>of</strong> the FMEdisplacement, or until the wall exhibits greatly diminished shear load capacity.The test protocols used for the selected tests are illustrated in Table 5.2 andFigure 5.6. Figure 5.7 shows the results <strong>of</strong> the selected tests in terms <strong>of</strong> shearforce (V) versus lateral displacement () curves.The results <strong>of</strong> the calibration <strong>of</strong> the model in terms <strong>of</strong> lower bound curveand transition parameters obtained on the basis <strong>of</strong> Serrette and COLA-UCItests are shown in Table 5.3 for a wall with a length <strong>of</strong> 1m (wall with unitlength). Figure 5.8 shows the comparison between the experimental responseand the numerical one for the C01-4(A) specimen. In particular, in Table 5.3are reported the values <strong>of</strong> transition parameters (t 1 , t 2 , ) together to values <strong>of</strong>the ratios between the lower and upper bound curve parameters ((k 0p /k 0 ) c ,(V 0p /V 0 ) c , (k hp /k h ) c , (n p /n) c ).The comparison between the experimental monotonic response and thenumerical one are illustrated in Figure 5.9.The results <strong>of</strong> the calibration <strong>of</strong> the model in terms <strong>of</strong> upper and lowerbound curve parameters obtained on the basis <strong>of</strong> the monotonic test are shownin Table 5.4. The values <strong>of</strong> the lower bound curve parameters have beencalculated starting from the ratios between the lower and upper bound curveparameters ((k 0p /k 0 ) c , (V 0p /V 0 ) c , (k hp /k h ) c , (n p /n) c ), which have been previouslyderived from existing cyclic tests and the values <strong>of</strong> upper bound curveparameters calibrated on monotonic test results (k 0 , V 0 , k h , n). In particular, thefollowing assumptions have been used:k0 p k0 p/ k0 k0(5.8)V0 pV0 c 0khpkh kc hnn ncV0 / V(5.9)knphpp / (5.10) / (5.11)pc
162 Chapter VS+96ab-1S+97b-18(OSB1) and (OSB2)(E1) and (E2)C01-4 (A)No. <strong>of</strong> cycles Displ. (mm) No. <strong>of</strong> cycles Displ. (mm) No. <strong>of</strong> cycles Displ. (mm)3 5.1 3 5.1 3 5.73 10.2 3 10.2 3 11.53 15.2 3 15.2 3 17.21 20.3 3 20.3 1 22.91 15.2 1 25.4 1 17.21 10.2 1 19.1 1 11.51 5.1 1 12.7 1 5.73 20.3 1 6.4 3 22.91 25.4 3 25.4 1 28.61 19.1 1 30.5 1 21.51 12.7 1 22.9 1 14.31 6.4 1 15.2 1 7.23 25.4 1 7.6 3 28.61 30.5 3 30.5 1 34.41 22.9 1 40.6 1 25.81 15.2 1 30.5 1 17.21 7.6 1 20.3 1 8.63 30.5 1 10.2 3 34.41 40.6 3 40.6 1 40.11 30.5 1 50.8 1 30.11 20.3 1 38.1 1 20.01 10.2 1 25.4 1 10.03 40.6 1 12.7 3 40.11 50.8 3 50.8 1 45.81 38.1 1 61.0 1 34.41 25.4 1 45.7 1 22.91 12.7 1 30.48 1 11.53 50.8 1 15.24 3 45.81 61.0 3 61.0 1 57.31 45.7 1 71.1 1 42.91 30.5 1 53.3 1 28.61 15.2 1 35.6 1 14.33 61.0 1 17.8 3 57.31 71.1 3 71.1 1 68.71 53.3 1 51.51 35.6 1 34.41 17.8 1 17.23 71.1 3 68.71 80.21 60.11 40.11 20.03 80.21 91.61 68.71 45.81 22.93 91.6Table 5.2: Cyclic test protocols.
Evaluation <strong>of</strong> seismic demands 16310080604020displacement(mm)Cyclic frequency = 0.67Hz00-205 10 15 20 25 30 35 40 45 50 55-40-60-80-10010080604020S+96ab-1(OSB1) and (OSB2)displacement(mm)Cyclic frequency = 1.00Hztime (s)00-205 10 15 20 25 30 35 40 45 50 55-40-60-80-10010080604020S+97b-18(E1) and (E2)displacement(mm)time (s)Cyclic frequency =0.25Hz for dispacements 40.6mm0.50Hz for dispacements > 40.6mm00-205 10 15 20 25 30 35 40 45 50 55-40-60-80-100C01-4 (A)time (s)Figure 5.6: Cyclic test protocols.
164 Chapter VS+96ab-1 (OSB1)S+96ab-1 (OSB2)S+97b-18 (E1)S+97b-18 (E2)C01-4 (A)TestAverage <strong>of</strong> maximum+/- loadDispl. at average<strong>of</strong> maximum +/-loadS+96ab-1 (OSB1) 685 lb/ft. (10.0 kN/m) 1.8 in. (46 mm)S+96ab-1 (OSB2) 758 lb/ft. (11.1 kN/m) 1.8 in. (46 mm)S+97b-18 (E1) 700 lb/ft. (10.2 kN/m) 2.8 in. (71 mm)S+97b-18 (E2) 700 lb/ft. (10.2 kN/m) 2.8 in. (71 mm)C01-4 (A) 773 lb/ft. (11.3 kN/m) 1.5 in. (38 mm)Figure 5.7: Cyclic response.Experimental responseNumerical responseFigure 5.8: Numerical vs. experimental cyclic response for the C01-4(A) specimen.
Evaluation <strong>of</strong> seismic demands 165ParameterS+96ab-1 S+96ab-1 S+97b-18 S+97b-18Assumed Dev.C01-4(A) Mean(OSB1) (OSB2) (E1) (E2)values St.(k 0p / k 0 ) c 0.92 0.99 1.09 1.08 0.96 1.00 1.00 0.61(V 0p / V 0 ) c 0.00 0.01 0.01 0.01 0.01 0.01 0.01 0.05(k hp / k h ) c 0.00 0.00 0.00 0.00 0.00 0.00 0.00 0.00(n p / n) c 1.00 1.00 1.00 1.00 1.00 1.00 1.00 1.00t 1 [-] 8 10 10 10 12 10 10 1.4t 2 [-] 0.50 0.40 0.50 0.60 0.50 0.50 0.50 0.07 [-] 1.20 1.00 0.50 0.50 0.50 0.75 0.75 0.34Table 5.3: Results <strong>of</strong> calibration <strong>of</strong> lower bound curve and transition parameters obtained onthe basis <strong>of</strong> existing cyclic tests (values for a 1m long wall).Parameter Monotonic test Assumed valuesk 0 [kN/mm] 2.80 2.80V 0 [kN] 16 16k h [kN/mm] 0.11 0.11n [-] 1.2 1.2k 0p [kN/mm] 1.00 x 2.80 = 2.80V 0p [kN] 0.01 x 16 = 0.16k hp [kN/mm] 0.00 x 0.11 = 0.00n p [-] 1.00 x 1.2 = 1.2V y [kN] 17 17 y [mm] 6.0 6.0V u [kN] 19 19 u [mm] 36 36Table 5.4: Results <strong>of</strong> calibration <strong>of</strong> upper and lower bound curve parameters obtained on thebasis <strong>of</strong> monotonic tests carried-out in the current research (values for a 1m long wall).25V (KN/m)20Vu"Numerical upper bound curve""Experimental monotonic response"Serie315Vy105 (mm)0yu0 5 10 15 20 25 30 35 40Figure 5.9: Numerical vs. experimental monotonic response.
166 Chapter V5.2 ASSESSMENT OF DEFORMATION DEMANDOne single test <strong>of</strong> a seismic-resistant component or sub-assembly mustrepresent a compromise between the need to correctly characterize the specificstructural component subject to a specific deformation history and therequirement to obtain general conclusions applicable to the same componentwith different loading regimes. The only way to fully achieve this compromiseis to analytically study the probable deformation histories the componentwould be subjected to. This characterization requires at least the evaluation <strong>of</strong>the following demand parameters: maximum level <strong>of</strong> deformation experienced by the structure; number <strong>of</strong> repetition <strong>of</strong> several discrete values <strong>of</strong> ductility demands; cumulative plastic deformation engagement <strong>of</strong> the structure; distribution <strong>of</strong> plastic deformation ranges.It is well known that the loading histories produced by different groundmotions on a given structure are significantly scattered, consequently, theestimation <strong>of</strong> the deformation demand will be carried out under a sufficientlylarge data-base <strong>of</strong> earthquake ground motions.5.2.1 Data-base <strong>of</strong> considered earthquake ground motionsThe selected earthquakes include 26 far field records from Central Italy.The considered geographic region (zone in which are located the recordingstations) is identified as medium-high seismic zone by the Italian seismicdesign code (Ordinanza PCM 2003). In fact, the value <strong>of</strong> the design peakground acceleration <strong>of</strong> the seismic zone (PGA zone ), having a 10% probability<strong>of</strong> exceedance in 50 years, is 0.25g. Consequently, a value <strong>of</strong> the design peakground acceleration (PGA des ) equal to 0.25g it has been adopted.The considered earthquakes are the “Lazio-Abruzzo” earthquake, occurredon March, 7 th 1984 at 17h49m; the “Umbro-Marchigiano” earthquake,occurred on September 1997, 26 th at 00h33m; and the “Umbro-Marchigiano”earthquake, occurred on September 1997, 26 th at 09h40m. For theseearthquakes the Richter magnitude ranges from 5.6 to 5.8, the focal depthranges from 6 to 8km, and the source mechanism is <strong>of</strong> normal type.
Evaluation <strong>of</strong> seismic demands 167The earthquake records have been chosen to cover, whenever possible, allthe soil types classified by Eurocode 8 (prEN 1998-1 2001). In particular, foreach soil type, three accelerograms have been selected in such a way that theshape <strong>of</strong> the average elastic response spectrum <strong>of</strong> these records is close to theshape <strong>of</strong> the Eurocode 8 Type 1 elastic spectrum acceleration (with a dampingratio <strong>of</strong> 0.05). For the accelerograms selected according to these assumptionsthe recorded peak ground acceleration (PGA rec ) value range from 0.01 to0.76g, the distance between the epicentre and the recording station rangesfrom 11 to 100km, and the record length ranges from 14 to 60s.Earthquakes, recording stations and waveform parameters <strong>of</strong> consideredrecords are reported in Table 5.5. For each station, Table 5.5 also shows thedesign ground acceleration according to the Italian seismic design code(PGA zone ). In the same Table, a label has been defined for each earthquakerecord. As example, the label “UM-B-1” refers to a recording <strong>of</strong> the “Umbro-Marchigiano” (UM), which has been carried out on B soil type (B).The geographical localization <strong>of</strong> the epicenter <strong>of</strong> the selected strongmotions and <strong>of</strong> the recording stations is presented in Figure 5.10.In Figures 5.11 a, b, c, d, and e comparisons between the elastic responsespectra (S ae (T,=0.05)) <strong>of</strong> the selected records scaled to a design value <strong>of</strong> theground acceleration equal to its design peak ground value(PGA=PGA des =0.25g) and the design elastic spectral acceleration(S aed (T,=0.05)) defined by Eurocode 8 for soil type A, B, C, D, and E,respectively, are reported.
168 Chapter VEarthquake nameDate and timeRichter MagnitudeFocal depthFault mechanismRecordlabelStation name (orientation)PGA zone / g PGA rec / gRecordlength[s]Epicentraldistance[km]LA-A-01 Ponte Corvo(N-S) 0.25 0.064 32.441 31 -LA-A-02 Roccamonfina (N-S) 0.25 0.036 22.740 50 -LA-A-03 Bussi (E-W) 0.25 0.019 25.000 51 -Faultdistance Soil type[km]Rock(A)Lazio Abruzzo1984/05/07 - 17:49:435.78 kmNormalLA-B-01 Ripa-Fagnano (E-W) 0.25 0.017 14.910 64 -LA-B-02 Poggio-Picenze (E-W) 0.25 0.011 15.530 72 -LA-B-03 Poggio-Picenze (N-S) 0.25 0.017 15.530 72 -LA-C-01 Ortucchio (N-S) 0.35 0.061 21.220 26 -LA-C-02 Taranta Peligna (E-W) 0.35 0.077 32.131 39 -LA-C-03 Barisciano (E-W) 0.25 0.012 16.540 71 -Garigliano-Centrale Nucleare 1LA-D-01(N-S)0.25 0.060 26.211 53 -Garigliano-Centrale Nucleare 1LA-D-02(E-W)0.25 0.059 26.231 53 -Garigliano-Centrale Nucleare 2LA-D-03(N-S)0.25 0.060 26.101 53 -LA-E-01 Cassino-Sant' Elia (N-S) 0.25 0.147 27.261 23 17LA-E-02 Cassino-Sant' Elia (E-W) 0.25 0.114 27.271 23 17Umbro-Marchigiano UM-A-01 Cagli (N-S) 0.25 0.013 25.240 59 501997/09/26 - 09:40:305.8UM-A-02 Nocera Umbra (E-W) 0.25 0.760 41.129 11 46 kmNormal UM-A-03 Pennabilli (N-S) 0.25 0.015 28.731 100 92Umbro-Marchigiano1997/09/26 - 00:33:165.6UM-B-01 Bevagna (N-S) 0.25 0.034 46.108 25 257 kmNormalUM-B-02 Bevagna (E-W) 0.25 0.079 50.308 23 26Stiff soil(B)S<strong>of</strong>t soil(C)Very s<strong>of</strong>tsoil(D)Alluvium(E)Rock(A)Stiff soil(B)Umbro-Marchigiano1997/09/26 - 09:40:305.86 kmNormalUmbro-Marchigiano1997/09/26 - 00:33:165.67 kmNormalUM-B-03 Senigallia (E-W) 0.25 0.037 26.801 78 71UM-C-01 Castelnuovo-Assisi (N-S) 0.25 0.159 55.077 22 23UM-C-02 Rieti (N-S) 0.25 0.015 59.786 67 66UM-C-03 Rieti (E-W) 0.25 0.018 59.786 67 66UM-E-01 Norcia-Altavilla (E-W) 0.25 0.046 13.760 32 30UM-E-02 Norcia-Zona Industriale (N-S) 0.25 0.034 52.197 32 26UM-E-03 Norcia-Zona Industriale (E-W) 0.25 0.037 52.197 32 26Table 5.5: Data-base <strong>of</strong> selected earthquake records.S<strong>of</strong>t soil(C)Alluvium(E)
Evaluation <strong>of</strong> seismic demands 169Umbro - MarchigianoPGA (g) values with a10% probability <strong>of</strong>exceedance in 50 yearsLazio - Abruzzo Epicenter StationFigure 5.10: Geographical distribution <strong>of</strong> the selected strong-motion records.1.41.21.00.80.6Sae(T;=0.05)/gLazio-Abruzzo 1984Soil type: AEC8LA-A-01LA-A-02LA-A-03meanPGA=PGA des =0.25g1.41.21.00.80.6Sae(T;=0.05)/gUmbria-Marche 1999Soil type: AEC8UM-A-01UM-A-02UM-A-03meanPGA=PGA des =0.25g0.40.40.20.20.0T (s)0.0T (s)0.0 0.2 0.4 0.6 0.8 1.0 1.2 1.4 1.6 1.8 2.0 0.0 0.2 0.4 0.6 0.8 1.0 1.2 1.4 1.6 1.8 2.0Figure 5.11a: Elastic spectra <strong>of</strong> earthquake records for type A soil.
170 Chapter V1.41.21.00.80.6Sae(T;=0.05)/gLazio-Abruzzo 1984Soil type: BEC8LA-B-01LA-B-02LA-B-03meanPGA=PGA des =0.25g1.41.21.00.80.6Sae(T;=0.05)/gUmbria-Marche 1999Soil type: BEC8UM-B-01UM-B-02UM-B-03meanPGA=PGA des =0.25g0.40.40.20.20.0T (s) 0.0T (s)0.0 0.2 0.4 0.6 0.8 1.0 1.2 1.4 1.6 1.8 2.0 0.0 0.2 0.4 0.6 0.8 1.0 1.2 1.4 1.6 1.8 2.0Figure 5.11b: Elastic spectra <strong>of</strong> earthquake records for type B soil.3.22.82.42.01.6Sae(T;=0.05)/gLazio-Abruzzo 1984Soil type: CEC8LA-C-01LA-C-02LA-C-03meanPGA=PGA des =0.25g3.22.82.42.01.6Sae(T;=0.05)/gUmbria-Marche 1999Soil type: CEC8UM-C-01UM-C-02UM-C-03meanPGA=PGA des =0.25g1.21.20.80.80.40.40.00.0T (s)T (s)0.0 0.2 0.4 0.6 0.8 1.0 1.2 1.4 1.6 1.8 2.0 0.0 0.2 0.4 0.6 0.8 1.0 1.2 1.4 1.6 1.8 2.0Figure 5.11c: Elastic spectra <strong>of</strong> earthquake records for type C soil.1.41.21.00.80.60.4Sae(T;=0.05)/gLazio-Abruzzo 1984Soil type: DEC8LA-D-01LA-D-02LA-D-03meanPGA=PGA des =0.25g0.20.0T (s)0.0 0.2 0.4 0.6 0.8 1.0 1.2 1.4 1.6 1.8 2.0Figure 5.11d: Elastic spectra <strong>of</strong> earthquake records for type D soil.
Evaluation <strong>of</strong> seismic demands 1711.41.21.00.80.6Sae(T;=0.05)/gLazio-Abruzzo 1984Soil type: EEC8LA-E-01LA-E-02meanPGA=PGA des =0.25g1.41.21.00.80.6Sae(T;=0.05)/gUmbria-Marche 1999Soil type: EEC8meanUM-E-01UM-E-02UM-E-03PGA=PGA des =0.25g0.40.40.20.20.00.0T (s)T (s)0.0 0.2 0.4 0.6 0.8 1.0 1.2 1.4 1.6 1.8 2.0 0.0 0.2 0.4 0.6 0.8 1.0 1.2 1.4 1.6 1.8 2.0Figure 5.11e: Elastic spectra <strong>of</strong> earthquake records for type E soil.5.2.2 Displacement demand evaluationIn order to perform the analysis a purposely developed computer code hasbeen used (Ghersi & Noce 1999). This program allows non-linear dynamicanalysis <strong>of</strong> two-dimensional structures to be carried out.Figure 5.12 shows the representation <strong>of</strong> the numerical model adopted toschematize the CFSSSW with unit length as a SDOF system.MFRichard Abbott element v()vh = 2800 mmTrusselementEA Ground acceleration a(t)atFigure 5.12: Numeric model schematization.In the model, the hysteretic lateral behavior <strong>of</strong> the CFSSSW is described bya “Richard Abbott” element in which the assumed values <strong>of</strong> upper bound
172 Chapter Vcurve, lower bound curve and transition parameters are the results <strong>of</strong> thecalibration explained in Section 5.1.4 (see Tables 5.3 and 5.4). According tobasic assumptions illustrated in Chapter 4 (Section 4.2), the assumed value <strong>of</strong>mass (M) is equal to M=1250kg. In order to take in to account the secondorder effects, a vertical load (F) corresponding to 100% <strong>of</strong> the mass value hasbeen considered. A damping ratio <strong>of</strong> 0.05 has been also used in the model.For performing the earthquake analyses, the incremental dynamic analysis(IDA) or dynamic pushover (DPO) procedure is utilised.The IDA procedure needs the definition <strong>of</strong> two parameters. The first isrelated to the structural performance and can be linked to the damage level <strong>of</strong>the structure after an earthquake. The second is a parameter associated to themagnitude <strong>of</strong> the earthquake records. In particular, the most used structuralperformance and record intensity parameters are the following (Fulop &Dubina 2003): Structural Performance Parameters (SPP): inter-story drift (/h); top story displacement; maximum plastic rotation; accumulated plastic rotation. Record Intensity Parameters (RIP): elastic spectral acceleration corresponding to the first mode period(T 0 ) <strong>of</strong> the structure (S ae (T 0 )); recorded peak ground acceleration.Fixed a structural system and the related SPP, an earthquake record and theassociated RIP, the IDA procedure consists in determining IRP valuecorresponding to each prefixed SPP value. As a result <strong>of</strong> the IDA, a curverelating the SPP to the RIP can be drawn.The IDA parameters used in the current research are the inter-story drift(/h) and the elastic spectral acceleration <strong>of</strong> the SDOF system (S ae ). Inparticular the accelerograms are scaled from 0.05 to 1.95g.An example <strong>of</strong> IDA is reported in Figure 5.13 where the significant steps <strong>of</strong>the procedure are shown. This analysis has been carried out on the SDOF
Evaluation <strong>of</strong> seismic demands 173system previously defined for which the inter-story drift (/h) has beenadopted as SPP. In the example, the UM-B-1 accelerogram has beenconsidered as agent earthquake and the elastic spectral acceleration (S ae ) hasbeen assumed as IRP.The UM-B-1 record has been scaled form 0.05 to 1.95g. In particular,Figure 5.13a shows the record scaled to design peck ground accelerationPGA des (PGA=0.25g) and Figure 5.13b illustrates the elastic responseacceleration spectra <strong>of</strong> the record for PGA values <strong>of</strong> 0.25, 0.95 and 1.45g.Assuming as natural vibration period T=0.13s (obtained for a mass M=1250kgand a stiffness k=k 0 =2.80kN/mm), for each prefixed PGA level it is possibleto identify the S ae value (S ae,0.05 =0.63g, S ae,0.25 =2.40g, S ae,0.45 =3.66g) fromFigure 5.13b.The non-linear dynamic response <strong>of</strong> the SDOF system, in terms <strong>of</strong> shearforce (V) versus inter-story drift (/h), is reported in Figures 5.13c, d, and e foreach assumed PGA level. The maximum absolute value <strong>of</strong> /h ((/h) max ) canbe extracted from the V-/h curves ((/h) max,0.25 =0.001, (/h) max,0.95 =0.024,(/h) max,0.45 =0.073). Reporting for each obtained value <strong>of</strong> the (/h) max thecorrespondent S ae value the IDA curve can be drawn, as shown in Figure5.13f.The IDA curves, obtained considering all selected earthquake records, arereported in Figures 5.14 a and b, grouped for “Lazio-Abruzzo” and “Umbro-Marchigiano” earthquakes, respectively. The same curves are shown inFigures 5.15 a through e, grouped for the different soil types.Reporting the inter-story drift corresponding to the yield limit( y /h=6/2800=0.0021) and ultimate limit state ( u /h=36/2800=0.013) on theIDA curves, the associated elastic spectral accelerations S aey and S aeu can bedetermined. The S aed , S aey and S aeu values and the S aeu /S aey , and S aeu /S aed ratioscomputed for each earthquake records are also reported in Table 5.6.Moreover, the mean and the standard deviation values have been calculatedfor both the Lazio-Abruzzo (LA) and Umbro-Marchigiano (UM) recordgroups, for all soil type groups and for all accelerograms.
174 Chapter V0.58.0a (t)/gPGA=0.25gSae/g (IRP)PGA=01.45g0.47.0PGA=0.95g0.30.26.0PGA=0.25g5.00.10.04.0S ae,1.450 10 20 30 40 50 60-0.1-0.23.0S ae,0.952.0-0.31.0S ae,0.25-0.40.0t (s)T (s)-0.50.0 0.2 0.4 0.6 0.8 1.0 1.2 1.4 1.6 1.8 2.0(a) Accelerogram <strong>of</strong> the UM-B-1 record (b) Elastic spectra <strong>of</strong> the UM-B-1 record30V [kN]30PGA=0.25gV [kN]PGA=0.95g20201010(/h) 0.25 /h (SPP)00(/h) 0.95 /h (SPP)-0.04 -0.03 -0.02 -0.01 0.00 0.01 0.02 0.03 0.04 -0.04 -0.03 -0.02 -0.01 0.00 0.01 0.02 0.03 0.04-10-10-20-20-30-30(c) V - d/h response for PGA = 0.25g (d) V - d/h response for PGA = 0.95g30PGA=1.45g4.03.5203.0102.5(/h) 1.450/h (SPP)2.0-0.04 -0.03 -0.02 -0.01 0.00 0.01 0.02 0.03 0.04 1.5V [kN]-101.0Sae/g (IRP)-20-30(e) V - d/h response for PGA = 1.45g0.5/h (SPP)0.00.000 0.020 0.040 0.060 0.080 0.100 0.120 0.140(f) IDA curveFigure 5.13: IDA procedure example.The S aeu /S aey ratio can be considered as a measure <strong>of</strong> seismic toughness <strong>of</strong>the structures. For all earthquake records, this parameter ranges from 1.26 to3.89 with a mean value <strong>of</strong> 2.27 and a standard deviation <strong>of</strong> 0.62. Based onthese results a discrete ductility for the CFSSSW systems can be relied upon.The results are enough scattered, what highlights the dependence <strong>of</strong> theS aeu /S aey ratio from the considered earthquake record.
Evaluation <strong>of</strong> seismic demands 175From examination <strong>of</strong> the data reported in Table 5.6 it can also be observedthat the UM earthquake records are more severe than the LA group. In fact,the mean value <strong>of</strong> S aeu /S aey is slightly higher (about 12%) in the LA records.Moreover, the results indicate that the LA data are more scattered incomparison with UM data.The comparison between the results obtained for different soil types showsthat the accelerograms recorded on soil type D are the most severe. In fact, inthis case the lowest mean value <strong>of</strong> S aeu /S aey ((S aeu /S aey ) mean =1.52) has beenobtained. The least severe results have been found for soil types A and B, forwhich the mean values <strong>of</strong> S aeu /S aey are 2.17 and 2.13, respectively.Examining the scattering <strong>of</strong> data, it may be noted that the maximumdispersion has been obtained for the soil type C, while in the case <strong>of</strong> soil typeD the scattering <strong>of</strong> the results is the smallest one.765Sae/gLA-A-01 LA-A-02 LA-A-03LA-B-01 LA-B-02 LA-B-03LA-C-01 LA-C-02 LA-C-03LA-D-01 LA-D-02 LA-D-03LA-E-01 LA-E-0243210 / h0.000 y / h 0.005 0.010 u / h 0.015Figure 5.14a: IDA curves for “Lazio-Abruzzo” earthquake.
176 Chapter V765Sae/gUM-A-01 UM-A-02 UM-A-03UM-B-01 UM-B-02 UM-B-03UM-C-01 UM-C-02 UM-C-03UM-E-01 UM-E-02 UM-E-0343210 / h0.000 y / h 0.005 0.010 u / h 0.015Figure 5.14b: IDA curves for “Umbro-Marchigiano” earthquake.76543Sae/gLA-A-01LA-A-02LA-A-03UM-A-01UM-A-02UM-A-0321 / h00.000 y / h 0.005 0.010 u / h 0.015Figure 5.15a: IDA curves for soil type A.
Evaluation <strong>of</strong> seismic demands 17776543Sae/gLA-B-01LA-B-02LA-B-03UM-B-01UM-B-02UM-B-03210 / h0.000 y / h 0.005 0.010 u / h 0.015Figure 5.15b: IDA curves for soil type B.765LA-C-01LA-C-02LA-C-03UM-C-01UM-C-02UM-C-0343210 / h0.000 y / h 0.005 0.010 u / h 0.015Figure 5.15c: IDA curves for soil type C.
178 Chapter V765Sae/gLA-D-01LA-D-02LA-D-034321 / h00.000 y / h 0.005 0.010 u / h 0.015Figure 5.15d: IDA curves for soil type D.7654Sae/gLA-E-01LA-E-02UM-E-01UM-E-02UM-E-03321 / h00.000 y / h 0.005 0.010 u / h 0.015Figure 5.15e: IDA curves for soil type E.
Evaluation <strong>of</strong> seismic demands 179Earthquake record S aed / g S aey / g S aeu / g S aeu / S aey S aeu / S aedLA-A-01 0.63 1.03 2.06 2.00 3.30LA-A-02 0.63 0.88 2.08 2.35 3.33LA-A-03 0.63 1.01 2.46 2.44 3.93LA-B-01 0.68 0.87 1.68 1.94 2.46LA-B-02 0.68 1.38 2.53 1.83 3.70LA-B-03 0.68 1.13 3.11 2.75 4.55LA-C-01 0.72 1.79 6.17 3.44 8.62LA-C-02 0.72 2.09 5.09 2.43 7.11LA-C-03 0.72 4.36 16.99 3.89 23.73LA-D-01 0.68 1.02 1.56 1.53 2.28LA-D-02 0.68 1.08 1.53 1.42 2.24LA-D-03 0.68 1.04 1.69 1.62 2.47LA-E-01 0.87 1.02 3.10 3.05 3.56LA-E-02 0.87 1.36 3.63 2.68 4.18UM-A-01 0.63 1.15 3.29 2.86 5.22UM-A-02 0.63 1.78 3.76 2.11 5.96UM-A-03 0.63 0.87 1.10 1.26 1.75UM-B-01 0.58 1.10 1.99 1.81 3.43UM-B-02 0.58 1.27 2.29 1.81 3.95UM-B-03 0.58 0.79 2.10 2.66 3.62UM-C-01 0.62 1.81 4.20 2.33 6.78UM-C-02 0.62 1.47 2.24 1.52 3.61UM-C-03 0.62 1.02 2.20 2.16 3.54UM-E-01 0.74 2.14 5.37 2.51 7.26UM-E-02 0.74 1.46 3.44 2.35 4.64UM-E-03 0.74 1.59 3.51 2.20 4.74Mean (Type A soil records) 1.12 2.46 2.17 3.92St. Dev. (Type A soil records) 0.34 0.95 0.54 1.50Mean / St. Dev. (Type A soil records) 0.30 0.39 0.25 0.38Mean (Type B soil records) 1.09 2.28 2.13 3.62St. Dev. (Type B soil records) 0.23 0.49 0.45 0.69Mean / St. Dev. (Type B soil records) 0.21 0.22 0.21 0.19Mean (Type C soil records) 2.09 6.15 2.63 8.90St. Dev. (Type C soil records) 1.17 5.54 0.88 7.54Mean / St. Dev. (Type C soil records) 0.56 0.90 0.33 0.85Mean (Type D soil records) 1.05 1.59 1.52 2.33St. Dev. (Type D soil records) 0.03 0.08 0.10 0.12Mean / St. Dev. (Type D soil records) 0.03 0.05 0.07 0.05Mean (Type E soil records) 1.51 3.81 2.56 4.88St. Dev. (Type E soil records) 0.41 0.89 0.33 1.41Mean / St. Dev. (Type E soil records) 0.27 0.23 0.13 0.29Mean (LA records) 1.43 3.83 2.38 5.39St. Dev. (LA records) 0.91 4.03 0.73 5.59Mean / St. Dev. (LA records) 0.64 1.05 0.31 1.04Mean (UM records) 1.37 2.96 2.13 4.54St. Dev. (UM records) 0.41 1.18 0.47 1.57Mean / St. Dev. (UM records) 0.30 0.40 0.22 0.34Mean (all records) 1.40 3.43 2.27 5.00St. Dev. (all records) 0.71 3.04 0.62 4.18Mean / St. Dev. (all records) 0.51 0.89 0.28 0.84Table 5.6: IDA results.
180 Chapter V5.3 DEFINITION OF A LOAD HISTORY FOR A CYCLICTESTING5.3.1 Loading histories in quasi-static cyclic loading tests: basicprocedures for Multiple Step Test<strong>Seismic</strong> capacity measures for a structural component or sub-assembly arestrength, stiffness, inelastic deformation capacity and cumulative capacitysuch as energy dissipation capacity. All these parameters are expected todeteriorate as the number <strong>of</strong> damaging cycles and the amplitude <strong>of</strong> cyclingincreases. The type <strong>of</strong> deterioration depends on the failure mode <strong>of</strong> thestructural element and the adopted loading history. Figure 5.16a shows atypical example <strong>of</strong> deterioration for a CFSSSW subject to the loading historyreported in Figure 5.16b. The typical cyclic behavior <strong>of</strong> CFSSSWs denotesstrong pinching and reduced ductility.(a) Cyclic response <strong>of</strong> a CFSSSW(b) Time historyFigure 5.16: Deterioration <strong>of</strong> a CFSSSW system (Branston et al. 2003).The choice <strong>of</strong> a loading history for seismic testing <strong>of</strong> a structuralcomponent or sub-assembly should be based on the following cumulativedamage concepts, as reported in Krawinkler (1996). Every excursion in the inelastic range causes damage in a structure thatbrings it closer to failure. Moreover, the damage increases as theinelastic excursion amplifies. Thus, relative amount <strong>of</strong> damage caused
Evaluation <strong>of</strong> seismic demands 181by an inelastic excursion depends on the individual plastic deformationrange <strong>of</strong> the excursion ( p ) (see Fig. 5.17).For a given deformation amplitude the damage is largest for asymmetric excursion.The damage due to inelastic excursions is cumulative, thus it dependson the number <strong>of</strong> inelastic excursions (N p ) and the sum <strong>of</strong> normalizedplastic deformation ranges ( pi / y ).The damage depends on sequence effects, which means that it dependson the sequence in which large and small excursions are applied to thestructure. In particular, the importance <strong>of</strong> sequence effects has not yetbeen established.Figure 5.17: Basic parameters in a typical cyclic <strong>of</strong> loading (ATC 1992).Besides to the maximum level <strong>of</strong> deformation experienced by the structure,which can be defined by the maximum normalized deformation (=(/ y ) max ),the main capacity parameters for characterizing the loading histories are thenumber <strong>of</strong> inelastic excursions (N p ), their individual plastic deformation range( p ) and the sum <strong>of</strong> normalized plastic deformation ranges ( pi / y ), which
182 Chapter Vmay be used as the basic cumulative damage parameter. For improving theloading history description may be appropriate to add another parameter todescribe the distribution <strong>of</strong> individual plastic deformation range. The latter canbe represented by the ratio between the mean value (( p ) av ) and themaximum value (( p ) max ) <strong>of</strong> the plastic deformation range (( p ) av /( p ) max ).This parameter (( p ) av /( p ) max ) with the ones employed by Krawinklerwill be used in the current research to determine the loading history.The demands imposed by an earthquake on a structural component or subassemblydepend on its configuration in a structure, the strength and elastic aswell inelastic dynamic characteristics <strong>of</strong> the structure, and the seismic input towhich the structure may be subjected.For developing loading histories, Nassar and Krawinkler (1991) madegeneral considerations starting from studies on seismic demands on singledegree <strong>of</strong> freedom (SDOF) systems. These studies have been based on bilinear(with 10% strain hardening) and stiffness degrading SDOF systems withductilities () ranging from 2 to 8 subjected to a set <strong>of</strong> 15 Western U.S.earthquake ground motions. The magnitude <strong>of</strong> the earthquakes was variedfrom 5.7 to 7.7, their durations varied significantly, and they representedground motions at stiff soil sites.As a result <strong>of</strong> these studies, the Authors show the significant dependence <strong>of</strong>some demand parameters (N p and pi / y ) on the natural period (T) <strong>of</strong> thestructures and the ductility ratio (). In particular: The number <strong>of</strong> inelastic excursions (N p ) amplifies with an increase inthe natural period <strong>of</strong> the structure (T) for T 0.2s, but decreases withan increase <strong>of</strong> T for T 0.2s. Moreover, for each T value, N p increaseswhen the ductility ratio () amplifies (see Fig. 5.18). Similar to N p , the sum <strong>of</strong> normalized plastic deformation ranges( pi / y ) increases with an amplification <strong>of</strong> natural period (T) for T 0.2s but decreases with an increase <strong>of</strong> T for T 0.2s. Moreover, foreach T value, N p increases when the ductility ratio () amplifies (seeFig. 5.19). The magnitudes <strong>of</strong> individual plastic deformation ranges ( p ) <strong>of</strong> theinelastic excursions can be represented by a lognormal distribution.Large plastic deformation ranges are less frequent than small ones. Infact, Hadidi-Tamjed (1987) reports that the mean <strong>of</strong> the plastic
Evaluation <strong>of</strong> seismic demands 183deformation ranges (( p ) av ) in an earthquake is usually less than 15%<strong>of</strong> the maximum plastic deformation range (( p ) max ).On basis <strong>of</strong> these results, Krawinkler (1996) suggests the choice <strong>of</strong> testingprogram and associated loading history. In particular, if cumulative damagemodeling is not object <strong>of</strong> the research, the monotonic load-displacementresponse can be easily predictable, the deterioration is slow, then the “MultipleStep Test” is the recommended test program.Figure 5.18: Dependence <strong>of</strong> mean number <strong>of</strong> inelastic excursions on natural period andductility ratio (Krawinkler 1996).Figure 5.19: Dependence <strong>of</strong> mean number <strong>of</strong> the sum <strong>of</strong> normalized plastic deformationranges on natural period and ductility ratio (Krawinkler 1996).
184 Chapter VThe loading history for a “Multiple Step Test” consists <strong>of</strong> a series <strong>of</strong>stepwise increasing deformation cycles, as shown in Figure 5.20. In Figure5.20, indicates the deformation control parameters, and representsincrement in peak deformation. In this history, the cycles should be symmetricand several cycles should be completed during each step. The firsts load stepsshould be performed in the elastic range to obtain stable and reliable values <strong>of</strong>stiffness properties. The following steps should be performed at and beyondyielding.Figure 5.20: Loading history for Multiple Step Test (Krawinkler 1996).For satisfying these requirements, the Author reports a table (Table 5.7) inwhich shows, for three selected period (T=0.2s, T =0.5s, T =2.0s) and fourductility ratio levels (=2, =4,=6,=8), representative values <strong>of</strong> predictedand experimental SDOF seismic demands obtained from the loading historyreported in Figure 5.20 in which = y .
Evaluation <strong>of</strong> seismic demands 185T N p pi / ymean mead + st. dev. experim. mean mead + st. dev. experim.2 12 19 6 4 7 110.24 28 42 16 28 41 576 36 55 24 54 76 1278 39 59 32 78 109 2292 8 12 6 3 5 110.54 19 30 16 23 36 576 24 35 24 41 64 1278 26 38 32 64 97 2292 4 7 6 3 4 112.04 7 10 16 13 20 576 9 12 24 25 36 1278 10 14 32 38 52 229Table 5.7: Predicted and experimental demands for a bilinear SDOF (Krawinkler 1996).The values <strong>of</strong> the total number <strong>of</strong> inelastic excursions (N p ) and the sum <strong>of</strong>normalized plastic deformation ranges ( pi / y ) reported in Table 5.7, aswell as that frequently adopted in loading sequences for CFSSSWs (SEAOSC1997) testing, have been derived based on a bilinear hysteresis assumption. Asa consequence, a study aiming at characterizing the deformation history toCFSSSW structural systems is needed.5.3.2 Definition <strong>of</strong> the deformation history for the cyclic testingUsing a sufficiently large database <strong>of</strong> earthquake ground motion records,the choice <strong>of</strong> an appropriate loading history for a “multiple step test” needs (a)definition <strong>of</strong> the demand parameters and (b) definition <strong>of</strong> the magnitude <strong>of</strong> theearthquake records.Selection <strong>of</strong> the demand parameters has been based on cumulative damageconcepts, as explained in Section 5.3.1. As a result <strong>of</strong> these considerations theassumed parameters are the following:maximum level <strong>of</strong> deformation that, from the results <strong>of</strong> monotonictests carried-out in the current research, can be characterized by avalue <strong>of</strong> ductility ratio equal to =(/ y ) max = u / y =36/6=6; number <strong>of</strong> inelastic excursions (N p ); sum <strong>of</strong> normalized plastic deformation ranges ( pi / y );
186 Chapter V distribution <strong>of</strong> individual plastic deformation range (( p ) av /( p ) max ).These demand parameters strictly depends on the definition <strong>of</strong> theindividual plastic excursion. The typical cyclic behavior <strong>of</strong> CFSSSWs ischaracterized by strong pinching; consequently definition <strong>of</strong> the inelasticexcursion is strictly related to the adopted convention.In the current research the individual plastic deformation range <strong>of</strong> theexcursion i ( pi ) is defined by the difference between the deformationcorresponding to the null value <strong>of</strong> the shear force achieved on the unloadingbranch<strong>of</strong> the excursion i ( i,0 ) and the maximum value <strong>of</strong> deformationscorresponding to the null values <strong>of</strong> the shear force achieved on the unloadingbranch<strong>of</strong> the previous excursion ( max,0 =max{ 1,0 ; 2,0 ; … i-1,0 }), asshown in Figure 5.21.The evaluation <strong>of</strong> assumed deformation demand parameters under theselected earthquake ground motions has been carried out by scaling records.In particular, each accelerogram has been scaled in such way that the elasticspectral acceleration (S ae ) be equal to the spectral acceleration inducing theultimate lateral displacement (S aeu ) obtained through the IDA. In other words,each design accelerogram (PGA=PGA des =0.25g) has been scaled by S au /S ad .The S au /S ad values are reported in Table 5.6.V (kN) Excursion (i+1)+Excursion (i)+ p,(i)- p,(i)- (mm) p,(i)+ p,(i+1)+Excursion (i+1)-Excursion (i)-Figure 5.21: Assumed definitions <strong>of</strong> individual plastic deformation range.
Evaluation <strong>of</strong> seismic demands 187Results <strong>of</strong> the statistic characterization <strong>of</strong> the deformation demand aresynthesized in Figures 5.22 a through d and Table 5.8. In particular, themaximum normalized deformation ((/ y ) max ) (see Fig. 5.22a), the number <strong>of</strong>inelastic excursion (N p ) (see Fig. 5.22b), the sum <strong>of</strong> normalized plasticdeformation ranges ( pi / y ) (see Fig. 5.22c), and the ratio between themean value and the maximum value <strong>of</strong> the plastic deformation range(( p ) av /( p ) max ) (see Fig. 5.22d) are reported for each accelerogram. Alsothe mean and the standard deviation values have been calculated for allearthquake records, for all soil types and for both the LA and UM recordgroups.For all accelerograms, the (/ y ) max values range from 5.1 to 7.5 with amean value <strong>of</strong> 6.1 and a standard deviation <strong>of</strong> 0.4; N p ranges from 9 to 45 witha mean and standard deviation values <strong>of</strong> 24 and 11, respectively; the range <strong>of</strong> pi / y is from 5.6 to 9.2 with a mean value <strong>of</strong> 7.5 and a standard deviation<strong>of</strong> 1.0; finally, (( p ) av /(( p ) max ranges from 0.09 to 1.21 and its mean andstandard deviation values are 0.28 and 0.22, respectively.From results reported in Figures 5.22 and Table 5.8, it can also be notedthat the mean values <strong>of</strong> the parameters associated to the damage level (N p and pi / y ) are similar for both the LA and UM record groups. In particular, themean values <strong>of</strong> N p and pi / y result moderately higher (about 18 and 10%,respectively) for UM records. Also the dispersion <strong>of</strong> data results moderatelyhigher for UM records in the case <strong>of</strong> N p and pi / y . For the parameterrelated to the distribution <strong>of</strong> individual plastic deformation range(( p ) av /( p ) max ), both the mean and standard deviation values in LAearthquake records are sensibly higher in comparison with UM records. Inparticular, the mean value results about 50% higher in LA earthquake.The comparison between the results obtained for different soil types showsthat the highest mean values for the parameters N p and pi / y have beenobtained for the soil type D, while the mean values <strong>of</strong> N p and pi / y resultthe lowest for soil types B and E, respectively. Also the scattering <strong>of</strong> data isthe highest for the soil type D in the case <strong>of</strong> N p , while for pi / y themaximum dispersion has been obtained for the soil type C. For the parameter(( p ) av /( p ) max ), the maximum and minimum mean values have been foundfor soil types E and D, respectively, while the scattering results larger in thecase <strong>of</strong> soil type C.
188 Chapter V876543210mean + st.devmeanmean – st.devmean: 6.1 - st.dev: 0.4LA-A-01LA-A-02LA-A-03LA-B-01LA-B-02LA-B-03LA-C-01LA-C-02LA-C-03LA-D-01LA-D-02LA-D-03LA-E-01LA-E-02UM-A-01UM-A-02UM-A-03UM-B-01UM-B-02UM-B-03UM-C-01UM-C-02UM-C-03UM-E-01UM-E-02UM-E-03Figure 5.22a: Results <strong>of</strong> the statistic characterization <strong>of</strong> the deformation demand in terms <strong>of</strong>maximum normalized deformation.50454035302520151050mean + st.devmeanmean – st.devmean: 24 - st.dev: 11LA-A-01LA-A-02LA-A-03LA-B-01LA-B-02LA-B-03LA-C-01LA-C-02LA-C-03LA-D-01LA-D-02LA-D-03LA-E-01LA-E-02UM-A-01UM-A-02UM-A-03UM-B-01UM-B-02UM-B-03UM-C-01UM-C-02UM-C-03UM-E-01UM-E-02UM-E-03Figure 5.22b: Results <strong>of</strong> the statistic characterization <strong>of</strong> the deformation demand in terms <strong>of</strong>number <strong>of</strong> inelastic excursion.
Evaluation <strong>of</strong> seismic demands 1891098mean + st.devmeanmean: 7.5 - st.dev: 1.0mean – st.dev76543210LA-A-01LA-A-02LA-A-03LA-B-01LA-B-02LA-B-03LA-C-01LA-C-02LA-C-03LA-D-01LA-D-02LA-D-03LA-E-01LA-E-02UM-A-01UM-A-02UM-A-03UM-B-01UM-B-02UM-B-03UM-C-01UM-C-02UM-C-03UM-E-01UM-E-02UM-E-03Figure 5.22c: Results <strong>of</strong> the statistic characterization <strong>of</strong> the deformation demand in terms <strong>of</strong>sum <strong>of</strong> normalized plastic deformation ranges.1.31.21.11.00.90.80.70.60.50.40.30.20.10.0mean + st.devmeanmean – st.devmean: 0.28- st.dev: 0.22LA-A-01LA-A-02LA-A-03LA-B-01LA-B-02LA-B-03LA-C-01LA-C-02LA-C-03LA-D-01LA-D-02LA-D-03LA-E-01LA-E-02UM-A-01UM-A-02UM-A-03UM-B-01UM-B-02UM-B-03UM-C-01UM-C-02UM-C-03UM-E-01UM-E-02UM-E-03Figure 5.22d: Results <strong>of</strong> the statistic characterization <strong>of</strong> the deformation demand in terms <strong>of</strong>ration between the mean value and the maximum value <strong>of</strong> the plastic deformation range.
190 Chapter VEarthquake record ( p / y ) max N p pi / y ( p ) av /(( p ) maxLA-A-01 6.1 28 7.6 0.15LA-A-02 6.1 34 7.1 0.13LA-A-03 5.9 13 6.9 0.39LA-B-01 5.9 16 7.2 0.32LA-B-02 6.2 13 6.0 0.28LA-B-03 6.0 13 7.8 0.38LA-C-01 6.3 12 6.6 0.27LA-C-02 6.4 10 7.2 0.40LA-C-03 6.4 14 6.7 0.31LA-D-01 6.1 28 8.5 0.17LA-D-02 7.5 32 8.7 0.21LA-D-03 6.0 32 7.2 0.19LA-E-01 5.6 33 6.7 1.21LA-E-02 6.0 35 6.6 0.17UM-A-01 6.3 9 7.4 0.24UM-A-02 5.1 25 5.6 0.19UM-A-03 6.7 30 9.2 0.33UM-B-01 6.3 32 8.1 0.31UM-B-02 5.8 37 9.2 0.16UM-B-03 6.2 11 7.7 0.36UM-C-01 6.3 29 7.8 0.09UM-C-02 5.8 42 8.6 0.10UM-C-03 6.4 45 9.0 0.10UM-E-01 6.0 11 7.1 0.46UM-E-02 6.0 18 7.3 0.17UM-E-03 6.5 24 7.9 0.18Mean (Type A soil records) 6.0 23 7.3 0.24St. Dev. (Type A soil records) 0.5 10 1.2 0.10Mean / St. Dev. (Type A soil records) 0.08 0.43 0.16 0.44Mean (Type B soil records) 6.1 20 7.7 0.30St. Dev. (Type B soil records) 0.2 11 1.1 0.08Mean / St. Dev. (Type B soil records) 0.04 0.55 0.14 0.27Mean (Type C soil records) 6.3 25 7.6 0.21St. Dev. (Type C soil records) 0.2 16 1.0 0.14Mean / St. Dev. (Type C soil records) 0.04 0.62 0.13 0.64Mean (Type D soil records) 6.5 31 8.1 0.19St. Dev. (Type D soil records) 0.9 2 0.8 0.02Mean / St. Dev. (Type D soil records) 0.13 0.08 0.10 0.11Mean (Type E soil records) 6.0 24 7.1 0.44St. Dev. (Type E soil records) 0.3 10 0.6 0.45Mean / St. Dev. (Type E soil records) 0.05 0.42 0.08 1.02Mean (LA records) 6.2 22 7.2 0.33St. Dev. (LA records) 0.4 10 0.8 0.27Mean / St. Dev. (LA records) 0.07 0.45 0.11 0.82Mean (UM records) 6.1 26 7.9 0.22St. Dev. (UM records) 0.4 12 1.0 0.12Mean / St. Dev. (UM records) 0.07 0.46 0.13 0.53Mean (all records) 6.1 24 7.5 0.28St. Dev. (all records) 0.4 11 1.0 0.22Mean / St. Dev. (all records) 0.07 0.45 0.13 0.77Table 5.8: Results <strong>of</strong> the statistic characterization <strong>of</strong> the deformation demand.
Evaluation <strong>of</strong> seismic demands 191REFERENCESATC (1992) Guidelines for cyclic seismic testing <strong>of</strong> components <strong>of</strong> steel structures(ATC-24). ATC (Applied Technology Council). Redwood City, CA, USA.Branston, A., Boudreault, F., Rogers, C.A. (2003) Testing on steel frame / woodpanels shear walls. Progress Report, Departement <strong>of</strong> Civil Engineering and AppliedMechanics, McGill University. Montreal.COLA-UCI (2001) Report <strong>of</strong> a testing program <strong>of</strong> light-framed walls with woodsheathedshear panels. Final report to the City <strong>of</strong> Los Angeles Department <strong>of</strong>Building and Safety, Structural Engineers Association <strong>of</strong> Southern California, Irvine,CA,USA.Della Corte, G., De Matteis, G., Landolfo, R. (1999) A mathematical modelinterpretino the cyclic behaviour <strong>of</strong> steel beam-to-column joint. In Proceedings <strong>of</strong> theXVII Congresso CTA (CTA 1999). Napoli.Fulop, L.A. & Dubina, D. (2003). Are the cold-formed wall stud shear wallsdissipative systems in seismic resistant buildings? How much?. In Proceedings <strong>of</strong> the4 th International Conference on <strong>Behavior</strong> <strong>of</strong> <strong>Steel</strong> Structures in <strong>Seismic</strong> Areas(STESSA 2003). Mazzolani F.M. (ed.). A.A. Balchema Publishers.Ghersi, A. & Noce, (1999) Modalità di utilizzazione del programma DIANA. Istitutodi Scienza delle costruzioni, Università di Catania. Catania.Hadidi-Tamjed, H. (1987) Statistical response <strong>of</strong> inelastic SDOF systems subjected toearthquake. Ph.D. Dissertation. Department <strong>of</strong> Civil Engineering, StanfordUniversity.Krawinkler, H. (1996) Cycling loading histories for seismic experimentation onstructural components. Earthquake Spectra. Vol. 12, No.1:1-12.Nassar, A.A. & Krawinkler, H. (1991) <strong>Seismic</strong> demands for SDOF and MDOFsystems. John A. Blume Earthquake Engineering Center Report No.95, Department<strong>of</strong> Civil Engineering, Stanford University.Ordinanza PCM (2003) Primi elementi in materia di criteri generali per laclassificazione sismica del territorio nazionale e di normative tecniche per lecostruzioni in zona sismica. Ordinanza della Presidenza del Consiglio dei MinistriNo.3274/2003.prEN 1998-1 (2001) Eurocode 8: Design <strong>of</strong> structures for earthquake resistance –Part 1: General rules – <strong>Seismic</strong> actions and rules for buildings. CEN (EuropeanCommittee for Standardization). Bruxelles.Richard, R.M. & Abbott, B.J. (1975) Versatile elastic-plastic stress-strain formula.Journal <strong>of</strong> mechanical division. ASCE, Vol.101, No.4:511-515.
192 Chapter VSEAOSC (1997) Standard method <strong>of</strong> cyclic (reversed) load tests for shear resistance<strong>of</strong> framed walls for buildings. Structural Engineers Association <strong>of</strong> SouthernCalifornia (SEAOSC). Whittier, CA, USA.Serrette, R., Nguyen, H., Hall, G. (1996a) <strong>Shear</strong> wall values for light weight steelframing. Report No. LGSRG-3-96, Light Gauge <strong>Steel</strong> Research Group, Department<strong>of</strong> Civil Engineering, Santa Clara University. Santa Clara, CA, USA.Serrette, R., Hall, G., Nguyen, H. (1996b) Dynamic performance <strong>of</strong> light gauge steelframed shear walls. In Proceedings <strong>of</strong> the 13 th International Specialty Conference on<strong>Cold</strong>-formed <strong>Steel</strong> Structures. St. Louis, MO, USA: 487-498.Serrette, R., Encalada, J., Matchen, B., Nguyen, H., Williams, A. (1997b) Additionalshear wall values for light weight steel framing. Report No. LGSRG-1-97, LightGauge <strong>Steel</strong> Research Group, Department <strong>of</strong> Civil Engineering, Santa ClaraUniversity. Santa Clara, CA, USA.
193Chapter VIThe cyclic testThe second step <strong>of</strong> the experimental program, which consists in the cyclictesting <strong>of</strong> cold-formed steel stud shear wall (CFSSSW) sub-assemblies, isillustrated in this Chapter.The specimen tested under cyclic loading was nominally identical to thattested under monotonic loading. Moreover, also the test set-up and theinstrumentation adopted in the cyclic testing were the same as in themonotonic one. Consequently, because the description <strong>of</strong> the test specimen,test set-up and instrumentation have been previously illustrated in Chapter 4,only the test procedure and test results are presented in the current Chapter. Inparticular, the Section 6.1 is devoted to present the test procedure, while thetest results are presented in Section 6.2.
194 Chapter VI6.1 TEST PROCEDUREIn the cyclic test, the specimen was subjected to fully reversing cyclichorizontal displacements according to the definition <strong>of</strong> the deformation historyparameters, which have been illustrated in the Chapter 5 (Section 5.3.2). Inparticular, the test specimen was subjected to fully reversing cyclicdisplacements consisting <strong>of</strong> a series <strong>of</strong> stepwise increasing deformationcycles, by following a procedure similar to the one described in ATC (1992)for a multiple step test (see Chapter 5 Section 5.3.1).The load history consisted on applying three cycles <strong>of</strong> fully reversing,displacement-controlled load at each wall displacement incrementrepresenting 25% (= 1.5mm), 50% (= 3.0mm) and 75% (= 4.5mm) <strong>of</strong> theconventional yield limit state (YLS) displacement ( y = 6.0mm). Then, thewall displacement was increased for three load cycles to 100% <strong>of</strong> the YLSdisplacement. Next, cycles <strong>of</strong> displacement for three cycles each at 150%(= 9.0mm), 200% (= 12.0mm), 300% (= 12.05mm), 400%(= 24.0mm) and 600% (= 36.0mm) <strong>of</strong> the YLS displacement were applied.At this point the load history based on the statistic characterization <strong>of</strong>deformation demand, which has been illustrated in Section 5.3.2, wascompleted. However, to capture the behavior <strong>of</strong> the specimen under largerdisplacement amplitudes, other cycles <strong>of</strong> displacement for three cycles each at700% (= 42.0mm), 800% (= 48.0mm), 900% (= 54.0mm), 1000% (=60.0mm), 1100% (= 66.0mm), 1200% (= 72.0mm), and 1300% (=78.0mm) <strong>of</strong> the YLS displacement were applied.This test protocol involved displacements at rate <strong>of</strong> 2.00mm/s.The adopted test protocols are illustrated in Table 6.1 and Figure 6.1. TheFigure 6.2 shows the numerical cyclic response in terms <strong>of</strong> unit shear force (v)versus lateral displacement () curves obtained for the assumed load historyby using the model <strong>of</strong> the hysteretic behavior <strong>of</strong> CFSSSW systems, whichhave been already illustrated and calibrated in the Section 5.1. As a result, therepresentative values <strong>of</strong> predicted seismic demands, which have been obtainedfrom the assumed loading history, are:
The cyclic test 195 maximum level <strong>of</strong> deformation: (/ y ) max =6.0; number <strong>of</strong> inelastic excursion: N p =25; sum <strong>of</strong> normalized plastic deformation ranges: pi / y =6.2; ration between the mean value and the maximum value <strong>of</strong> the plasticdeformation range (( p ) av /( p ) max )=0.28.From the examination <strong>of</strong> the value <strong>of</strong> these parameters it can be deducedthat the adopted load history is reasonable. In fact, the mean deformationdemand parameters obtained from the statistic characterization are close tothose characterizing the adopted loading history, as illustrated in Table 6.2.Moreover, from comparison between the results obtained in this research,which takes in-to account the cyclic behavior <strong>of</strong> CFSSSW systems, and thosereported for a bilinear SDOF by Krawinkler (1996) ((N p =30 and pi / y =36in average, see Figs. 5.18 and 5.19) a reduction <strong>of</strong> the parameters associated tothe damage level may be noted in the case <strong>of</strong> CFSSSW systems. In particular,the decreasing is <strong>of</strong> 24% for N p and 79% for pi / y .No. <strong>of</strong>cyclesDisplacement(mm)3 1.5 253 3.0 503 4.5 753 6.0 1003 9.0 1503 12.0 2003 18.0 3003 24.0 4003 36.0 6003 42.0 7003 48.0 8003 54.0 9003 60.0 10003 66.0 11003 72.0 12003 78.0 1300Table 6.1: Cyclic test protocol.Displacement / YLSdisplacement (%)
196 Chapter VIload history based on thestatistic characterization<strong>of</strong> deformation demandFigure 6.1: Cyclic test protocol.Figure 6.2: Numerical cyclic response.
The cyclic test 197( p / y ) max N p pi / y ( p ) av /(( p ) maxStatistic characterization (mean value) 6.1 24 7.5 0.28Statistic characterization (st. dev. value) 0.4 11 1.0 0.22Adopted load history 6.0 25 6.2 0.28Table 6.2: Comparison between the deformation demand parameters obtained from thestatistic characterization (see Table 5.8) and the adopted loading history.6.2 TEST RESULTSThe measured responses <strong>of</strong> all instruments are reported in Appendix F.The global cyclic response may be represented by the unit shear resistance(v) vs. mean displacement (d) curve, where v and d have been defined inChapter 4 (see Equations 4.7 and 4.8). The v-d response curve is showed inFigure 6.3.In this Figure the values <strong>of</strong> the maximum (positive) experimental loadsobtained at the first (v EXP+1 ) and last (the third one) (v EXP+3 ) hysteretic loop arereported together with the minimum (negative) experimental loadscorresponding to the first (v EXP-1 ) and third (v EXP-3 ) hysteretic loop. Inparticular, the experimental maximum loads were obtained for a lateraldisplacement <strong>of</strong> +36mm. They resulted v EXP+1 =+16.4kN/m andv EXP+3 =+10.2kN/m for the first and third cycle, respectively. For the negativeloads the minimum values were found for a lateral displacement <strong>of</strong> -24mm.Their values were v EXP-1 =-14.8kN/m and v EXP-3 =-12.5kN/m for the first andthird cycle, respectively.From the comparison between the experimental loads obtained at the first(v EXP+1 and v EXP-1 ) and third (v EXP+3 and v EXP-3 ) hysteretic loops, a reduction <strong>of</strong>38% and 16% for positive (v EXP+1 vs. v EXP+3 ) and negative (v EXP-1 vs. v EXP-3 )shear strengths, respectively was noted. These results highlight a clear shearstrength degradation. From the comparison between the positive (v EXP+1 andv EXP+3 ) and negative (v EXP-1 and v EXP-3 ) experimental loads, for the firsthysteretic loop (v EXP+1 vs. v EXP-1 ) it was observed a higher shear capacity <strong>of</strong>11% for positive loads, while for the third hysteretic loop (v EXP+3 vs. v EXP-3 ) ahigher shear strength <strong>of</strong> 23% was found for negative loads.
198 Chapter VIIn Figure 6.3 the estimated lateral strength (v R ) is also reported. From thecomparison between the mean value <strong>of</strong> the experimental lateral strengthobtained at first hysteretic loop (v EXP1 = v EXP+1 - v EXP-1 / 2 = 15.6kN/m) and theestimated lateral strength (v R =17.9kN/m) it is possible to observe that, in thecase <strong>of</strong> loads applied cyclically, the semi-analytical calculation illustrated inthe Chapter 2 gives a 15% overestimation <strong>of</strong> shear strength. Moreover, if themean experimental value <strong>of</strong> experimental lateral strength obtained at thirdhysteretic loop (v EXP3 = v EXP+3 - v EXP-3 / 2 = 11.4kN/m) is considered, the semianalyticalprediction gives a 57% overestimation <strong>of</strong> the lateral strength.Experimental lateral strength(v EXP+1 = 16.4kN/m)Estimate lateral strength (v R = 17.9kN/m)Experimental lateral strength(v EXP+3 = 10.2kN/m)Experimental lateral strength(v EXP-3 = -12.5kN/m)Experimental lateral strength(v EXP-1 = -14.8kN/m)Estimate lateral strength (v R = 17.9kN/m)Figure 6.3: Unit shear resistance (v) vs. mean displacement (d) curve.During the test two different behaviors could be identified. For lateral displacement less than the one corresponding to maximumshear resistance the behavior <strong>of</strong> OSB sheathings-to-frame connectionsresulted from a combination <strong>of</strong> the tilting <strong>of</strong> the screws about the plane<strong>of</strong> the stud flange and the screw heads pulling through the OSBsheathings, as shown in Figure 6.4 a and b, respectively. The response<strong>of</strong> GWB sheathings-to-frame connections was characterized by acombination <strong>of</strong> the bearing <strong>of</strong> the GWB panels and the screws heads
The cyclic test 199pulling through the GWB panels, as shown in Figure 6.5 a and b,respectively.For these displacement levels the skeleton-to-panels deformation wascongruent. In fact, the wall framing deformed into a parallelogram andthe sheathings had rigid body rotation.For lateral displacement larger than the one corresponding to themaximum shear resistance, the heads <strong>of</strong> the end screws completelypulled through the sheathings in the bottom half <strong>of</strong> the walls (seeFigures 6.6 a and b for OSB and GWB sheathings, respectively) or, insome cases, the screws caused the rupture <strong>of</strong> the sheathing edges (seeFigs. 6.7 a and b for OSB and GWB sheathings, respectively). As aresult, both the OSB and GWB sheathings became unzipped along thepanel edges in the bottom half <strong>of</strong> the specimen (see Fig. 6.8).Moreover, for displacement levels more than 42mm also thedistortional buckling in the end studs <strong>of</strong> the wall 1 was observed, asshown in Figure 6.9.For these displacement levels the deformation <strong>of</strong> the wall framing stillhad the shape <strong>of</strong> a parallelogram, while due to the rupture sheathingto-frameconnections, the rotation <strong>of</strong> the sheathings was limited. Asshown in Figure 6.10.As in the case <strong>of</strong> monotonic test, in the cyclic test any deformation <strong>of</strong> theOSB sheathing-to-floor framing connections was not observed and the shearand the tension anchors did not suffer any type <strong>of</strong> failure.
200 Chapter VI(a) Tilting <strong>of</strong> the screws(b) Screw heads pull throughFigure 6.4: <strong>Behavior</strong> <strong>of</strong> OSB sheathing-to-frame connections.(a) Bearing <strong>of</strong> the panels(b) Screw heads pull throughFigure 6.5: <strong>Behavior</strong> <strong>of</strong> GWB sheathing-to-frame connections.
The cyclic test 201(a) OSB sheathing-to frame connections(b) GWB sheathing-to frame connectionsFigure 6.6: Failure <strong>of</strong> sheathing-to-frame connections due to screw heads pull through.(a) OSB sheathing-to frame connections(b) GWB sheathing-to frame connectionsFigure 6.7: Failure <strong>of</strong> sheathing-to-frame connections due to rupture <strong>of</strong> sheathing edges.
202 Chapter VIFigure 6.8: Unzipping <strong>of</strong> sheathings.Figure 6.9: Buckling <strong>of</strong> end studs.Figure 6.10: Deformation <strong>of</strong> walls for lateral displacement amplitudes more than 36mm.
The cyclic test 203The comparison between the cyclic and monotonic behavior is shown inFigure 6.11. In this Figure both cyclic and monotonic responses arerepresented through the unit shear resistance (v) vs. mean displacement (d)curves. From the comparison <strong>of</strong> these curves it may be observed as the cyclicloading produced a 11% reduction <strong>of</strong> the shear strength (by considering thecomparison between the lateral strength found in the monotonic test and theone obtained from the cyclic test at first hysteretic loop <strong>of</strong> positivedisplacements). On the contrary, by comparing the lateral strength obtainedfrom the monotonic test with the lateral strength corresponding to the cyclictest at third hysteretic loop <strong>of</strong> positive displacements the reduction <strong>of</strong> shearcapacity increased up to 45%; whereas, considering the shear strengthobtained for negative displacements a 20% and 32% degradation appeared inthe cyclic test at first and third hysteretic loops, respectively.Moreover, the difference between the cyclic and monotonic responsebecame significant for the unstable part <strong>of</strong> the behavior (for displacementamplitudes more than 36mm).The force (V) vs. displacement (d) response curves for the two walls isshown in Figure 6.12. In particular, in this Figure the force vs. displacementcurves obtained from measures <strong>of</strong> the actuators a1 and a2 have been reportedfor the walls 1 and 2, respectively. From the comparison <strong>of</strong> lateral responses<strong>of</strong> two walls observations similar to those deduced for the monotonic test arepossible: the walls had a similar behavior for positive displacements less than+36mm (displacement corresponding to the maximum shear load),while they exhibited different responses for larger displacements; considering the first hysteretic loops, the maximum shear loads (forpositive displacements) were +40 and +39kN for wall 1 and 2,respectively; therefore, the two walls revealed the same shear capacity;whereas considering the third hysteretic loops, the maximum shearloads were +26 and +23kN for wall 1 and 2, respectively; therefore,the wall 1 appeared to be lightly more resistant than wall 2 <strong>of</strong> about13%;
204 Chapter VIthe walls sowed similar response for smaller negative displacementswith significant variation <strong>of</strong> the behavior for displacements less than-36mm;considering the first hysteretic loops, the minimum shear loads (fornegative displacements) were -37 and -34kN for wall 1 and 2,respectively; consequently, the wall 1 was lightly more resistant thanwall 2 <strong>of</strong> about 9%; whereas considering the third hysteretic loops, theminimum shear loads were -26 and -23kN for wall 1 and 2,respectively; therefore, the difference between walls in terms <strong>of</strong> shearresistance was <strong>of</strong> 13%.Figure 6.11: Cyclic vs. monotonic behavior.
The cyclic test 205Figure 6.12: <strong>Shear</strong> (V) vs. displacement (d) curves for wall 1 and wall 2.REFERENCESATC (1992) Guidelines for cyclic seismic testing <strong>of</strong> components <strong>of</strong> steel structures(ATC-24). ATC (Applied Technology Council). Redwood City, CA, USA.Krawinkler, H. (1996) Cycling loading histories for seismic experimentation onstructural components. Earthquake Spectra. Vol. 12, No.1:1-12.
207Conclusions<strong>Seismic</strong> performance analysis <strong>of</strong> low-rise residential buildings built withcold-formed steel members has been the objective <strong>of</strong> this research.The attention has been focused on the seismic behavior <strong>of</strong> sheathed coldformedsteel stud shear walls through the evaluation <strong>of</strong> the seismic capacity(experimental phase), seismic demand (theoretical phase) and theircomparison.On the base <strong>of</strong> observations and results <strong>of</strong> the experimental and theoreticalinvestigation, the following conclusions may be drawn:Global experimental behavior: monotonic response vs. cyclic responseIn case <strong>of</strong> monotonic loading, for all displacement levels, wall framingsdeformed into a parallelogram and the sheathings had rigid body rotation, insuch a way that the evolution <strong>of</strong> the deformation was coherent with thesheathing-to-wall framing connections failure.In case <strong>of</strong> cyclic loading, the global behavior <strong>of</strong> the specimen was similar tothat observed in the monotonic testing for displacements less than the onecorresponding to the maximum shear capacity, while the skeleton-to-panelsdeformation was not congruent for higher displacement levels. Moreover, onlyin the case <strong>of</strong> cyclic testing, the distortional buckling in the end studs <strong>of</strong> thewall 1 was observed for displacement amplitudes more than 42mm.In both the monotonic and cyclic testing any deformation <strong>of</strong> the orientedstrand board (OSB) sheathing-to-floor framing connections was not observed,and the shear and the tension anchors did not suffer any type <strong>of</strong> failure.
208Local (sheathing-to-wall framing connections) experimental behavior:monotonic response vs. cyclic responseSheathing-to-wall framing connections in the case <strong>of</strong> monotonic testexhibited similar behavior, but they degraded more gradually than during thecyclic test.In particular, for lower displacement levels the behavior <strong>of</strong> OSB sheathingsto-frameconnections resulted from a combination <strong>of</strong> the tilting <strong>of</strong> the screwsabout the plane <strong>of</strong> the stud flange and the screw heads pulling through theOSB sheathings, while the response <strong>of</strong> gypsum wallboard (GWB) sheathingsto-frameconnections was characterized by combination <strong>of</strong> the bearing <strong>of</strong> theGWB panels and the screws heads pulling through the GWB panels.For higher lateral displacements, the heads <strong>of</strong> the end screws completelypulled through the sheathings or, in some cases, the screws caused the rupture<strong>of</strong> the sheathing edges. As a result, both the OSB and GWB sheathingsbecame unzipped along the panel edges.Comparison <strong>of</strong> shear responses <strong>of</strong> two walls: monotonic response vs. cyclicresponseFor both the monotonic and cyclic loading, the walls had similar behaviorfor small displacements, while they exhibited different response for largedisplacement levels.In particular, the wall 1 was more resistant than wall 2 <strong>of</strong> about 7% in thecase <strong>of</strong> the monotonic test. In the case <strong>of</strong> cyclic test, considering the firsthysteretic loops, the two walls revealed the same shear capacity for positivedisplacements, while the wall 1 was lightly more resistant than wall 2 <strong>of</strong> 9%for the negative ones; whereas, considering the third hysteretic loops the wall1 was lightly more resistant than wall 2 <strong>of</strong> 13% for both positive and negativedisplacements.Monotonic response vs. cyclic response in terms <strong>of</strong> shear strengthBy comparing the unit shear strength found in the monotonic test and theone obtained from cyclic test at the first hysteretic loops <strong>of</strong> positive
Conclusions 209displacements, the cyclic loading produced a 11% reduction. This reductionbecame <strong>of</strong> 20% for negative displacements; whereas, considering the shearstrength obtained in the cyclic test at third hysteretic loops the degradationincreased up to 45% and 32% for positive and negative displacements,respectively.Moreover, the difference between the cyclic and monotonic responsebecame significant for the unstable part <strong>of</strong> the behavior.<strong>Shear</strong> strength degradation under cyclic loadingFrom comparison between the experimental loads obtained at the first andthird hysteretic loops a clear shear strength degradation was observed. In factthe 38% and 16% reduction <strong>of</strong> shear capacity resulted for positive andnegative shear strengths, respectively.Effectiveness <strong>of</strong> lateral-load transfer from horizontal diaphragms to stud wallsThe lateral-load transfer from horizontal diaphragms to stud walls waseffective. In fact the floor-to-walls sliding was small in both the monotonicand cyclic tests.Reliability <strong>of</strong> semi-empirical calculation <strong>of</strong> the shear strengthThe calculation <strong>of</strong> shear strength by using the semi-empiricalmethodologies appears valid, it revealing a small conservative 3% predictionin the case <strong>of</strong> monotonic loading. On contrary, in the case <strong>of</strong> cyclic loading,the results give 15% and 57% overestimation <strong>of</strong> the shear capacity, if thehighest (first hysteretic loops) and lowest (third hysteretic loops) strengthcurves, respectively are used.Incremental Dynamic Analysis (IDA) resultsFrom the examination <strong>of</strong> the IDA results, a discrete ductility for theCFSSSW systems has been found. In fact, considering the S aeu /S aey ratio (inwhich S aey and S aeu are the elastic spectral accelerations corresponding to yield
210limit ( y ) and ultimate limit displacements ( u ), respectively) as a measure <strong>of</strong>seismic toughness, for all the examined earthquake records, this parameterranges from 1.26 to 3.89 with a mean value <strong>of</strong> 2.27 and a standard deviation<strong>of</strong> 0.62.The comparison between the results obtained for different soil types hasshown that the accelerograms recorded on soil type D are the most severe andthe least scattered; whereas, the least severe results have been found for soiltypes A and B, while the maximum dispersion <strong>of</strong> data has been obtained forthe soil type C.Definition <strong>of</strong> the load historyOnce fixed the maximum level <strong>of</strong> the normalized deformation(=(/ y ) max = u / y =36/6=6), as result <strong>of</strong> the statistic characterization <strong>of</strong>deformation history, the following parameters have been obtained: number <strong>of</strong>inelastic excursions (N p =24 in average); sum <strong>of</strong> the normalized plasticdeformation ranges ( pi / y =7.5 in average); ratio between the mean valueand the maximum value <strong>of</strong> the plastic deformation range(( p ) av /( p ) max =0.28 in average).From comparison between the results obtained in this research (that takein-to account the cyclic behavior <strong>of</strong> CFSSSW systems) and those reported fora bilinear SDOF system by Krawinkler (N p =30 and pi / y =36 in average,see Figs. 5.18 and 5.19) a reduction <strong>of</strong> the parameters associated to thedamage level has been observed in the case <strong>of</strong> CFSSSW systems. Inparticular, a decrease <strong>of</strong> 24% for N p and 79% for pi / y has been found.The test procedure, made <strong>of</strong> fully reversing cyclic displacements itconsisting <strong>of</strong> a series <strong>of</strong> stepwise increasing deformation cycles, which hasbeen derived in this research, results to be reasonable. In fact, the value <strong>of</strong>parameters associated to the damage level corresponding to this deformationhistory (N p =25, pi / y =6.2 and ( p ) av /( p ) max =0.28) are close to thoseobtained from statistic characterization.
A-1Appendix ASummary <strong>of</strong> existing experimental results
A-2 Appendix AMc Creless & Tarpy (1978)Label TestType <strong>of</strong>loading(1)wall size(2)aspectratio(2)opening(3)frame(4)frame fasteners(5)sheathing(6)sheathing fasteners(5)horizontal straps (HS)solid blocking (SB)(7)X-bracing(7)X-bracing fasteners(5)Type <strong>of</strong>anchorage(8)Type <strong>of</strong>failure(9)ultimateshearh x L h / Lsheathingarea ratiosteel gradestud sizetrack sizestud spacing typetype;thickness;orientationtype; exterior spacing;interior spacingHB sizeSB size size type; number kN/mM78-1 AM78-2 A*3660x3660 1.00- 6.03HB ?SB ?F 5.11M78-3 B 3660x4880 0.75 5.75M78-4 C 3660x7320 0.50 C (FT) 5.30M78-5 D 3050x3660 0.83 F 5.47M78-6 E M 3050x4880 0.63 1.00?C89x?x?x0.84*U92x38x0.84610LPHSC4.8x13GWB;12.7;?+GWB;12.7;?BHSC3.5x25; 305; 305BHSC3.5x25; 305; 305- - BCA 5.20M78-7 F 3050x7320 0.42 - C (FT) 5.66M78-8 G 2440x2440 1.00 5.84M78-9 H 2440x3660 0.67 F 5.84M78-10 I 2440x4880 0.50 6.84M78-11 J 2440x7320 0.33 C (FT) 5.66length in mm; ?: not known; -: not present(1) M: monotonic; C: cyclic(2) h: heigth <strong>of</strong> the wall; L: length <strong>of</strong> the wall(3) r =1 / [1 + Ao / (h Li)] with Ao: area <strong>of</strong> openings and Li the length <strong>of</strong> the full height wall segment(4) C__x__x__x__ (lipped channel section) web depth x flange size x lip size x thickness; U__x__x__ (unlipped channel section) web depth x flange size x thickness; *: double back-to-back coupled end studs(5) BHSC: bugle-head screws FHSC: flat head screws; LPHSC: low pr<strong>of</strong>ile head screws; MTHSC: modified truss head screws; WHSC: wafer head screws; __x__: nominal diameter x length; NA: Nails diameter; PI: Pins diameter(6) GSB: Gypsum sheathing board; GWB: Gypsum wallboard; FB: Fiber board; OSB: Oriented strand board; PLY: Plywood; SCS: <strong>Steel</strong> corrugated seet; SSS: <strong>Steel</strong> sheet sheathing;V: parallel to the frame (vertical); O: orthogonal to the frame (horizontal)(7) I__x__ flat strap wide x thickness(8) BCA: bolted clip angles; PCA: clip angles fixed wit powder actuated fasteners; HD: hold-down; SHD: strip-hold down(9) F: foundation uplift failure; S: stud buckling failure; X: X bracing yielding;C (FPO): connections failure (fasteners pull out failure); C (FPT): connections failure (fasteners pull throgh failure); C (FS): connections failure (fasteners shear failure); C (FT): connections failure (fasteners tilting failure); C (NS): connections faiO): c(net section failure);r
Summary <strong>of</strong> existing experimental results A-3Tarpy & Girard (1982)Label TestType <strong>of</strong>loading(1)wall size(2)aspectratio(2)opening(3)frame(4)frame fasteners(5)sheathing(6)sheathing fasteners(5)horizontal straps (HS)solid blocking (SB)(7)X-bracing(7)X-bracing fasteners(5)Type <strong>of</strong>anchorage(8)Type <strong>of</strong>failure(9)ultimateshearh x L h / Lsheathingarea ratiosteel gradestud sizetrack sizestud spacing typetype;thickness;orientationtype; exterior spacing;interior spacingHB sizeSB size size type; number kN/mTG82-1 A 2440x2440 1.00BCA6.03TG82-2 B 2440x3660 0.67 5.47TG82-3 E - 4.57TG82-4 GTG82-5 KA 36C89x25x13x0.84*U92x38x0.84610TG82-6 L M 1.00 ?TG82-7 M 2440x2440 1.00TG82-8 NGWB;12.7;H+GWB;12.7;HGSB;12.7;H+GWB;12.7;HGWB;12.7;H+PLY;12.7;HBHSC3.5x25; 305; 305BHSC3.5x25; 305; 305- 5.66PCA 3.82- - - F 6.20BCA 3.937.85TG82-9 P 5.28TG82-10 QGSB;12.7;H+GWB;12.7;HA 36C89x25x13x0.84*TG82-11 RBCA 6.93U92x38x0.84406length in mm; ?: not known; -: not present(1) M: monotonic; C: cyclic(2) h: heigth <strong>of</strong> the wall; L: length <strong>of</strong> the wall(3) r =1 / [1 + Ao / (h Li)] with Ao: area <strong>of</strong> openings and Li the length <strong>of</strong> the full height wall segment(4) C__x__x__x__ (lipped channel section) web depth x flange size x lip size x thickness; U__x__x__ (unlipped channel section) web depth x flange size x thickness; *: double back-to-back coupled end studs(5) BHSC: bugle-head screws FHSC: flat head screws; LPHSC: low pr<strong>of</strong>ile head screws; MTHSC: modified truss head screws; WHSC: wafer head screws; __x__: nominal diameter x length; NA: Nails diameter; PI: Pins diameter(6) GSB: Gypsum sheathing board; GWB: Gypsum wallboard; FB: Fiber board; OSB: Oriented strand board; PLY: Plywood; SCS: <strong>Steel</strong> corrugated seet; SSS: <strong>Steel</strong> sheet sheathing;V: parallel to the frame (vertical); O: orthogonal to the frame (horizontal)(7) I__x__ flat strap wide x thickness(8) BCA: bolted clip angles; PCA: clip angles fixed wit powder actuated fasteners; HD: hold-down; SHD: strip-hold down(9) F: foundation uplift failure; S: stud buckling failure; X: X bracing yielding;C (FPO): connections failure (fasteners pull out failure); C (FPT): connections failure (fasteners pull throgh failure); C (FS): connections failure (fasteners shear failure); C (FT): connections failure (fasteners tilting failure); C (NS): connections faiO): c(net section failure);4.38r
A-4 Appendix ATissel (1993)Label TestType <strong>of</strong>loading(1)wall size(2)aspectratio(2)opening(3)frame(4)frame fasteners(5)sheathing(6)sheathing fasteners(5)horizontal straps (HS)solid blocking (SB)(7)X-bracing(7)X-bracing fasteners(5)Type <strong>of</strong>anchorage(8)Type <strong>of</strong>failure(9)ultimateshearT93-1 1h x L h / Lsheathingarea ratiosteel gradestud sizetrack sizestud spacing type?C64x41x?x1.88U64x88x1.88type;thickness;orientation610 PLY;9.5;Vtype; exterior spacing;interior spacingHB sizeSB size size type; number kN/m24.31T93-2 2T93-3 3?C89x41x?x150U89x41x1.50610SC4.8x?; 102; 305 15.95OSB;11.1;V 18.21T93-4 4 M 2440x2440 1.00 1.00 ?SC4.2x?; 152; 305 - - - ? ? 10.92T93-5 5?C89x41x?x1.19U89x41x1.19610PLY;9.5;VSC4.2x?; 102; 305 14.01T93-6 6 OSB;11.1;V SC4.2x?; 76; 305 15.98T93-7 7T93-8 8?C64x41x?x1,88U64x88x1.88610OSB;15.1;V PI3.7; 152; 305 15.88PLY;15.9;V PI3.7; 102; 305 27.22length in mm; ?: not known; -: not present(1) M: monotonic; C: cyclic(2) h: heigth <strong>of</strong> the wall; L: length <strong>of</strong> the wall(3) r =1 / [1 + Ao / (h Li)] with Ao: area <strong>of</strong> openings and Li the length <strong>of</strong> the full height wall segment(4) C__x__x__x__ (lipped channel section) web depth x flange size x lip size x thickness; U__x__x__ (unlipped channel section) web depth x flange size x thickness; *: double back-to-back coupled end studs(5) BHSC: bugle-head screws FHSC: flat head screws; LPHSC: low pr<strong>of</strong>ile head screws; MTHSC: modified truss head screws; WHSC: wafer head screws; __x__: nominal diameter x length; NA: Nails diameter; PI: Pins diameter(6) GSB: Gypsum sheathing board; GWB: Gypsum wallboard; FB: Fiber board; OSB: Oriented strand board; PLY: Plywood; SCS: <strong>Steel</strong> corrugated seet; SSS: <strong>Steel</strong> sheet sheathing;V: parallel to the frame (vertical); O: orthogonal to the frame (horizontal)(7) I__x__ flat strap wide x thickness(8) BCA: bolted clip angles; PCA: clip angles fixed wit powder actuated fasteners; HD: hold-down; SHD: strip-hold down(9) F: foundation uplift failure; S: stud buckling failure; X: X bracing yielding;C (FPO): connections failure (fasteners pull out failure); C (FPT): connections failure (fasteners pull throgh failure); C (FS): connections failure (fasteners shear failure); C (FT): connections failure (fasteners tilting failure); C (NS): connections faiO): c(net section failure);r
Summary <strong>of</strong> existing experimental results A-5Serrette (1994)Label TestType <strong>of</strong>loading(1)wall size(2)aspectratio(2)opening(3)frame(4)frame fasteners(5)sheathing(6)sheathing fasteners(5)horizontal straps (HS)solid blocking (SB)(7)X-bracing(7)X-bracing fasteners(5)Type <strong>of</strong>anchorage(8)Type <strong>of</strong>failure(9)ultimateshearh x L h / Lsheathingarea ratiosteel gradestud sizetrack sizestud spacing typetype;thickness;orientationtype; exterior spacing;interior spacingHB sizeSB size size type; number kN/mS94-1 1 - - I51x0.84 ? 4.42S94-2 2 GWB;12.7;V SC3.5x?; 152; 305 - - 10.92+GWB;12.7;V SC3.5x?; 152; 305S94-3 3- I51x0.84 ? 13.56S94-4 4 A653 Grade SQ 33 SC3.5x?; 152; 305 15.31C152x41x?x0.84*S94-5 5 M 2440x2440 1.00 1.00? PLY;11.9;V PI2.9: 152; 305 ? ? 9.06U152x32x0.84S94-6 6 610 14.24S94-7 7 PLY;11.9;O SC4.2x?; 152; 305 6.14S94-8 8HB ?SB ?- - 14.30S94-9 9 PI2.9: 152; 305 - 8.76S94-10 10 11.50SC4.2x?; 152; 305 OSB;11.1;V HB ?S94-11 11 12.08SB ?S94-12 12 SC3.5x?; 152; 305 - 4.63length in mm; ?: not known; -: not present(1) M: monotonic; C: cyclic(2) h: heigth <strong>of</strong> the wall; L: length <strong>of</strong> the wall(3) r =1 / [1 + Ao / (h Li)] with Ao: area <strong>of</strong> openings and Li the length <strong>of</strong> the full height wall segment(4) C__x__x__x__ (lipped channel section) web depth x flange size x lip size x thickness; U__x__x__ (unlipped channel section) web depth x flange size x thickness; *: double back-to-back coupled end studs(5) BHSC: bugle-head screws FHSC: flat head screws; LPHSC: low pr<strong>of</strong>ile head screws; MTHSC: modified truss head screws; WHSC: wafer head screws; __x__: nominal diameter x length; NA: Nails diameter; PI: Pins diameter(6) GSB: Gypsum sheathing board; GWB: Gypsum wallboard; FB: Fiber board; OSB: Oriented strand board; PLY: Plywood; SCS: <strong>Steel</strong> corrugated seet; SSS: <strong>Steel</strong> sheet sheathing;V: parallel to the frame (vertical); O: orthogonal to the frame (horizontal)(7) I__x__ flat strap wide x thickness(8) BCA: bolted clip angles; PCA: clip angles fixed wit powder actuated fasteners; HD: hold-down; SHD: strip-hold down(9) F: foundation uplift failure; S: stud buckling failure; X: X bracing yielding;C (FPO): connections failure (fasteners pull out failure); C (FPT): connections failure (fasteners pull throgh failure); C (FS): connections failure (fasteners shear failure); C (FT): connections failure (fasteners tilting failure); C (NS): connections faiO): c(net section failure);r
A-6 Appendix ASerrette & Ogunfunmi (1996)Label TestType <strong>of</strong>loading(1)wall size(2)aspectratio(2)opening(3)frame(4)frame fasteners(5)sheathing(6)sheathing fasteners(5)horizontal straps (HS)solid blocking (SB)(7)X-bracing(7)X-bracing fasteners(5)Type <strong>of</strong>anchorage(8)Type <strong>of</strong>failure(9)ultimateshearh x L h / Lsheathingarea ratiosteel gradestud sizetrack sizestud spacing typetype;thickness;orientationtype; exterior spacing;interior spacingHB sizeSB size size type; number kN/mSO96-1A-P;A-2;A-3- - I51x0.84 WHSC4.2x13; 14 X 4.95SO96-2SO96-3B-P;B-2;B-3;B-4;B-5C-1;C-2;C-3;C-4M 2440x2440 1.00 1.00A446 Grade AC152x32x?x0.84*U152x?x0.84610WHSC4.2x13 - - - BCA 10.47GSB;12.7;VGWB;12.7;VBHSC3.5x25; 152; 305BHSC3.5x25; 152; 305I51x0.84 WHSC4.2x13; 14 C (FT) 14.06I51x0.84SO96-4 C-5+I51x0.84WHSC4.2x13; 1419.02WHSC4.2x13; 14length in mm; ?: not known; -: not present(1) M: monotonic; C: cyclic(2) h: heigth <strong>of</strong> the wall; L: length <strong>of</strong> the wall(3) r =1 / [1 + Ao / (h Li)] with Ao: area <strong>of</strong> openings and Li the length <strong>of</strong> the full height wall segment(4) C__x__x__x__ (lipped channel section) web depth x flange size x lip size x thickness; U__x__x__ (unlipped channel section) web depth x flange size x thickness; *: double back-to-back coupled end studs(5) BHSC: bugle-head screws FHSC: flat head screws; LPHSC: low pr<strong>of</strong>ile head screws; MTHSC: modified truss head screws; WHSC: wafer head screws; __x__: nominal diameter x length; NA: Nails diameter; PI: Pins diameter(6) GSB: Gypsum sheathing board; GWB: Gypsum wallboard; FB: Fiber board; OSB: Oriented strand board; PLY: Plywood; SCS: <strong>Steel</strong> corrugated seet; SSS: <strong>Steel</strong> sheet sheathing;V: parallel to the frame (vertical); O: orthogonal to the frame (horizontal)(7) I__x__ flat strap wide x thickness(8) BCA: bolted clip angles; PCA: clip angles fixed wit powder actuated fasteners; HD: hold-down; SHD: strip-hold down(9) F: foundation uplift failure; S: stud buckling failure; X: X bracing yielding;C (FPO): connections failure (fasteners pull out failure); C (FPT): connections failure (fasteners pull throgh failure); C (FS): connections failure (fasteners shear failure); C (FT): connections failure (fasteners tilting failure); C (NS): connections faiO): c(net section failure);r
Summary <strong>of</strong> existing experimental results A-7Serrette et al. (1996a)Label TestType <strong>of</strong>loading(1)wall size(2)aspectratio(2)opening(3)frame(4)frame fasteners(5)sheathing(6)sheathing fasteners(5)horizontal straps (HS)solid blocking (SB)(7)X-bracing(7)X-bracing fasteners(5)Type <strong>of</strong>anchorage(8)Type <strong>of</strong>failure(9)ultimateshearS+96a-1S+96a-2S+96a-3S+96a-4S+96a-5S+96a-6S+96a-7S+96a-81A6,1A71A2;1A3h x L h / Lsheathingarea ratiosteel gradestud sizetrack sizestud spacing typetype;thickness;orientationPLY;11.9;Vtype; exterior spacing;interior spacingHB sizeSB size size type; number kN/m2440x2440 1.00 OSB;11.1;V FHSC4.2x25; 152; 30513.291A5;1A6 OSB;11.1;O1E1;1E21D3;1D41D5;1D61D7;1D8 A653 Grade SQ 331F1;1F2M 2440x1220 2.00 1.00C89x41x10x0.84*C89x32x0.84610WHSC4.2x13HB I38x0.84SB ?FHSC4.2x25; 102; 305 20.61OSB;11.1;V FHSC4.2x25; 76; 305 25.33FHSC4.2x25; 51; 305 27.90BHSC3.5x32; 178; 178FHSC4.2x25; 152; 30515.5014.9114.96- - - HD C (FT) 17.75S+96a-91F3;1F4GWB;12.7;V+OSB;11.1;VBHSC3.5x32; 178; 178FHSC4.2x25; 102; 30522.77S+96a-101F5;1F6BHSC3.5x32; 178; 178FHSC4.2x25; 51; 30527.49S+96a-11S+96a-122A1;1A32A2;2A42440x2440 1.00GWB;12.7;O+GWB;12.7;OBHSC3.5x32; 178; 178BHSC3.5x32; 178; 178BHSC3.5x32; 102; 102BHSC3.5x32; 102; 102HB I38x0.84SB ?length in mm; ?: not known; -: not present(1) M: monotonic; C: cyclic(2) h: heigth <strong>of</strong> the wall; L: length <strong>of</strong> the wall(3) r =1 / [1 + Ao / (h Li)] with Ao: area <strong>of</strong> openings and Li the length <strong>of</strong> the full height wall segment(4) C__x__x__x__ (lipped channel section) web depth x flange size x lip size x thickness; U__x__x__ (unlipped channel section) web depth x flange size x thickness; *: double back-to-back coupled end studs(5) BHSC: bugle-head screws FHSC: flat head screws; LPHSC: low pr<strong>of</strong>ile head screws; MTHSC: modified truss head screws; WHSC: wafer head screws; __x__: nominal diameter x length; NA: Nails diameter; PI: Pins diameter(6) GSB: Gypsum sheathing board; GWB: Gypsum wallboard; FB: Fiber board; OSB: Oriented strand board; PLY: Plywood; SCS: <strong>Steel</strong> corrugated seet; SSS: <strong>Steel</strong> sheet sheathing;V: parallel to the frame (vertical); O: orthogonal to the frame (horizontal)(7) I__x__ flat strap wide x thickness(8) BCA: bolted clip angles; PCA: clip angles fixed wit powder actuated fasteners; HD: hold-down; SHD: strip-hold down(9) F: foundation uplift failure; S: stud buckling failure; X: X bracing yielding;C (FPO): connections failure (fasteners pull out failure); C (FPT): connections failure (fasteners pull throgh failure); C (FS): connections failure (fasteners shear failure); C (FT): connections failure (fasteners tilting failure); C (NS): connections faiO): c(net section failure);8.5112.39r-
A-8 Appendix ASerrette et al. (1996a,b)Label TestType <strong>of</strong>loading(1)wall size(2)aspectratio(2)opening(3)frame(4)frame fasteners(5)sheathing(6)sheathing fasteners(5)horizontal straps (HS)solid blocking (SB)(7)X-bracing(7)X-bracing fasteners(5)Type <strong>of</strong>anchorage(8)Type <strong>of</strong>failure(9)ultimateshearS+96ab-1S+96ab-2S+96ab-3S+96ab-4S+96ab-5S+96ab-6S+96ab-7S+96ab-8OSB1;OSB2h x L h / Lsheathingarea ratiosteel gradestud sizetrack sizestud spacing typetype;thickness;orientationOSB3;OSB4 OSB;11.1;VOSB5;OSB6OSB7;OSB8PLY1;PLY2C 2440x1220 2.00 1.00A653 Grade SQ 33C89x41x10x0.84*C89x32x0.84610PLY3;PLY4 PLY;11.9;VPLY5;PLY6PLY7;PLY8type; exterior spacing;interior spacingHB sizeSB size size type; number kN/mFHSC4.2x25; 152; 305 10.22FHSC4.2x25; 102; 305 13.32FHSC4.2x25; 76; 305 18.61WHSC4.2x13 FHSC4.2x25; 51; 305 - - - HD C (FT) 24.81FHSC4.2x25; 152; 305 11.38FHSC4.2x25; 102; 305 14.41FHSC4.2x25; 76; 305 21.34FHSC4.2x25; 51; 305 23.71length in mm; ?: not known; -: not present(1) M: monotonic; C: cyclic(2) h: heigth <strong>of</strong> the wall; L: length <strong>of</strong> the wall(3) r =1 / [1 + Ao / (h Li)] with Ao: area <strong>of</strong> openings and Li the length <strong>of</strong> the full height wall segment(4) C__x__x__x__ (lipped channel section) web depth x flange size x lip size x thickness; U__x__x__ (unlipped channel section) web depth x flange size x thickness; *: double back-to-back coupled end studs(5) BHSC: bugle-head screws FHSC: flat head screws; LPHSC: low pr<strong>of</strong>ile head screws; MTHSC: modified truss head screws; WHSC: wafer head screws; __x__: nominal diameter x length; NA: Nails diameter; PI: Pins diameter(6) GSB: Gypsum sheathing board; GWB: Gypsum wallboard; FB: Fiber board; OSB: Oriented strand board; PLY: Plywood; SCS: <strong>Steel</strong> corrugated seet; SSS: <strong>Steel</strong> sheet sheathing;V: parallel to the frame (vertical); O: orthogonal to the frame (horizontal)(7) I__x__ flat strap wide x thickness(8) BCA: bolted clip angles; PCA: clip angles fixed wit powder actuated fasteners; HD: hold-down; SHD: strip-hold down(9) F: foundation uplift failure; S: stud buckling failure; X: X bracing yielding;C (FPO): connections failure (fasteners pull out failure); C (FPT): connections failure (fasteners pull throgh failure); C (FS): connections failure (fasteners shear failure); C (FT): connections failure (fasteners tilting failure); C (NS): connections faiO): c(net section failure);r
Summary <strong>of</strong> existing experimental results A-9Serrette et al. (1997a)Label TestType <strong>of</strong>loading(1)wall size(2)aspectratio(2)opening(3)frame(4)frame fasteners(5)sheathing(6)sheathing fasteners(5)horizontal straps (HS)solid blocking (SB)(7)X-bracing(7)X-bracing fasteners(5)Type <strong>of</strong>anchorage(8)Type <strong>of</strong>failure(9)ultimateshearh x L h / Lsheathingarea ratiosteel gradestud sizetrack sizestud spacing typetype;thickness;orientationtype; exterior spacing;interior spacingHB sizeSB size size type; number kN/mS+97a-1 PLY-T1 BHSC3.5x25; 152; 305 C (FS) 15.02S+97a-2 PLY-T2-N PLY;11.9;V NA3.7; 152; 305 - 9.06S+97a-3 PLY-T4 15.62S+97a-4 PLY-T6 BHSC4.2x32; 152 ;305 C (FPO) 6.74S+97a-5 PLY-T7S+97a-6 PLYGYPPLY;11.9;O HB I31x0.84SB ?PLY;11.9;V+GWB;12.7;VNA3.7; 152; 305BHSC3.5X25; 178; 178 -15.62C (FS) 18.43S+97a-7 OSB-T1-N OSB;11.1;V NA3.7; 152; 305 8.86S+97a-8 OSB-T4 BHSC4.2x32; 152 ;305 C (FT) 13.81S+97a-9 OSB-T5 OSB;11.1;OS+97a-10 GYP-T1 M 2440x2440 1.00 1.00 A446 Grade AC152x41x10x0.84*S+97a-11 GYP-T2U152x25x0.84610WHSC4.2x13GWB;12.7;O+GWB;12.7;OBHSC3.5x25; 152 ;305BHSC3.5x25; 152 ;305HB I31x0.84SB ?14.30- - HD 9.8711.79S+97a-12 GYP-T3S+97a-13 GYP-T4GWB;12.7;V+GWB;12.7;VBHSC3.5x25; 178 ;178BHSC3.5x25; 178 ;178BHSC3.5x25; 102 ;102BHSC3.5x25; 102 ;10210.68C (FS) 14.71S+97a-14 FB-T4 FB;12.7;V BHSC3.5x25; 152 ;305 - 5.63S+97a-15 FB-T5 BHSC3.5x25; 102 ;305 6.04BHSC3.5x32; 152 ;305S+97a-16 FB-T6 FB;12.7;V10.83+ BHSC3.5x32; 152 ;305FB;12.7;V BHSC3.5x32; 102 ;305S+97a-17 FB-T715.21BHSC3.5x32; 102 ;305S+97a-18 FB-T8 FB;12.7;V BHSC3.5x32; 102 ;305 7.15length in mm; ?: not known; -: not present(1) M: monotonic; C: cyclic(2) h: heigth <strong>of</strong> the wall; L: length <strong>of</strong> the wall(3) r =1 / [1 + Ao / (h Li)] with Ao: area <strong>of</strong> openings and Li the length <strong>of</strong> the full height wall segment(4) C__x__x__x__ (lipped channel section) web depth x flange size x lip size x thickness; U__x__x__ (unlipped channel section) web depth x flange size x thickness; *: double back-to-back coupled end studs(5) BHSC: bugle-head screws FHSC: flat head screws; LPHSC: low pr<strong>of</strong>ile head screws; MTHSC: modified truss head screws; WHSC: wafer head screws; __x__: nominal diameter x length; NA: Nails diameter; PI: Pins diameter(6) GSB: Gypsum sheathing board; GWB: Gypsum wallboard; FB: Fiber board; OSB: Oriented strand board; PLY: Plywood; SCS: <strong>Steel</strong> corrugated seet; SSS: <strong>Steel</strong> sheet sheathing;V: parallel to the frame (vertical); O: orthogonal to the frame (horizontal)(7) I__x__ flat strap wide x thickness(8) BCA: bolted clip angles; PCA: clip angles fixed wit powder actuated fasteners; HD: hold-down; SHD: strip-hold down(9) F: foundation uplift failure; S: stud buckling failure; X: X bracing yielding;C (FPO): connections failure (fasteners pull out failure); C (FPT): connections failure (fasteners pull throgh failure); C (FS): connections failure (fasteners shear failure); C (FT): connections failure (fasteners tilting failure); C (NS): connections faiO): c(net section failure);r
A-10 Appendix ASerrette et al. (1997b) - Monotonic testsLabel TestType <strong>of</strong>loading(1)wall size(2)aspectratio(2)opening(3)frame(4)frame fasteners(5)sheathing(6)sheathing fasteners(5)horizontal straps (HS)solid blocking (SB)(7)X-bracing(7)X-bracing fasteners(5)Type <strong>of</strong>anchorage(8)Type <strong>of</strong>failure(9)ultimateshearS+97b-1S+97b-2S+97b-3S+97b-4S+97b-5S+97b-6S+97b-7S+97b-81;23;45;67;89;1011;1213;1415;16h x L h / L2440x1220 2.00sheathingarea ratiosteel gradestud sizetrack sizestud spacing typeA653 Grade SQ 33C89x43x13x0.84*U89x32x0.84type;thickness;orientationtype; exterior spacing;interior spacing610 - -A653 Grade SQ 33C89x43x13x1.09*U89x32x1.09610HB sizeSB size size type; number kN/mI114x0.84 MTHSC4.2x13; 20 9.82I191x0.84 MTHSC4.2x13; 30FHSC4.2x25; 152; 305 7.84M 1.00 MTHSC4.2x13 OSB;11.1;V FHSC4.2x25; 102; 305 - HD 14.972440x610 4.00A653 Grade SQ 33C89x43x13x0.84*U89x32x0.84610FHSC4.2x25; 51; 305- -SSS;0.46;? MTHSC4.2x13; 152; 305 7.17SSS;0.69;? MTHSC4.2x13; 102; 305 C (NS) 14.452440x1220 2.00 SSS;0.46;? MTHSC4.2x13; 152; 305 7.05length in mm; ?: not known; -: not present(1) M: monotonic; C: cyclic(2) h: heigth <strong>of</strong> the wall; L: length <strong>of</strong> the wall(3) r =1 / [1 + Ao / (h Li)] with Ao: area <strong>of</strong> openings and Li the length <strong>of</strong> the full height wall segment(4) C__x__x__x__ (lipped channel section) web depth x flange size x lip size x thickness; U__x__x__ (unlipped channel section) web depth x flange size x thickness; *: double back-to-back coupled end studs(5) BHSC: bugle-head screws FHSC: flat head screws; LPHSC: low pr<strong>of</strong>ile head screws; MTHSC: modified truss head screws; WHSC: wafer head screws; __x__: nominal diameter x length; NA: Nails diameter; PI: Pins diameter(6) GSB: Gypsum sheathing board; GWB: Gypsum wallboard; FB: Fiber board; OSB: Oriented strand board; PLY: Plywood; SCS: <strong>Steel</strong> corrugated seet; SSS: <strong>Steel</strong> sheet sheathing;V: parallel to the frame (vertical); O: orthogonal to the frame (horizontal)(7) I__x__ flat strap wide x thickness(8) BCA: bolted clip angles; PCA: clip angles fixed wit powder actuated fasteners; HD: hold-down; SHD: strip-hold down(9) F: foundation uplift failure; S: stud buckling failure; X: X bracing yielding;C (FPO): connections failure (fasteners pull out failure); C (FPT): connections failure (fasteners pull throgh failure); C (FS): connections failure (fasteners shear failure); C (FT): connections failure (fasteners tilting failure); C (NS): connections faiO): c(net section failure);S12.8026.63r
Summary <strong>of</strong> existing experimental results A-11Serrette et al. (1997b) - Cyclic testsLabel TestType <strong>of</strong>loading(1)wall size(2)aspectratio(2)opening(3)frame(4)frame fasteners(5)sheathing(6)sheathing fasteners(5)horizontal straps (HS)solid blocking (SB)(7)X-bracing(7)X-bracing fasteners(5)Type <strong>of</strong>anchorage(8)Type <strong>of</strong>failure(9)ultimateshearS+97b-9S+97b-10S+97b-11S+97b-12S+97b-13S+97b-14S+97b-15S+97b-16S+97b-17S+97b-18S+97b-19S+97b-20S+97b-21S+97b-22sheathingarea ratiosteel gradestud sizetrack sizestud spacing typetype;thickness;orientationtype; exterior spacing;interior spacingHB sizeSB size size type; number kN/mh x L h / LA1;A2 A653 Grade SQ 33 PLY;11.9;V FHSC4.2x25; 76; 305 C25.90A3;C89x43x13x0,84 int.FHSC4.2x25; 51; 305 31.96A4C89x43x13x1.09* endsA5;U89x32x0.84A6610 OSB;11.1;V FHSC4.2x25; 76; 305 C (FT)22.23A7;A8B1;B2B3;B42440x1220 2.00C 1.00A653 Grade SQ 33C89x43x13x1.09*U89x32x1.09610 PLY;11.9;V FHSC4.2x25; 152; 305A653 Grade SQ 33C89x43x13x1.37*U89x32x1.37610C1;C2 - -C3;C4D1;D2E1;E2E3;E4E5;E6A653 Grade SQ 33C89x43x13x0.84*U89x32x0.84610FHSC4.2x25; 51; 305 30.03- -C (FT) 13.02MTHSC4.2x13 - HD C (FS) 13.19I114x0.84 MTHSC4.2x13; 20S11.98I191x0.84 MTHSC4.2x13; 30 12.24SSS;0.46;? MTHSC4.2x13; 152; 305 C (NS) 5.72FHSC4.2x25; 152; 305 S 10.52OSB;11.1;V FHSC4.2x25; 102; 305- -2440x610 4.00 FHSC4.2x25; 51; 305 23.70F1;F2 SSS;0.69;? MTHSC4.2x13; 102; 305 S+CF3;(FPO+NS)MTHSC4.2x13; 51; 305F4length in mm; ?: not known; -: not present(1) M: monotonic; C: cyclic(2) h: heigth <strong>of</strong> the wall; L: length <strong>of</strong> the wall(3) r =1 / [1 + Ao / (h Li)] with Ao: area <strong>of</strong> openings and Li the length <strong>of</strong> the full height wall segment(4) C__x__x__x__ (lipped channel section) web depth x flange size x lip size x thickness; U__x__x__ (unlipped channel section) web depth x flange size x thickness; *: double back-to-back coupled end studs(5) BHSC: bugle-head screws FHSC: flat head screws; LPHSC: low pr<strong>of</strong>ile head screws; MTHSC: modified truss head screws; WHSC: wafer head screws; __x__: nominal diameter x length; NA: Nails diameter; PI: Pins diameter(6) GSB: Gypsum sheathing board; GWB: Gypsum wallboard; FB: Fiber board; OSB: Oriented strand board; PLY: Plywood; SCS: <strong>Steel</strong> corrugated seet; SSS: <strong>Steel</strong> sheet sheathing;V: parallel to the frame (vertical); O: orthogonal to the frame (horizontal)(7) I__x__ flat strap wide x thickness(8) BCA: bolted clip angles; PCA: clip angles fixed wit powder actuated fasteners; HD: hold-down; SHD: strip-hold down(9) F: foundation uplift failure; S: stud buckling failure; X: X bracing yielding;C (FPO): connections failure (fasteners pull out failure); C (FPT): connections failure (fasteners pull throgh failure); C (FS): connections failure (fasteners shear failure); C (FT): connections failure (fasteners tilting failure); C (NS): connections faiO): c(net section failure);16.4314.6417.09r
A-12 Appendix ANAHB (1997)Label TestType <strong>of</strong>loading(1)wall size(2)aspectratio(2)opening(3)frame(4)frame fasteners(5)sheathing(6)sheathing fasteners(5)horizontal straps (HS)solid blocking (SB)(7)X-bracing(7)X-bracing fasteners(5)Type <strong>of</strong>anchorage(8)Type <strong>of</strong>failure(9)ultimateshearh x L h / Lsheathingarea ratiosteel gradestud sizetrack sizestud spacing typetype;thickness;orientationtype; exterior spacing;interior spacingHB sizeSB size size type; number kN/mN97-1 1 1.00N97-2 2A0.76M 2440x12190 0.20N97-3 2B 0.76?C89x38x?x0.84 SC4.2x?U?x?x?610GWB;12.7;V+SC3.5x?; 178; 254OSB;11.1;V SC4.2x?; 152; 305- - -HD C (FPT)15.409.56- F 4.56N97-4 4 0.48 HD C (FPT) 4.78length in mm; ?: not known; -: not present(1) M: monotonic; C: cyclic(2) h: heigth <strong>of</strong> the wall; L: length <strong>of</strong> the wall(3) r =1 / [1 + Ao / (h Li)] with Ao: area <strong>of</strong> openings and Li the length <strong>of</strong> the full height wall segment(4) C__x__x__x__ (lipped channel section) web depth x flange size x lip size x thickness; U__x__x__ (unlipped channel section) web depth x flange size x thickness; *: double back-to-back coupled end studs(5) BHSC: bugle-head screws FHSC: flat head screws; LPHSC: low pr<strong>of</strong>ile head screws; MTHSC: modified truss head screws; WHSC: wafer head screws; __x__: nominal diameter x length; NA: Nails diameter; PI: Pins diameter(6) GSB: Gypsum sheathing board; GWB: Gypsum wallboard; FB: Fiber board; OSB: Oriented strand board; PLY: Plywood; SCS: <strong>Steel</strong> corrugated seet; SSS: <strong>Steel</strong> sheet sheathing;V: parallel to the frame (vertical); O: orthogonal to the frame (horizontal)(7) I__x__ flat strap wide x thickness(8) BCA: bolted clip angles; PCA: clip angles fixed wit powder actuated fasteners; HD: hold-down; SHD: strip-hold down(9) F: foundation uplift failure; S: stud buckling failure; X: X bracing yielding;C (FPO): connections failure (fasteners pull out failure); C (FPT): connections failure (fasteners pull throgh failure); C (FS): connections failure (fasteners shear failure); C (FT): connections failure (fasteners tilting failure); C (NS): connections faiO): c(net section failure);r
Summary <strong>of</strong> existing experimental results A-13Selenikovich et al. (1999)Label TestType <strong>of</strong>loading(1)wall size(2)aspectratio(2)opening(3)frame(4)frame fasteners(5)sheathing(6)sheathing fasteners(5)horizontal straps (HS)solid blocking (SB)(7)X-bracing(7)X-bracing fasteners(5)Type <strong>of</strong>anchorage(8)Type <strong>of</strong>failure(9)ultimateshearS+99-1S+99-2A monotonicwithoutGWBA cyclicstabilizedwithoutGWBh x L h / Lsheathingarea ratiosteel gradestud sizetrack sizestud spacing typetype;thickness;orientationtype; exterior spacing;interior spacingHB sizeSB size size type; number kN/mM 11.85C 1.00OSB;11.1;V BHSC4.2x?; 152 ;305GWB;12.7;V BHSC4.2x?; 178; 254M+14.69S+99-3 A monotonicwith GWBOSB;11.1;V BHSC4.2x?; 152; 305S+99-4 B monotonic M 7.55B cyclic0.76 350S150-33S+99-5C 2440x12200 0.20C89x38x?x0.84* LPHSC4.2x? - - - HD C (FPT) 6.38stabilizedU89x38x0.84S+99-6 C monotonic M 5.07C cyclic0.56S+99-7C4.27stabilizedS+99-8 D monotonic M OSB;11.1;V BHSC4.2x?; 152 ;305 4.67D cyclic0.48S+99-9C3.68stabilizedS+99-10 E monotonic M 2.81E cyclic0.30S+99-11C2.04stabilizedlength in mm; ?: not known; -: not present(1) M: monotonic; C: cyclic(2) h: heigth <strong>of</strong> the wall; L: length <strong>of</strong> the wall(3) r =1 / [1 + Ao / (h Li)] with Ao: area <strong>of</strong> openings and Li the length <strong>of</strong> the full height wall segment(4) C__x__x__x__ (lipped channel section) web depth x flange size x lip size x thickness; U__x__x__ (unlipped channel section) web depth x flange size x thickness; *: double back-to-back coupled end studs(5) BHSC: bugle-head screws FHSC: flat head screws; LPHSC: low pr<strong>of</strong>ile head screws; MTHSC: modified truss head screws; WHSC: wafer head screws; __x__: nominal diameter x length; NA: Nails diameter; PI: Pins diameter(6) GSB: Gypsum sheathing board; GWB: Gypsum wallboard; FB: Fiber board; OSB: Oriented strand board; PLY: Plywood; SCS: <strong>Steel</strong> corrugated seet; SSS: <strong>Steel</strong> sheet sheathing;V: parallel to the frame (vertical); O: orthogonal to the frame (horizontal)(7) I__x__ flat strap wide x thickness(8) BCA: bolted clip angles; PCA: clip angles fixed wit powder actuated fasteners; HD: hold-down; SHD: strip-hold down(9) F: foundation uplift failure; S: stud buckling failure; X: X bracing yielding;C (FPO): connections failure (fasteners pull out failure); C (FPT): connections failure (fasteners pull throgh failure); C (FS): connections failure (fasteners shear failure); C (FT): connections failure (fasteners tilting failure); C (NS): connections faiO): c(net section failure);7.91r
A-14 Appendix AFulop & Dubina (2002)Label TestType <strong>of</strong>loading(1)wall size(2)aspectratio(2)opening(3)frame(4)frame fasteners(5)sheathing(6)sheathing fasteners(5)horizontal straps (HS)solid blocking (SB)(7)X-bracing(7)X-bracing fasteners(5)Type <strong>of</strong>anchorage(8)Type <strong>of</strong>failure(9)ultimateshearh x L h / Lsheathingarea ratiosteel gradestud sizetrack sizestud spacing typetype;thickness;orientationtype; exterior spacing;interior spacingHB sizeSB size size type; number kN/mFD02-1 O M - - - 0.28FD02-2 I MSCS;0.5;O SC4.8x22; 114; 22914.69FD02-3 I C 12.68FD02-4 II MSCS;0.5;OGWB;12,T;VSC4.8x22; 114; 229 - - 16.59FD02-5 II C 1.00SCS;0,5;OGWB;12.5;VSC4.8x22; 250; 25015.95FD02-6 III M 2440x3600 0.68FD02-7 III C?C150x?x?x1.5*u154x?x1.5600?- -I110x1,5+ ?I110x1,5? 15.32F 14.87FD02-8 IV M 0.70SCS;0.5;O SC4.8x22; 114; 22911.17FD02-9 IV C 0.70 10.49FD02-10 OSB I M 1.00- -21.88FD02-11 OSB I C 1.00OSB;10;V BHSC4.8x22; 105; 25019.40FD02-12 OSB II M 0.70 12.33FD02-13 OSB II C 0.70 12.76length in mm; ?: not known; -: not present(1) M: monotonic; C: cyclic(2) h: heigth <strong>of</strong> the wall; L: length <strong>of</strong> the wall(3) r =1 / [1 + Ao / (h Li)] with Ao: area <strong>of</strong> openings and Li the length <strong>of</strong> the full height wall segment(4) C__x__x__x__ (lipped channel section) web depth x flange size x lip size x thickness; U__x__x__ (unlipped channel section) web depth x flange size x thickness; *: double back-to-back coupled end studs(5) BHSC: bugle-head screws FHSC: flat head screws; LPHSC: low pr<strong>of</strong>ile head screws; MTHSC: modified truss head screws; WHSC: wafer head screws; __x__: nominal diameter x length; NA: Nails diameter; PI: Pins diameter(6) GSB: Gypsum sheathing board; GWB: Gypsum wallboard; FB: Fiber board; OSB: Oriented strand board; PLY: Plywood; SCS: <strong>Steel</strong> corrugated seet; SSS: <strong>Steel</strong> sheet sheathing;V: parallel to the frame (vertical); O: orthogonal to the frame (horizontal)(7) I__x__ flat strap wide x thickness(8) BCA: bolted clip angles; PCA: clip angles fixed wit powder actuated fasteners; HD: hold-down; SHD: strip-hold down(9) F: foundation uplift failure; S: stud buckling failure; X: X bracing yielding;C (FPO): connections failure (fasteners pull out failure); C (FPT): connections failure (fasteners pull throgh failure); C (FS): connections failure (fasteners shear failure); C (FT): connections failure (fasteners tilting failure); C (NS): connections faiO): c(net section failure);r-
Summary <strong>of</strong> existing experimental results A-15Branston et al. (2003)Label TestType <strong>of</strong>loading(1)wall size(2)aspectratio(2)opening(3)frame(4)frame fasteners(5)sheathing(6)sheathing fasteners(5)horizontal straps (HS)solid blocking (SB)(7)X-bracing(7)X-bracing fasteners(5)Type <strong>of</strong>anchorage(8)Type <strong>of</strong>failure(9)ultimateshearh x L h / Lsheathingarea ratiosteel gradestud sizetrack sizestud spacing typetype;thickness;orientationtype; exterior spacing;interior spacingHB sizeSB size size type; number kN/mB+03-1B+03-2OSB 4-8 USM- A, B, COSB 4-8 USC- A, B, CMC2440x1220 2.001.00A653 Grade SQ 33C89x41x10x0.84* OSB;11.1;V FHSC4.2x25; 102; 305U89x38x0.84610WHSC4.2x13 - - - HD C16.8016.00B+03-3B+03-4PLY 8-8 USM- A, B, CPLY 8-8 USC- A, B, CMC2440x2440 1.00A653 Grade SQ 33C89x41x10x0.84* PLY;11.9;V FHSC4.2x25; 152; 305U89x38x0.84610 11.80length in mm; ?: not known; -: not present(1) M: monotonic; C: cyclic(2) h: heigth <strong>of</strong> the wall; L: length <strong>of</strong> the wall(3) r =1 / [1 + Ao / (h Li)] with Ao: area <strong>of</strong> openings and Li the length <strong>of</strong> the full height wall segment(4) C__x__x__x__ (lipped channel section) web depth x flange size x lip size x thickness; U__x__x__ (unlipped channel section) web depth x flange size x thickness; *: double back-to-back coupled end studs(5) BHSC: bugle-head screws FHSC: flat head screws; LPHSC: low pr<strong>of</strong>ile head screws; MTHSC: modified truss head screws; WHSC: wafer head screws; __x__: nominal diameter x length; NA: Nails diameter; PI: Pins diameter(6) GSB: Gypsum sheathing board; GWB: Gypsum wallboard; FB: Fiber board; OSB: Oriented strand board; PLY: Plywood; SCS: <strong>Steel</strong> corrugated seet; SSS: <strong>Steel</strong> sheet sheathing;V: parallel to the frame (vertical); O: orthogonal to the frame (horizontal)(7) I__x__ flat strap wide x thickness(8) BCA: bolted clip angles; PCA: clip angles fixed wit powder actuated fasteners; HD: hold-down; SHD: strip-hold down(9) F: foundation uplift failure; S: stud buckling failure; X: X bracing yielding;C (FPO): connections failure (fasteners pull out failure); C (FPT): connections failure (fasteners pull throgh failure); C (FS): connections failure (fasteners shear failure); C (FT): connections failure (fasteners tilting failure); C (NS): connections faiO): c(net section failure);16.40r
B-1Appendix BSummary <strong>of</strong> objectives and results <strong>of</strong>existing experimental studies
B-2 Appendix BObjectives Authors ConclusionsTarpy (1980)- the use <strong>of</strong> cement plaster increases the shear strength and thestiffness- the use <strong>of</strong> two layer <strong>of</strong> GWB increases the shear capacity, whiledecreasing the shear stiffness, in comparison with single layerTarpy & Girard (1982)- the use <strong>of</strong> PLY panels increases the shear strength in comparisonwith GWB panels- the use <strong>of</strong> GWB panels increases the shear strength in comparisonwith GSB panelsSerrette et al. (1996a,b)- the PLY panels carry slightly higher loads in comparison with OSBpanels- walls with OSB panels on one side and GWS panels on the otherside exhibit similar failure behavior, but degrade more gradually thanwalls with OSB panels on one side alone- walls with GWB panels on both sides have much lower shearstrength than walls with OSB panels- PLY and OSB panels show a small difference in the cyclic shearstrengthbehaviour <strong>of</strong> differentsheathing typeeffect <strong>of</strong> sheathingorientation andcontribution <strong>of</strong> blockingSerrette et al. (1997a)Serrette et al. (1997b)Selenikovich et al. (1999)Fulop & Dubina (2002)Serrette & Ogunfunmi (1996)Serrette et al. (1997b)Gad et al. (1999a)Serrette & Ogunfunmi (1996)Serrette et al. (1997a)Sheathing- the behavior <strong>of</strong> the PLY and OSB panels is comparable- the strength <strong>of</strong> GWB and FBW is relatively low in comparison withPLY and OSB panels- the use <strong>of</strong> GWB panels on the interior <strong>of</strong> the wall and PLY panels onthe exterior produce a higher shear capacity, by approximately 18%,in comparison with the PLY panels only- the walls sheathed with SSS have a ductile behavior without suddendecreases in shear load capacity- the use <strong>of</strong> thick sheathings increases the shear resistance, but thefailure mode move from rupture at the edges <strong>of</strong> the sheathing to screwpull-out from the framing- adding GWB panels increases the shear strength and stiffness <strong>of</strong>fully sheathed walls under monotonic load- the behavior <strong>of</strong> GWB is satisfactory. In fact it could follow evenextreme deformation <strong>of</strong> the wall without significant damage- the use <strong>of</strong> X-B plus GWB reduces the permanent deflection andincreases the shear strength without decreasing the stiffness- the use <strong>of</strong> X-B plus GWB is not practical due to the need topretension the straps and the need for additional screws to connectthe straps- in the design <strong>of</strong> walls with X-B the designer must consider that theforce in the strap may be larger than that corresponding to the nominalyield strength- if X-B are installed on one side <strong>of</strong> the wall only, the effect <strong>of</strong>eccentricity should be consideredFor walls laterally braced with X-B only:- the initial tension in the X-B increases the frame stiffness and whenthe X-B yield then the true stiffness <strong>of</strong> the X-B system defines thestiffness <strong>of</strong> the frame- the type <strong>of</strong> strap bracing-to-plate connections governs the failureload and mechanismFor walls laterally braced with X-B and plasterboard:- when X-B and plasterboard are combined, the overall stiffness andstrength <strong>of</strong> the system is simple addition <strong>of</strong> individual contributionsfrom X-B and plasterboard- sheathings oriented horizontally exhibit slightly higher shear strengththan panels oriented vertically- the walls with blocked panels oriented horizontally provideessentially the same shear capacity but higher stiffness than acomparable wall with panels oriented vertically- when blocking is omitted from the walls with horizontal panels, theshear capacity <strong>of</strong> the wall is reduced by more than 50%
Summary <strong>of</strong> objectives and results <strong>of</strong> existing experimental studies B-3Objectives Authors ConclusionsTarpy & Girard (1982)effect <strong>of</strong> framing studsize, thickness andspacingSerrette et al. (1997b)Framing- the reduction <strong>of</strong> the stud spacing does not increase significantly theshear strength and stiffness- the use <strong>of</strong> thicker and back-to-back coupled end studs for the wallswith PLY and OSB panels allows to fully develop the shear strength <strong>of</strong>the panels-to-frame connections also in the cases in which densefasteners schedules are usedObjectives Authors Conclusionseffect <strong>of</strong> fastener type,size and spacingTarpy & Hauenstein (1978)Tarpy (1980)Tarpy & Girard (1982)Serrette et al. (1996a,b)Serrette et al. (1997a)Serrette et al. (1997b)Gad et al. (1999a)COLA-UCI (2001)Fastener- reduction <strong>of</strong> the fastener spacing around the wall perimeterincreases the shear strength- reduction <strong>of</strong> the fastener spacing increases the shear strength andstiffness- the use <strong>of</strong> welded stud to track connections provides the same shearstrength as screw connections- reduction <strong>of</strong> the fastener spacing increases significantly the shearstrength- the use <strong>of</strong> 3.7mm diameter nails decreases the maximum shearstrength in comparison with No.6 and No.8 screws- the maximum shear strength is not influenced by the size <strong>of</strong> thefastener- the failure mode for the specimens with No.6 screws is fracture <strong>of</strong>fasteners and thus walls with No.6 screws may fail at lower loads thanwalls with No.8 screws- for GWB and FB panels the reduction <strong>of</strong> the fastener spacingincreases significantly the shear strength- decreasing the screws spacing results in the increased maximumshear load- No.8 screws should be limited to 1,09mm thick framing; in fact, thisscrew behave well in the 0.84 and 1.09mm thick frames (screws pulloutor pull-trhough failure) but fractures in shear when 1.37mm thickframes are used- for walls laterally braced with X-B only the type <strong>of</strong> connectionsbetween the framing members dos not seem to have an influence onthe structural response <strong>of</strong> the braced frames- a reduction <strong>of</strong> the fastener spacing nonlinearly increases the shearstrength and stiffness for both the light-gauge steel framed and woodframed stud walls
B-4 Appendix BObjectives Authors ConclusionsNAHB (1997)- the calculation <strong>of</strong> the shear capacity using the “Perforated <strong>Shear</strong>Wall Design Method” appears valid, but reveals a conservativeprediction <strong>of</strong> ultimate shear strength- long, fully sheathed walls are significantly stiffer and stronger butinfluence <strong>of</strong> the openingless ductile than walls with openingssize- the predictions <strong>of</strong> the “Perforated <strong>Shear</strong> Wall Design Method” areSelenikovich et al. (1999)conservative at all levels <strong>of</strong> monotonic and cyclic loading- the strength <strong>of</strong> fully sheathed walls is affected more significantly bycyclic loading than walls with openings- for the aspect ratio varying between 0.33 and 1 shear strength isMc Creless & Tarpy (1978) independent <strong>of</strong> H/L ratio but shear stiffness increases for smaller H/Leffect <strong>of</strong> height/length(H/L) variationSerrette et al. (1996a,b)Serrette et al. (1997b)Geometryratio- the shear strength is practically the same for the H/L ratio varyingbetween 1 and 2- the shear strength appreciably decreases when the aspect ratioincreases from 2 to 4Objectives Authors ConclusionsTarpy (1980)- cyclic loading decreases shear strength and damage threshold leveleffect <strong>of</strong> cyclic loadingSerrette et al. (1996a,b)Gad et al. (1999a)Selenikovich et al. (1999)Fulop & Dubina (2002)Type <strong>of</strong> loading- PLY and OSB panels show a small difference in the cyclic shearstrength- the shear behavior <strong>of</strong> walls observed in cyclic tests is somewhat notas good as the shear behavior exhibited in monotonic tests for walls <strong>of</strong>similar constructions- as in the monotonic tests, in the cyclic tests the wall shear strengthincreases significantly with the reduction <strong>of</strong> the fastener spacing- for walls laterally braced with X-B only the dynamic characteristics <strong>of</strong>the frame are governed by the initial tension in the straps- cyclic loading does not influence the elastic behavior <strong>of</strong> the walls butreduces their deformation capacity- the strength <strong>of</strong> fully sheathed walls is affected more significantly bycyclic loading than walls with openings- very significant pinching and reduced energy dissipation characterizethe hysteretic behavior
Summary <strong>of</strong> objectives and results <strong>of</strong> existing experimental studies B-5Construction techniques and anchorage detailsObjectives Authors ConclusionsTarpy & Hauenstein (1978)- to avoid uplift failure it is recommended that a positive attachmentshould be furnished between the track and floor framing systemsTarpy (1980)- the corner anchorage influences the shear behavior dramatically- hold-down exhibits higher shear strength than bolt and washeranchors- densely spaced powder actuated fasteners (connected to asupporting concrete beam) provide similar restraint to the hold-down- the shear resistance dos not vary extensively when using differenttypes <strong>of</strong> interior shear anchorage- the use <strong>of</strong> a 45° stud placed at bottom corner between the chordmembers and the adjacent stud has little effect on the shear capacityeffect <strong>of</strong> constructiontechniques andanchorage detailsTarpy & Girard (1982)- when the bolt and washer anchorage details are used without clipangles the shear capacity decreases- the use <strong>of</strong> closely spaced powder actuated fasteners negligiblyincreases the shear behavior in comparison to using corner clips- it is recommended the use <strong>of</strong> clip angles- it is suggested a rigid attachment to connect the wall panel to thefloor or ro<strong>of</strong> framing systemsNAHB (1997)Gad et al. (1999a)- hold-down reduces uplift and increases the ultimate shear capacityby allowing more sheathing-to-frame screws to resist shear- in-plane brick veneer walls attached to the frame via clip-on ties dosnot contribute to the stiffness <strong>of</strong> the system- different displacements between the frame and the out-<strong>of</strong>-plane brickveneer walls are mainly accommodated by deformation <strong>of</strong> the studflanges rather than deformation <strong>of</strong> brick ties- the plasterboard combined with ceiling cornices, skirting board andset corner joints, resists about 60-70% <strong>of</strong> the applied racking loadwhereas the X-B resists 30-40%
B-6 Appendix BObjectives Authors Conclusionsdetermination <strong>of</strong> thedamage threshold levelMc Creless & Tarpy (1978)Tarpy & Hauenstein (1978)Tarpy (1980)Tarpy & Girard (1982)damage threshold level- the first noticeable wallboard damage occurrs:- at about 6 to 13mm total displacement (for the shorter walls)- at about 6mm (for the longer walls)- the real damage occurrs:- at about 13 to 19mm total displacement (for the shorter walls)- at about 6 to 13mm (for the longer walls).- a safety factor <strong>of</strong> 2.0 is recommended- cyclic loading decreases the damage threshold level- a safety factor <strong>of</strong> 2.0 is recommended to determine the design shearstrength from the ultimate shear strength for the type <strong>of</strong> stud shearwalls examinedsteel-frame versus wood-frameObjectives Authors Conclusions- the lateral load resisting mechanism for both W-F and S-F shearNAHB (1997)comparison betweenwalls appears to be similarsteel-frame (S-F) andwood-frame (W-F) COLA-UCI (2001)- with the same sheathing types and fastener spacing, S-F wallsexhibit somewhat higher shear strength and ductility but lesshysteretic damping than W-F wallsfull-scale tests versus small-scale testObjectives Authors Conclusionscomparison between fullscaleand small-scale Serrette et al. (1997a)test results- the normalized shear strength for small-scale tests is similar as thosefor full-scale tests, thus the small-scale tests are considered to beuseful in a evaluation <strong>of</strong> the relative resistance <strong>of</strong> different wallassemblies
C-1Appendix CEvaluation <strong>of</strong> seismic action and wall shearstrength for the study case
C-2 Appendix CEvaluation <strong>of</strong> seismic actionGeometry <strong>of</strong> the houseNumber <strong>of</strong> stories n= 2Length L= 11.4 mWide W= 7.0 mHeight H= 6.4 mRo<strong>of</strong> slope Tan()= 100 %Area A= 75 m 2Length <strong>of</strong> full height wall segments w i = 18.0 mUnit loadsDead loadsRo<strong>of</strong> g kR = 0.75 kN/m 2Floor g kF = 0.75 kN/m 2<strong>Walls</strong> g kW = 0.35 kN/m 2Snow loads q ks = 0.50 kN/m 2Live loads q kl = 2.00 kN/m 2<strong>Seismic</strong> weightTotal seismic weightW k,tot = G k + k Q kElement g k (kN/m 2 ) q k (kN/m 2 ) Area (m 2 ) G k (kN) Q k (kN) EI W k (kN)Ro<strong>of</strong> 0.75 0.50 106 80 38 0.30 91Floor 0.75 2.00 75 56 150 0.30 101<strong>Walls</strong> 0.35 0.00 90 32 0 32W k,tot = 224<strong>Seismic</strong> weight per unit surfacew k = W k,tot / A = 3.0 kN/m 2<strong>Seismic</strong> weight per unit lenght <strong>of</strong> full height wall segmentsw s = W k,tot / w i =12.5 kN/m
Evaluation <strong>of</strong> seismic action and wall shear strength for the study case C-3Type 1 (far field) Eurocode 8 Design elastic spectrum = 1 damping factor (=1 for a damping ratio =0.05)a g = 0.25g design peak ground accelerationS: soil factorT B and T C : limits <strong>of</strong> constant spectral acceleration branchT D : value that defines the beginning <strong>of</strong> the constant displacement response rangeSoil type S T B T C T DA 1 0.15 0.4 2B 1.2 0.15 0.5 2C 1.15 0.2 0.6 2D 1.35 0.2 0.8 2E 1.4 0.15 0.5 2ws/ gT 2k= 0.1 - 0.3 s first mode vibration periodk = 0.5 - 3.0 kN/mm/m stiffness per unit lenght <strong>of</strong> full height wall segmentsMaximum design elastic spectrum for first mode vibration period ranging from 0.1 to 0.3sSoil type Saed / gA 0.63B 0.75C 0.72D 0.84E 0.88max 0.88
C-4 Appendix C<strong>Seismic</strong> force per unit lenght <strong>of</strong> full height wall segmentsv SSaed wsSoil type v S (kN/m)A 7.9B 9.4C 9.0D 10.5E 11.0max 11.0
Evaluation <strong>of</strong> seismic action and wall shear strength for the study case C-5Evaluation <strong>of</strong> strength <strong>of</strong> wallsGeometry <strong>of</strong> the wallLength L= 2400 mmHeight H= 2500 mm<strong>Stud</strong>s spacing st s = 600 mmMaterials<strong>Steel</strong> grade: FeE350G (S350GD+Z/ZF) hot dipped galvanized (zinc coated) steel (EN10147)(Nominal yield strength f y =350MPa; nominal tensile strength f t =420MPa)Wood-based panels: Type 3 OSB (KRONOPLY 3 by KRONO FRANCE)Gypsum-based panels: GWB (PLACOLAST PLACO by BPB ITALIA)
C-6 Appendix CFailure modesFrameSheathing-to-frameconnectionsFrame-to-foundationconnections
Evaluation <strong>of</strong> seismic action and wall shear strength for the study case C-7Sheathing-to-frame connection failure [see Section 2.2.1 in Chapter 2 ]F SF, bstfdfu,sFSFFF SF,ss30.5 tfd fus2.1, ts3 .2,SF, bp3.5tsdufCDKDb,wminFSFv S-Ft s = 9.0 mm thickness <strong>of</strong> OSB sheathingst f = 1.0 mm thickness <strong>of</strong> the framed= 4.2 mm nominal diameter <strong>of</strong> screwsd u = 2.8 mm unthreaded diameter <strong>of</strong> screwsf b,w = 38 MPa dowel bearing strength <strong>of</strong> OSB sheathingsf u,s = 420 Mpa ultimate tensile strength <strong>of</strong> members <strong>of</strong> the frameF S-F,ss = 4.0 kN shear design resistance <strong>of</strong> screwsBearing strength <strong>of</strong> steel frameF S-F,bs = 3.70 kN (=2.1) [see Eq. 2.5 in Chapter 2 ]Tilting strength <strong>of</strong> steel studsF S-F,ts = 2.75 kN [see Eq. 2.6 in Chapter 2 ]<strong>Shear</strong> resistance <strong>of</strong> fastenerF S-F,ss =4.00 kNBearing strength <strong>of</strong> wood panelsF S-F,bp = 2.44 kN (K D =2.20; C D =1.6) [see Eq. 2.8 in Chapter 2 ]Sheathing-to-frame connection strengthF S-F = 2.44 kN [see Eq. 2.4 in Chapter 2 ]
C-8 Appendix C<strong>Shear</strong> strenght <strong>of</strong> the wall associated to sheathing-to-frame connection strengthEasley et al.'s methoda= 1250 mm length <strong>of</strong> the panelH= 2500 mm heigth <strong>of</strong> the wallst s = 600 mm studs spacingm= 1.0 number <strong>of</strong> interior studef s = 150 mm edge fasteners spacingff s = 300 mm field fasteners spacingn s =15 number <strong>of</strong> side fasteners, excluding those at the endn e =9 number <strong>of</strong> end fastenersn si =7 number <strong>of</strong> fasteners in each interior stud, excluding those at the endIe = S x 2 ei = 1350000 Is = S x 2 si = 0 = n s + 4I e + 2 n si I s / L = 18.46Force in the side fasteners s = F s / v a = H / = 135.46 [see Eq. 2.9 in Chapter 2 ]Force in the end fasteners ei = F ei / v a = ((a/n e ) 2 + (2x eimax H/(a)) 2 ) 1/2 = 190.26 [see Eq. 2.10 in Chapter 2 ] max = max { s ; ei } = 190.26<strong>Shear</strong> strenght <strong>of</strong> the wall associated to sheathing-to-frame connection strengthv S-F =1.40 (*) 1 / max F S-F = 17.94 KN/m [see Eq. 2.11 in Chapter 2 ]<strong>Shear</strong> strenght <strong>of</strong> the wall associated to sheathing-to-frame connection strengthSimplified methodef s = 150 mm edge fasteners spacingn' e = 6.67 number <strong>of</strong> end screws per unit lengthv S-F = 1.40 (*) n' e F S-F = 22.75 KN/m [see Eq. 2.12 in Chapter 2 ]* Assuming that the adding <strong>of</strong> GWB to the opposite side <strong>of</strong> the wall assembly increases theshear strength by about 40%
Evaluation <strong>of</strong> seismic action and wall shear strength for the study case C-9Frame (stud buckling) failure [see Section 2.2.2 in Chapter 2 ]<strong>Stud</strong> back-to-back coupled C100x50x10x1.00H = 2500 mm heigth <strong>of</strong> studsf ys = 350 Mpa yield strength <strong>of</strong> the studsf us = 420 Mpa ultimate tensile strength <strong>of</strong> the studsL x = 2500 mm unbraced length (out <strong>of</strong> plane - x-z plane)L y = 300 mm unbraced length (in plane - x-y plane)N b,out = 66.96 kN out <strong>of</strong> plane axial strength [see Eq. 2.17 in Chapter 2 ]N b,in = 74.03 kN in plane axial strength [see Eq. 2.17 in Chapter 2 ]Frame strengthF F = min(N b,out ; N b,in )=66.96 kN<strong>Shear</strong> strenght <strong>of</strong> the wall associated to frame strengthv F = F S-F / H = 26.78 KN/m [see Eq. 2.40 in Chapter 2 ]The valuation <strong>of</strong> axial strength <strong>of</strong> studs has been carried out using“<strong>Cold</strong>Form” computer program (Included in: A., Ghersi, R., Landolfo, F.M.,Mazzolani (2002) Design <strong>of</strong> metallic cold-formed thin-walled members. SponPress). The results provided by Details window <strong>of</strong> this program are reported inthe following.EVALUATION OF THE EFFECTIVE CROSS-SECTION:Element 1 single edge fold stiffener, connected at end 2geometrical data: bP = 8.91 mm t = 1.00 mm bP/t = 8.91end 2 - fr = 1.41 mmaxial stresses: end 1 - sigma = 350.00 MPaend 2 - sigma = 350.00 MPacoefficients: k sigma = 0.5000lambdaP = 0.5414rho = 1.0000the element is fully effectiveElement 2doubly supported elementgeometrical data: bP = 47.83 mm t = 1.00 mm bP/t = 47.83end 1 - fr = 1.41 mmend 2 - fr = 1.41 mmaxial stresses: end 1 - sigma = 350.00 MPaend 2 - sigma = 350.00 MPa
C-10 Appendix Ccoefficients: k sigma = 4.0000lambdaP = 1.0271rho = 0.7651beff = 36.59 mm be1 = 18.30 mm be2 = 18.30 mmElement 3doubly supported elementgeometrical data: bP = 97.83 mm t = 1.00 mm bP/t = 97.83end 1 - fr = 1.41 mmend 2 - fr = 1.41 mmaxial stresses: end 1 - sigma = 350.00 MPaend 2 - sigma = 350.00 MPacoefficients: k sigma = 4.0000lambdaP = 2.1008rho = 0.4262beff = 41.69 mm be1 = 20.85 mm be2 = 20.85 mmElement 4doubly supported elementgeometrical data: bP = 47.83 mm t = 1.00 mm bP/t = 47.83end 1 - fr = 1.41 mmend 2 - fr = 1.41 mmaxial stresses: end 1 - sigma = 350.00 MPaend 2 - sigma = 350.00 MPacoefficients: k sigma = 4.0000lambdaP = 1.0271rho = 0.7651beff = 36.59 mm be1 = 18.30 mm be2 = 18.30 mmElement 5 single edge fold stiffener, connected at end 1geometrical data: bP = 8.91 mm t = 1.00 mm bP/t = 8.91end 1 - fr = 1.41 mmaxial stresses: end 1 - sigma = 350.00 MPaend 2 - sigma = 350.00 MPacoefficients: k sigma = 0.5000lambdaP = 0.5414rho = 1.0000the element is fully effectiveElement 6 single edge fold stiffener, connected at end 2geometrical data: bP = 8.91 mm t = 1.00 mm bP/t = 8.91end 2 - fr = 1.41 mmaxial stresses: end 1 - sigma = 350.00 MPaend 2 - sigma = 350.00 MPacoefficients: k sigma = 0.5000lambdaP = 0.5414rho = 1.0000the element is fully effectiveElement 7doubly supported elementgeometrical data: bP = 47.83 mm t = 1.00 mm bP/t = 47.83end 1 - fr = 1.41 mmend 2 - fr = 1.41 mmaxial stresses: end 1 - sigma = 350.00 MPaend 2 - sigma = 350.00 MPacoefficients: k sigma = 4.0000lambdaP = 1.0271rho = 0.7651beff = 36.59 mm be1 = 18.30 mm be2 = 18.30 mmElement 8doubly supported element
Evaluation <strong>of</strong> seismic action and wall shear strength for the study case C-11geometrical data: bP = 97.83 mm t = 1.00 mm bP/t = 97.83end 1 - fr = 1.41 mmend 2 - fr = 1.41 mmaxial stresses: end 1 - sigma = 350.00 MPaend 2 - sigma = 350.00 MPacoefficients: k sigma = 4.0000lambdaP = 2.1008rho = 0.4262beff = 41.69 mm be1 = 20.85 mm be2 = 20.85 mmElement 9doubly supported elementgeometrical data: bP = 47.83 mm t = 1.00 mm bP/t = 47.83end 1 - fr = 1.41 mmend 2 - fr = 1.41 mmaxial stresses: end 1 - sigma = 350.00 MPaend 2 - sigma = 350.00 MPacoefficients: k sigma = 4.0000lambdaP = 1.0271rho = 0.7651beff = 36.59 mm be1 = 18.30 mm be2 = 18.30 mmElement 10 single edge fold stiffener, connected at end 1geometrical data: bP = 8.91 mm t = 1.00 mm bP/t = 8.91end 1 - fr = 1.41 mmaxial stresses: end 1 - sigma = 350.00 MPaend 2 - sigma = 350.00 MPacoefficients: k sigma = 0.5000lambdaP = 0.5414rho = 1.0000the element is fully effectiveEFFECTIVENESS OF EDGE STIFFENERSEdge stiffener for element 2spring stiffness: k = 0.1296 MPageometrical data: Ar = 27.3 mm2 Ir = 212 mm4yGr = 92.97 mm zGr = 97.84 mmbuckling stress: sig cr,s = 176.24 MPareduction: lambda = 1.4092 chi = 0.4411 chiR = 0.4411Edge stiffener for element 4spring stiffness: k = 0.1296 MPageometrical data: Ar = 27.3 mm2 Ir = 212 mm4yGr = 92.97 mm zGr = 2.16 mmbuckling stress: sig cr,s = 176.24 MPareduction: lambda = 1.4092 chi = 0.4411 chiR = 0.4411Edge stiffener for element 7spring stiffness: k = 0.1296 MPageometrical data: Ar = 27.3 mm2 Ir = 212 mm4yGr = 7.03 mm zGr = 97.84 mmbuckling stress: sig cr,s = 176.24 MPareduction: lambda = 1.4092 chi = 0.4411 chiR = 0.4411Edge stiffener for element 9spring stiffness: k = 0.1296 MPageometrical data: Ar = 27.3 mm2 Ir = 212 mm4yGr = 7.03 mm zGr = 2.16 mm
C-12 Appendix Cbuckling stress: sig cr,s = 176.24 MPareduction: lambda = 1.4092 chi = 0.4411 chiR = 0.4411gross cross-sectioneffective cross-sectionEVALUATION OF DESIGN BUCKLING RESISTANCEarea <strong>of</strong> the gross section: Ag = 423 mm2area <strong>of</strong> the effective section: Aeff = 212 mm2reduction factor: betaA = 0.4998x-z plan:buckling length: l = 2.50 mradius <strong>of</strong> gyration <strong>of</strong> gross cross-section: i = 40.58 mmslenderness: lambda = 61.61relative slenderness: lambda bar = 0.5660imperfection factor: alfa = 0.21reduction factor: chi = 0.9024Design buckling resistance: Nb,Rd = 66.96 kNx-y plan:buckling length: l = 0.30 mradius <strong>of</strong> gyration <strong>of</strong> gross cross-section: i = 24.02 mmslenderness: lambda = 12.49relative slenderness: lambda bar = 0.1147imperfection factor: alfa = 0.34reduction factor: chi = 1.0000Design buckling resistance: Nb,Rd = 74.03 kN
Evaluation <strong>of</strong> seismic action and wall shear strength for the study case C-13Frame-to-foundation failure [see Section 2.2.3 in Chapter 2 ]Tension frame-to-foundation failurehold-down(F (F-F)N,hd )hold-down – to - frameminF (FF)N(F (F-F)N,hd-fr )hold-down – to – foundation(F (F-F)N,hd-fo ) v (F-F)NF (F-F)N,hd-fr) = 184.05 kN [see Eq. 2.45 in Chapter 2 ]F (F-F)N,hd-fo) = 258.40 kN [see Eq. 2.51 in Chapter 2 ]Tension frame-to-foundation connection strengthF (F-F)N = 184.05 kN [see Eq. 2.41 in Chapter 2 ]<strong>Shear</strong> strenght <strong>of</strong> the wall associated to the tension frame-to-foundation connection strengthv (F-F)N = F (F-F)N / H = 73.62 KN/m [see Eq. 2.59 in Chapter 2 ]<strong>Shear</strong> frame-to-foundation failure<strong>Shear</strong> anchor – to – frame connection(F (F-F)V,a-fr )<strong>Shear</strong> anchor – to – foundation connection(F (F-F)V,a-fo )minF (FF)Vv (F-F)VF (F-F)V,a-fr) = 9.00 kN [see Eq. 2.47 in Chapter 2 ]F (F-F)V,a-fo) = 8.70 kN [see Eq. 2.57 in Chapter 2 ]<strong>Shear</strong> frame-to-foundation connection strengthF (F-F)V = 8.70 kN [see Eq. 2.54 in Chapter 2 ]<strong>Shear</strong> strenght <strong>of</strong> the wall associated to the tension frame-to-foundation connection strengthv (F-F)V = n' F (F-F)V = 87.00 KN/m (n'=10) [see Eq. 2.60 in Chapter 2 ]<strong>Shear</strong> strenght <strong>of</strong> the wall associated to the <strong>of</strong> the frame-to-foundation connection strengthv F-F = 73.62 KN/m [see Eq. 2.58 in Chapter 2 ]
C-14 Appendix CUnit shear strength [see Section 2.2 in Chapter 2 ]v min v ; v ; vS FFF F[see Eq. 2.3 in Chapter 2 ]Soil type v S (kN/m)v S-F17.9v F26.8v F-F73.6min 17.9Sheathing-to-frame connection failureframeconnectionsheathing
D-1Appendix DConstruction details <strong>of</strong> the sub-assemblyspecimen
D-2 Appendix Djoist track(U 260X40X1.00mm)bearing stiffener(C 100x50x10x1.00mm)Joist(C 260x40x10x1.50mmstud track(U 100X40X1.00mm)end stud(back-to-back coupledC 100x50x10x1.00mm)intermediate stud(C 100x50x10x1.00mm)stud track(U 100X40X1.00mm)X-bracingGlobal 3D view <strong>of</strong> specimen (without sheathings).
Construction details <strong>of</strong> the sub-assembly specimen D-3A close-up view <strong>of</strong> the tension connection between the wall and the foundation.A close-up view <strong>of</strong> the shear connection between the wall and the foundation.
D-4 Appendix DA close-up view <strong>of</strong> the back-to-back connection <strong>of</strong> coupled end studs.A close-up view <strong>of</strong> the connection between the intermediate stud and the bottom stud track.
Construction details <strong>of</strong> the sub-assembly specimen D-5joist track (U 260X40X1.00mm)bearing stiffener(C 100x50x10x1.00mm)No. 2 4.2x13mm modified truss head self drilling screwsstud track (U 100X40X1.00mm)joist (C 260x40x10x1.50mm)stud (C 100x50x10x1.00mm)A close-up view <strong>of</strong> the connection between the joist and the joist track.joist track (U 260X40X1.00mm)bearing stiffener(C 100x50x10x1.00mm)stud track (U 100X40X1.00mm)joist (C 260x40x10x1.50mm)4.2x13mm modified truss head self drilling screwsspaced at 75mm on centerA close-up view <strong>of</strong> the connection between the joist track and the top stud track.
D-6 Appendix DClose-up views <strong>of</strong> the connection between the joist, the joist track and the bearing stiffener.A close-up view <strong>of</strong> the connection between the joist and the X-bracing.
Construction details <strong>of</strong> the sub-assembly specimen D-71250x1450x18.0mm Type 3 OSB(KRONOPLY by KRONOFRANCE)floor sheathing1200x2500x12.5mm GWB(PLACOLAST by BPB ITALIA)interior wall sheathing1250x2500x9.0mm Type 3 OSB(KRONOPLY by KRONOFRANCE)exterior wall sheathingGlobal 3D view <strong>of</strong> specimen (with sheathings)
D-8 Appendix DGlobal 3D view <strong>of</strong> connections between the external sheathing and the wall framing
Construction details <strong>of</strong> the sub-assembly specimen D-93.5x25mm bugle head self drilling screwsspaced at 150mm (at the perimeter)with edge distance equal to 10mmstud track (U 100X40X1.00mm)stud (C 100x50x10x1.00mm)3.5x25mm bugle head self drilling screwsspaced at 300mm (in the field)1200x2500x12.5mm GWB(PLACOLAST by BPB ITALIA)interior wall sheathingstud track (U 100X40X1.00mm)Global 3D view <strong>of</strong> connections between the internal sheathing and the wall framing
D-10 Appendix D4.2x32mm flat head self drilling screwsspaced at 150mm(for sheathing-to-joist track connections)1250x1450x18.0mm Type 3 OSB(KRONOPLY by KRONOFRANCE)floor sheathing4.2x32mm flat head self drilling screwsspaced at 250mm(for sheathing-to-joist connections)joist track(U 260X40X1.00mm)Global 3D view <strong>of</strong> connections between the floor sheathing and the floor framing
E-1Appendix EMonotonic test results
E-2 Appendix Ea2Wall 2d2a1Wall 1actuator load (a1; a2)LVDT (d1; d2)Instrument arrangement for the floor.d1aw1w4w5w2i1Wall 1actuator load (a1)LVDT (w1,1; w1,2; w1,3; w1,4;w1,5)i2w3f1Wall 2actuator load (a2)LVDT (w2,1; w2,2; w2,3; w2,4;w2,5)clinometer (i2,1; i2,2)Instrument arrangement for the walls.
Monotonic test results E-35045kN40353025201510500 10 20 30 40 50 60 70 80 90 100 110 120 130 140 150mmForce vs. displacement measured by the actuator a1.5045kN40353025201510500 10 20 30 40 50 60 70 80 90 100 110 120 130 140 150mmForce measured by the actuator a1 vs. displacement measured by the LVDT w1,1.
E-4 Appendix E5045kN40353025201510500 1 2 3 4 5 6 7mmForce measured by the actuator a1 vs. displacement measured by the LVDT w1,2.5045kN40353025201510500 1 2 3 4 5 6 7mmForce measured by the actuator a1 vs. displacement measured by the LVDT w1,3
Monotonic test results E-5kN504540353025201510mm-15 -14 -13 -12 -11 -10 -9 -8 -7 -6 -5 -4 -3 -2 -1 050Force measured by the actuator a1 vs. displacement measured by the LVDT w1,4.5045kN40353025201510500 1 2 3 4 5 6 7 8 9 10 11 12 13 14 15mmForce measured by the actuator a1 vs. displacement measured by the LVDT w1,5.
E-6 Appendix E5045kN40353025201510500 10 20 30 40 50 60 70 80 90 100 110 120 130 140 150mmForce measured by the actuator a1 vs. displacement measured by the LVDT d1.5045kN40353025201510500 1 2 3 4 5 6 7mmForce measured by the actuator a1 vs. displacement measured by the LVDT f1.
Monotonic test results E-75045kN40353025201510500 10 20 30 40 50 60 70 80 90 100 110 120 130 140 150mmForce vs. displacement measured by the actuator a2.5045kN40353025201510500 10 20 30 40 50 60 70 80 90 100 110 120 130 140 150mmForce measured by the actuator a2 vs. displacement measured by the LVDT w2,1.
E-8 Appendix E5045kN40353025201510500 1 2 3 4 5 6 7mmForce measured by the actuator a2 vs. displacement measured by the LVDT w2,2.5045kN40353025201510500 1 2 3 4 5 6 7mmForce measured by the actuator a2 vs. displacement measured by the LVDT w2,3.
Monotonic test results E-9kN504540353025201510mm-15 -14 -13 -12 -11 -10 -9 -8 -7 -6 -5 -4 -3 -2 -1 050Force measured by the actuator a2 vs. displacement measured by the LVDT w2,4.5045kN40353025201510500 1 2 3 4 5 6 7 8 9 10 11 12 13 14 15mmForce measured by the actuator a2 vs. displacement measured by the LVDT w2,5.
E-10 Appendix E5045kN40353025201510500 10 20 30 40 50 60 70 80 90 100 110 120 130 140 150mmForce measured by the actuator a2 vs. displacement measured by the LVDT d2.5045kN40353025201510500 1 2 3 4 5 6 7mmForce measured by the actuator a2 vs. displacement measured by the LVDT f2.
Monotonic test results E-11deg504540353025201510mm-5 -4 -3 -2 -1 050Force measured by the actuator a2 vs. rotation measured by the clinometer i2,1.deg504540353025201510mm-5 -4 -3 -2 -1 050Force measured by the actuator a2 vs. rotation measured by the clinometer i2,2.
F-1Appendix FCyclic test results
F-2 Appendix Factuator load (a1; a2)LVDT (d1; d2)Instrument arrangement for the floor.Wall 1actuator load (a1)LVDT (w1,1; w1,2; w1,3; w1,4;w1,5)Wall 2actuator load (a2)LVDT (w2,1; w2,2; w2,3; w2,4;w2,5)clinometer (i2,1; i2,2)Instrument arrangement for the walls.
Cyclic test results F-3Force vs. displacement measured by the actuator a1.Force measured by the actuator a1 vs. displacement measured by the LVDT w1,1.
F-4 Appendix FForce measured by the actuator a1 vs. displacement measured by the LVDT w1,2.Force measured by the actuator a1 vs. displacement measured by the LVDT w1,3
Cyclic test results F-5Force measured by the actuator a1 vs. displacement measured by the LVDT w1,4.Force measured by the actuator a1 vs. displacement measured by the LVDT w1,5.
F-6 Appendix FForce measured by the actuator a1 vs. displacement measured by the LVDT d1.Force measured by the actuator a1 vs. displacement measured by the LVDT f1.
Cyclic test results F-7Force vs. displacement measured by the actuator a2.Force measured by the actuator a2 vs. displacement measured by the LVDT w2,1.
F-8 Appendix FForce measured by the actuator a2 vs. displacement measured by the LVDT w2,2.Force measured by the actuator a2 vs. displacement measured by the LVDT w2,3.
Cyclic test results F-9Force measured by the actuator a2 vs. displacement measured by the LVDT w2,4.Force measured by the actuator a2 vs. displacement measured by the LVDT w2,5.
F-10 Appendix FForce measured by the actuator a2 vs. displacement measured by the LVDT d2.Force measured by the actuator a2 vs. displacement measured by the LVDT f2.
Cyclic test results F-11Force measured by the actuator a2 vs. rotation measured by the clinometer i2,1.Force measured by the actuator a2 vs. rotation measured by the clinometer i2,2.