Paper Title (use style: paper title) - ATM Seminar
Paper Title (use style: paper title) - ATM Seminar
Paper Title (use style: paper title) - ATM Seminar

Create successful ePaper yourself
Turn your PDF publications into a flip-book with our unique Google optimized e-Paper software.
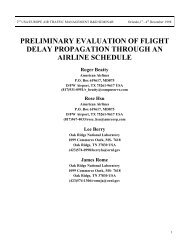
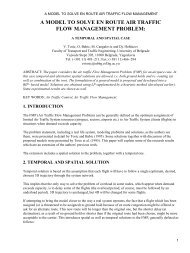
first scenario is a weight based landing fee and a ticket tax perticket; the second is a fixed landing fee and a fixed charge foren route navigation.Figure 5. Percent Difference Operating and Passenger Cost per PassengerContour Curve for Regional Jet and Turboprop for Varying Market Densities.A. Weight-Based Landing Fee, Variable Ticket TaxThe most common landing fee is levied in proportion toaircraft weight [4]. The determination of landing fees variesairport to airport; in this study, fees are based on MaximumTakeoff Weight (MTOW) and are charged the current landingfee at San Francisco International Airport ($3.01/1000 lbs) forillustrative purposes [26].The current ticket tax in the United States is set at 7.5%[24] of each ticket. The basis for the passenger ticket price <strong>use</strong>din this study will be the operating costs per passenger found in§III.C. The ticket tax charges can be seen in Table VI.TABLE VI.PASSENGER TICKET TAXES PER TICKET.AircraftModelNarrowBodyRegionalJetFuel Price(FP)CoefficientAircraft CategorySL*FPCoefficientStage Length(SL)CoefficientConstant1.9*10 -1 2.0*10 -3 1.9*10 -3 6.3*10 -14.2*10 -1 4.3*10 -3 2.7*10 -3 1.1Turboprop 6.1*10 -2 8.8*10 -4 5.2*10 -3 3.3*10 -1Figure 6. Percent Difference Operating Cost per Passenger Contour Curvefor Narrow Body Comparison and Turboprop for Varying Market Densities.V. AIR NAVIATION INFRASTRUCTURE COSTSThis study will cover two categories of air navigationinfrastructure costs: en route and terminal.As discussed in [4], en route air traffic navigation chargesare included to capture the value of providing air trafficmanagement services in the en route airspace. In the UnitedStates, these are captured by a passenger ticket tax. Such a feecould also be collected as a fixed sum. Both methods of enroute air navigation fee collection will be evaluated.Landing fees are fees levied by an airport on an arrivingaircraft to capture the value of providing service in the terminalairspace. Landing fees incorporate a charge for using theairfield. They can be weight based, flat, or a variation on flatlanding fees that vary depending on the peak period [4]. In theUnited States, terminal area air navigation fees are generallycollected as part of the landing fee, and the funds go towardfunding services and facilities to both arriving and departingaircraft, including landing and traffic control aids (see [4] for adetailed description).The following section will investigate the minimum costfleet composition under the two infrastructure chargingscenarios. One scenario represents the current charging schemein the United States, and the second represents a future scenario<strong>use</strong>d to capture more of the costs to provide <strong>ATM</strong> services. TheThe resulting operating, passenger, and infrastructure (total)cost functions are shown in Table VII.TABLE VII. TOTAL COST FUNCTIONS PER OPERATION AND PERPASSENGER FOR AIRCRAFT CATEGORIES,WITH VARIABLE INFRASTRUCTURECHARGES.AircraftModelNarrowBodyRegionalJetFPCoeff.Aircraft CategorySL*FPCoeff.Per OperationSLCoeff.Const.2.8*10 2 2.3 1.3*10 1 5.6*10 32.0*10 2 2.1 4.3 1.9*10 3Turboprop 4.8*10 1 7.0*10 -1 1.7*10 1 3.1*10 3Per PassengerNarrowBody2.7 2.2*10 -2 1.2*10 -1 5.4*10 1RegionalJet6.0 6.1*10 -2 1.3*10 -1 5.7*10 1Turboprop 8.7*10 -1 1.3*10 -2 3.1*10 -1 5.6*10 1B. Flat Landing Fee, Fixed En Route Navigation ChargeA flat landing fee would also be levied per arrival, butinstead of varying with weight, the fee would be equal for allaircraft. The rationalization for this kind of landing fee, asdescribed in Ref. [25], is that an operation precludes anotheroperation. The values from the variable fee scenario for thenarrow body will be <strong>use</strong>d for all aircraft types in the fixed fee
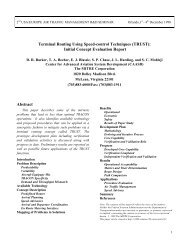
scenario. The per operation and per passenger equations can beseen in Table 8; note the narrow body values are the same as inTable 7.TABLE VIII. TOTAL COST FUNCTIONS PER OPERATION AND PERPASSENGER FOR AIRCRAFT CATEGORIES,WITH FIXED INFRASTRUCTURECHARGES.AircraftModelFPCoeff.Aircraft CategorySL*FPCoeff.SLCoeff.Const.Per OperationNarrow Body 2.8*10 2 2.3 1.3*10 1 5.6*10 3Regional Jet 2.1*10 2 2.1 4.4 2.2*10 3Turboprop 6.5*10 1 8.0*10 -1 1.7*10 1 3.4*10 3Per PassengerNarrow Body 2.7 2.2*10 -2 1.2*10 -1 5.4*10 1Regional Jet 6.2 6.1*10 -2 1.3*10 -1 5.8*10 1Turboprop 1.2 1.5*10 -2 3.1*10 -1 5.7*10 1In Table 8, the values for the regional jet and the turbopropare mostly higher than those in Table 7, reflecting a highercharge borne by fewer passengers for these aircraft in a fixedfee scenario.The following section determines the fuel price and stagelength break even cost curves for the aircraft comparison pairsunder the two infrastructure charging schemes.C. Parametric Total Cost AnalysisTo begin the aircraft comparison, a relatively low marketdensity of 125 passengers per day for one way non-stopservice will be assumed. The zero percent difference contourcurves for a 125 passenger per day market density betweenaircraft pairs after the introduction of the two possibleinfrastructure charging schemes is shown in Fig. 7 and Fig. 8.Figure 8. Percent Difference Total Cost per Passenger Contour Curve forNarrow Body and Turboprop for a Market Density of 125 passengers.Again, the area under each curve represents the stage length– fuel price space where the turboprop has the lower cost perpassenger. Figure 7, the regional jet and turbopropcomparisons, shows that both infrastructure charging schemesincrease the fuel price – stage length space where the turbopropoffers a lower cost per passenger. When infrastructure costs arevariable, the turboprop gains an advantage due to similarlanding fees due to similar aircraft weights (Table 1). Wheninfrastructure costs are fixed, the turboprop has the largestregion where it exhibits the lowest cost. Due to the greatercapacity of the turboprop, costs can be spread among morepassengers and the importance of decreased schedule delay onthe regional jet is diminished.Figure 8 compares the narrow body and turboprop undervarying infrastructure charges. When the infrastructure costsare variable, there is a larger region where the turboprop offersa lower cost compared with the curve before infrastructurecosts are introduced. The turboprop has an advantage due to itslighter weight and smaller capacity. When infrastructure costsare fixed, there is a smaller region where the turboprop offers alower cost compared with the narrow body, compared to thecurve representing the cost comparison without infrastructure.Here the narrow body has the advantage, as there are morepassengers who can share the fixed costs.The next market density for comparison will be a relativelyhigh market density of 2000 passengers per day.Figure 7. Percent Difference Total Cost per Passenger Contour Curve forRegional Jet and Turboprop for a Market Density of 125 passengers.Figure 9. Percent Difference Total Cost per Passenger Contour Curve forRegional Jet and Turboprop for Varying Market Densities.
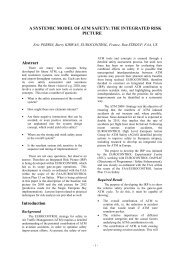
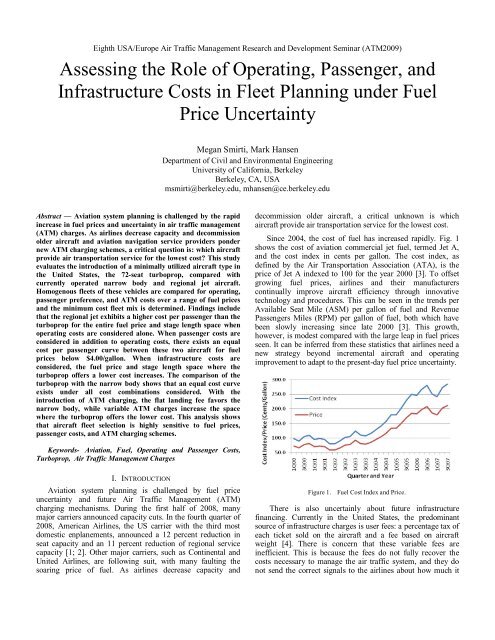
prices below $3.00-$4.00/gallon, airlines are encouraged toadopt less fuel efficient aircraft (regional jets) in order to keeppassenger costs low. Low fuel prices also incentivizemanufacturers to make aircraft that are less efficient but offersmaller recurring infrastructure charges and offer higher levelsof passenger service. This practice is beneficial for airline costsbut runs counter to other policy priorities such as reducing theenvironmental impact of aviation and fuel conservation.Results of this study indicate that high fuel prices rationalizethe adoption of fuel efficient aircraft, despite higher passengercosts; such a finding allows for the consideration of additionaltaxes, such as carbon taxes, to encourage airline low-emissionsfleet selection to consider environmental and fuel preservation.Figure 10. Percent Difference Total Cost per Passenger Contour Curve forNarrow Body and Turboprop for Varying Market Densities.As seen in §IV.D, high market densities diminish theimportance of schedule delay in the aircraft cost functions. Thecomparisons before infrastructure costs show that while theregional jet exhibited efficiencies at lower market densities, thebreak even curve terminated within a range of $0.80.Therefore, as exhibited in the comparison of Fig. 7 and Fig. 9,the higher density makes little difference for the regional jetand the turboprop.The higher density significantly decreases the region wherethe turboprop offers a lower cost when compared with thenarrow body (Fig. 10). The region where the turboprop offers alower cost per passenger compared with the narrow bodydecreases with increasing market density due to thediminishing importance of schedule delay. The curves areshifted toward the x-axis significantly, diminishing the regionwhere the turboprop offers the lower cost per passenger.VI.CONCLUSIONThis analysis shows that the determination of least-costaircraft stage lengths of 1000 miles or less is highly sensitive tofuel prices and passenger costs. It was shown that during a fuelprice spike such as that seen in the summer of 2008, regionaljets generally have a higher total cost per passenger thanturboprops, and narrow body jets have lower operating costsper passenger. In contrast, at fuel prices seen one year earlier,in the summer of 2007, there are many routes for which theregional jet has a lower cost per passenger. For certain stagelengths, it is only the recent jump in fuel prices that have madethe turboprop a more attractive option over regional jets.The findings of this study help further our understanding offuture infrastructure funding schemes. The FAA can <strong>use</strong> theseresults and perform other vehicle comparisons to understandhow airlines may respond to their infrastructure changes withfleet changes. In general, the FAA could expect that movestoward a fixed infrastructure charges would favor larger jets, aswell as a move toward turboprops. If infrastructure charges areleft as variable, the move toward larger jets may not occur,especially in the absence of a fuel price increase, beca<strong>use</strong>smaller jets would continue to have an advantage undervariable charging schemes.An interesting conclusion from this study is that low fuelprices send inefficient fleet selection signals to airlines. At fuelACKNOWLEDGMENTThe authors would like to thank the University of CaliforniaTransportation Center for funding support.REFERENCES[1] Schlangenstein, M. American Air, Eagle to End Flights to Eight Airports(Update3).http://www.bloomberg.com/apps/news?pid=20601087&sid=aTHuLkyRm.0E&refer=home. Accessed on July 20, 2008.[2] Bureau of Transportation Statistics (BTS). BTS Releases May AirlineTraffic Data; Low-fare Airline Tops Monthly Domestic PassengerRankings for First Time. 2003.http://www.bts.gov/press_releases/2003/bts017_03/html/bts017_03.html.Accessed July 20, 2008.[3] Air Transport Association (ATA) Quarterly Cost Index: U.S. PassengerAirlines. http://www.airlines.org/economics/finance/Cost+Index.htm.Accessed June 27, 2008.[4] Odoni, A. and de Neufville, R. Airport Systems: Planning, Design, andManagement. McGraw-Hill Professional, October 8, 2003.[5] Robyn, D. Air Support: Creating a Safer and More Reliable Air TrafficControl System, Hamilton Project Discussion <strong>Paper</strong>, July 2008.[6] Marchi, D. Airports: A Historic and Prospective View, Presented at theAllocation and Exchange of Airport Access Rights Workshop,Queenstown, MD, June 6-8, 2007.[7] Blakey, M. C. "Funding the Second Century of Aviation",Reauthorization Press Briefing, Washington, D.C., February 14, 2007.http://www.faa.gov/news/speeches/news_story.cfm?newsId=8183.Accessed on January 19, 2009.[8] Douglas, G. W. and J. C III. Miller. Economic regulation of DomesticAir Transport: Theory and Policy. The Brookings Institution, Chapter 6,pp. 83, Washington DC, 1975.[9] Oster Jr., C. O. and A. McKey. Cost Structure and Short-Haul AirService. In Deregulation and the New Airline Entrepreneurs. Eds.Meyer, J. R., Oster Jr., C. O., 1984.[10] Viton, P. Air Deregulation Revisited: Choice Of Aircraft Load Factors,and Marginal-Cost Fares for Domestic Air Travel. TransportationResearch Part A. Vol. 2A. No. 5. pp. 361-371. 1986.[11] Meyer M D and Miller E J. Urban Transportation Planning: A Decision-Oriented Approach. McGraw-Hill, 1984.[12] Wei W and Hansen M. Cost Economics of Aircraft Size. Journal ofTransport Economics and Policy, Volume 37, Part 2, May 2003, pp.279–296.[13] Wei W and Hansen M. Impact of aircraft size and seat availability onairlines’ demand and market share in duopoly markets. TransportationResearch Part E 41 (2005) 315–327[14] ATR. Products: ATR 72-500.http://www.atr.fr/public/atr/html/products/products.php?aid=506.Accessed July 1, 2008.[15] Boeing Company. Commercial Airplanes: 737 Family.