pfm sl 121.pdf - ATM Seminar
pfm sl 121.pdf - ATM Seminar
pfm sl 121.pdf - ATM Seminar
- No tags were found...

Create successful ePaper yourself
Turn your PDF publications into a flip-book with our unique Google optimized e-Paper software.
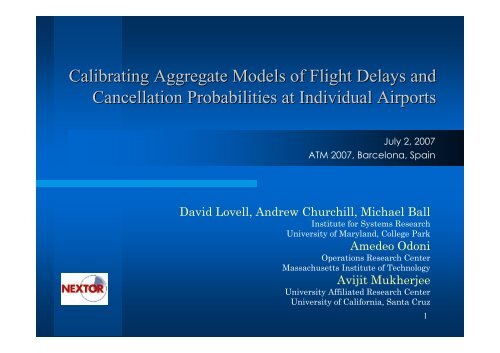
Calibrating Aggregate Models of Flight Delays andCancellation Probabilities at Individual AirportsJuly 2, 2007<strong>ATM</strong> 2007, Barcelona, SpainDavid Lovell, Andrew Churchill, Michael BallInstitute for Systems ResearchUniversity of Maryland, College ParkAmedeo OdoniOperations Research CenterMassachusetts Institute of TechnologyAvijit MukherjeeUniversity Affiliated Research CenterUniversity of California, Santa Cruz1
OutlineA. Cancellation model1. Model development2. Model calibrationB. Delay model1. Model development2. Data preparationa. Propagated delaysb. Schedule tran<strong>sl</strong>ationsc. Unscheduled trafficd. External delays3. Calibration resultsC. Conclusions2
Cancellation model calibration:Ground truth data requirements Carrier specificity required:– ASPM “Cancelled Flights”• Scheduled time of arrival (ARRSCHTM)• Scheduled date of arrival (ARRSCHDT)• Carrier (FAACARRIER)• Destination airport (ARR_LOCID) Aggregate:– ASPM “Quarter-Hour Airport Analysis”• CANCARR: number of flights in OAG scheduled toarrive during that quarter hour to a given airport thatwere cancelled for any reason4
Cancellation model calibration:A single model run - profile ATL airport September 15, 2004 All carriersResolution:– Observed: 15 min– Predicted: 60 minAreas undercancellation groupsmatch wellNotice early andlate observedcancellations thatwere not predicted(no correspondingcongestion)Number of cancellations654321PredictedObserved06 8 10 12 14 16 18 20 22Hour5
Cancellation model calibration:A single model run - scatterplot ORD airport September 15, 2004 All carriers Max delay = 2 hours Cancellation costs= {18,36,72} delayunits 5 cancellationsallowed at eachprice point R 2 = 0.678 Regressionequation:y = 1.53 + 0.998xObserved cancellation percentage353025201510500 5 10 15 20 25 30 35Predicted cancellation percentage6
Cancellation model calibration:Calibration controlsCapacity profile– AAR or other historic measure of airport capacity– Difficult to justify changing unless AAR is known to be erroneous– For model application, this must be forecast, perhaps conditionally, through theuse of capacity profilesMaximum delay– Contrived parameter in congestion-related proxy– Some reasonable limits can be imposed through knowledge of carrier operations– Can not be “optimized” directly because it is a constituent parameter of thenetwork topologyCancellation cost function– Increasing step function of unit costs for cancellation– Step prices and bin sizes are calibration parameters– Bin sizes are constraint bounds, so they could be turned into decision variablesand optimized– Step prices are objective function coefficients, so they can only be optimized if anonlinear model form is allowed7
Cancellation model calibration:Calibration issues Non-congestion-related causalmechanisms– e.g., mechanical problems, crew connections– Captured in reality in ambient stochasticcancellations– Might produce systematic difference betweenactual and predicted cancellations• Predictive models should do well with time profilesof cancellations• Calibration metrics should be related more to shapethan explicit values8
Cancellation model calibration:Carrier specificityExtrapolate from historical trends– Not good when studying new entrants or significant changesin carrier occupancy at an airportCancellations commensurate with scheduled demand– Does not capture any sense of carrier policy towardscancellationNon-unitary model of cancellation propensity as a functionof demand proportion– i.e., historically, when a carrier represents x% of the schedule,it tends to represent y% of the cancellations– Determine y as a function of xAll of these are ideas for apportioning cancellations amongcarriers after the aggregate numbers have been predicted9
Data preparation:Schedule tran<strong>sl</strong>ations12
Data preparation:Unscheduled traffic13
Data preparation:External delays14
Data preparation:External delays as an independent inputExplanatory VariableParameterEstimateStandardErrort-statisticp-valueInterceptPredicted averagedelay from DELAYSmodel-1.730.980.880.06-1.9516.250.050.00R 2 : 0.52Regional delay0.560.068.880.00 Regress adjusted actual delay against twoindependent variables:– Queuing delay– External congestion measure (average arrival delay offlights arriving at airports within 400 miles of subjectairport)15
Delay model calibration results3530PredictedObservedOffset predictedFeb. 2004, ATLArrival delay (minutes)25201510506 8 10 12 14 16 18 20 22Hour2004, ATLMonthOffsetJan2.9Feb5.9Mar2.5Apr2.6May6.4Jun10.2Jul5.6Aug3.8Sep7.3Oct1.6Nov5.0Dec7.0Metric187.9100.450.353.595.4546.8129.178.6220.8150.925.350.516
Conclusions Importance of aggregate models of delays andcancellations– Cannot be supported by proprietary data Niche for analytical models– Strategic insights– Fast execution for large numbers of scenarios Calibration relies heavily on noisy andconfounded empirical data that must be filteredand corrected Systematic differences between aggregate modeloutputs and real data will persist Partitioning results across carriers is tricky17