A SYSTEMIC MODEL OF ATM SAFETY: THE INTEGRATED RISK ...
A SYSTEMIC MODEL OF ATM SAFETY: THE INTEGRATED RISK ...
A SYSTEMIC MODEL OF ATM SAFETY: THE INTEGRATED RISK ...

Create successful ePaper yourself
Turn your PDF publications into a flip-book with our unique Google optimized e-Paper software.
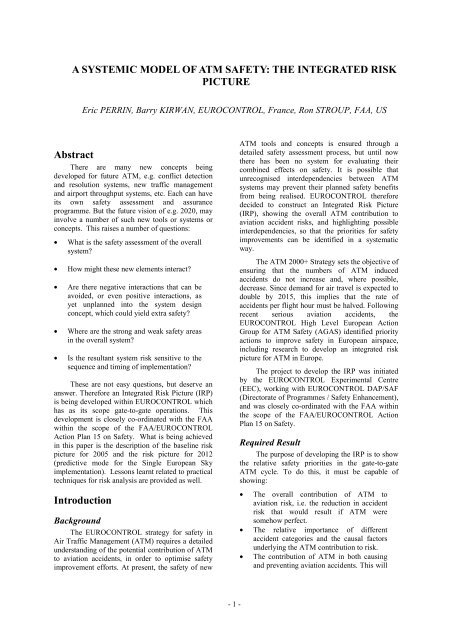
A <strong>SYSTEMIC</strong> <strong>MODEL</strong> <strong>OF</strong> <strong>ATM</strong> <strong>SAFETY</strong>: <strong>THE</strong> <strong>INTEGRATED</strong> <strong>RISK</strong>PICTUREEric PERRIN, Barry KIRWAN, EUROCONTROL, France, Ron STROUP, FAA, USAbstractThere are many new concepts beingdeveloped for future <strong>ATM</strong>, e.g. conflict detectionand resolution systems, new traffic managementand airport throughput systems, etc. Each can haveits own safety assessment and assuranceprogramme. But the future vision of e.g. 2020, mayinvolve a number of such new tools or systems orconcepts. This raises a number of questions:• What is the safety assessment of the overallsystem?• How might these new elements interact?• Are there negative interactions that can beavoided, or even positive interactions, asyet unplanned into the system designconcept, which could yield extra safety?• Where are the strong and weak safety areasin the overall system?• Is the resultant system risk sensitive to thesequence and timing of implementation?These are not easy questions, but deserve ananswer. Therefore an Integrated Risk Picture (IRP)is being developed within EUROCONTROL whichhas as its scope gate-to-gate operations. Thisdevelopment is closely co-ordinated with the FAAwithin the scope of the FAA/EUROCONTROLAction Plan 15 on Safety. What is being achievedin this paper is the description of the baseline riskpicture for 2005 and the risk picture for 2012(predictive mode for the Single European Skyimplementation). Lessons learnt related to practicaltechniques for risk analysis are provided as well.IntroductionBackgroundThe EUROCONTROL strategy for safety inAir Traffic Management (<strong>ATM</strong>) requires a detailedunderstanding of the potential contribution of <strong>ATM</strong>to aviation accidents, in order to optimise safetyimprovement efforts. At present, the safety of new<strong>ATM</strong> tools and concepts is ensured through adetailed safety assessment process, but until nowthere has been no system for evaluating theircombined effects on safety. It is possible thatunrecognised interdependencies between <strong>ATM</strong>systems may prevent their planned safety benefitsfrom being realised. EUROCONTROL thereforedecided to construct an Integrated Risk Picture(IRP), showing the overall <strong>ATM</strong> contribution toaviation accident risks, and highlighting possibleinterdependencies, so that the priorities for safetyimprovements can be identified in a systematicway.The <strong>ATM</strong> 2000+ Strategy sets the objective ofensuring that the numbers of <strong>ATM</strong> inducedaccidents do not increase and, where possible,decrease. Since demand for air travel is expected todouble by 2015, this implies that the rate ofaccidents per flight hour must be halved. Followingrecent serious aviation accidents, theEUROCONTROL High Level European ActionGroup for <strong>ATM</strong> Safety (AGAS) identified priorityactions to improve safety in European airspace,including research to develop an integrated riskpicture for <strong>ATM</strong> in Europe.The project to develop the IRP was initiatedby the EUROCONTROL Experimental Centre(EEC), working with EUROCONTROL DAP/SAF(Directorate of Programmes / Safety Enhancement),and was closely co-ordinated with the FAA withinthe scope of the FAA/EUROCONTROL ActionPlan 15 on Safety.Required ResultThe purpose of developing the IRP is to showthe relative safety priorities in the gate-to-gate<strong>ATM</strong> cycle. To do this, it must be capable ofshowing:• The overall contribution of <strong>ATM</strong> toaviation risk, i.e. the reduction in accidentrisk that would result if <strong>ATM</strong> weresomehow perfect.• The relative importance of differentaccident categories and the causal factorsunderlying the <strong>ATM</strong> contribution to risk.• The contribution of <strong>ATM</strong> in both causingand preventing aviation accidents. This will- 1 -
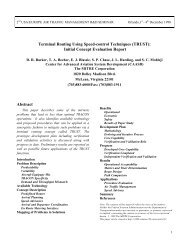
Quantification & sourcesQuantification of the fault tree for IRP 2005 beginsfrom the actual historical frequency of accidents, andproceeds gate by gate in a top-down sequence towards thebase events of the fault tree. Once the complete set of baseevents has been quantified, these genericfrequencies/probabilities may be adjusted to represent anyspecific case and effects propagated bottom-up through thetree to predict the risk picture for that case. Predicted casesmay be obtained for future <strong>ATM</strong> changes (e.g. 2012),retrospective validation (e.g. 1990), or for specific units(e.g. airports, airspaces or even individual flights).Historical experience has been used to supply three typesof data for the model:• Accident and precursor frequencies.• Causal breakdowns.• Maximum effects of influencesFor quantification of accident and precursor frequencies,suitable data sources were restricted to those for whichexposed populations were known.For each accident and incident, a text description of theknown causal factors has been obtained and used toidentify the reasons for failure of each of the barriers.These failures have been categorised according to the baseevents in the fault trees. Other influences that mightpotentially have prevented the barrier failures areconsidered separately in the influence model.The barrier failures and influences identified for eachaccident form the basis of the estimation of the potentialbenefits of improvements to these aspects of <strong>ATM</strong>, whichform part of the IRP results.In order to predict the <strong>ATM</strong> contribution to accident risk in2012, the IRP attempts to define all expected <strong>ATM</strong>changes, together with changes in traffic and the operatingenvironment, and estimate their effects through the riskmodel. The combined effects of all changes forms theprediction of overall risks and <strong>ATM</strong> contributions in 2012.Although IRP is able to make use of detailed safetyassessments of <strong>ATM</strong> changes, few of these are available atpresent, and hence the modelled effects are mainly basedon judgements.For further reading ([4]):The connection between theinfluence model and the base events ofthe fault tree is expressed as amodification factor (MF), which dependson a performance score (PS) for eachtask, on a scale from 0 to 100. Theperformance score is benchmarked asfollows:• PS = 70 represents ECAC average in2005, for which MF is 1 bydefinition.• PS = 100 represents “perfectperformance”, meaning that failureswould be reduced by the maximumeffect (ME) of the influenceidentified in the accident andincident data.A smooth logarithmic variation inMF is assumed for other values of PS(Figure 6).Modificationfactor(log scale)1MMFME70 100Performance score (linear scale)Figure 6: Conversion PS-MFF(Ei| I j )MF ij =F ( E )Giwhere:E i = base event in the faulttree, for i = 1 to NN = number of base events inthe fault treeF(E i ) = case-specific frequency ofevent E iF G (E i ) = generic frequency ofevent E iI j = influence, for j = 1 to QQ = number of influencesMF ij= 10⎡ PS j −70⎤⎢ log( 1−MEij) ⎥⎣ 30⎦4
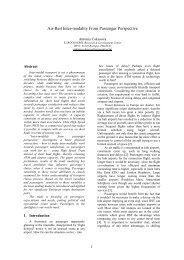
IRP Type of ResultsThe following accident categories aremodeled in detail in the IRP in order to quantify the<strong>ATM</strong> contributions to them:• Mid-air collision - two aircraft come intocontact with each other while both are inflight.• Runway collision - two aircraft come intocontact with each other on the airportrunway, including cases where one aircraftis on the ground and the other is in flightclose to the ground. At present, collisionswith obstacles, vehicles or people on therunway are not modelled.• Taxiway collision - two aircraft come intocontact with each other on the airportmanoeuvring area. This includes collisionswhere one aircraft is parked, being pushedback, under tow, or taxiing up to the pointof runway entry.• Controlled flight into terrain (CFIT) - anaircraft collides with terrain, water oranother obstacle while in flight withoutprior loss of control.• Wake turbulence accident - an aircraftsuffers major damage or serious injuries tooccupants due to an encounter with waketurbulence from another aircraft.For completeness, results are also provided forthe following accident categories based onhistorical statistics, although <strong>ATM</strong> is not expectedto make a major contribution to them: Loss ofcontrol in flight.• Loss of control in take-off.• Loss of control in landing.• Structural accident.• Fire/explosion.The measure of risk is the frequency of fataland non-fatal accidents. The frequency is theaverage number of accident involvements perflight. It is a frequency of involvement in anaccident, since collisions involving two commercialaircraft are counted as two involvements. Fatalaccidents are defined as accidents causing at leastone fatality among people on-board, on the groundor in other aircraft. In order to estimate thefrequencies of fatal accidents, the IRP alsoquantifies other measures of risk that may beprecursors to such events (Figure 7).Fatal accidentfrequenciesICAO-defined accidentfrequenciesPrecursorincidentfrequenciesSafetynetreliabilityRisks estimatedRisks not estimatedGroup risks of fatalitiesExternal risks (peoplenot on board aircraft)Individual risksFigure 7: Scope of Risk EstimatesThe risk results are averages across allcommercial air traffic within the ECAC region.This includes all scheduled and non-scheduledpassenger and cargo operations, but excludesmilitary and general aviation traffic (except wherethey are involved in an accident with commercialtraffic).The risk model is capable of predicting thefrequencies of fatal and non-fatal accidents andincidents, and different types of causal breakdownsfor any specified situation. These risks areaverages over all commercial (passenger and cargo)flights in the ECAC region.Accidents are usually the result of acombination of causal factors and influences. In therisk results, these are categorized into four groups:• Direct causes of the failure of the primarybarriers against accidents. The primarybarrier is considered to be tacticalseparation in the case of collision and waketurbulence, runway entry and take-offprocedures in the case of runway collision,ground movement procedures in the case oftaxiway collision, and trajectory commandsin the case of CFIT. Failures may be causedby ATC or pilots, typically involving actsof commission, or technical failures in ATCequipment or avionics.• Prevention failures, which are the causes offailure of the various barriers intended toprovide warnings that an accident may beimminent. These may be caused by ATC orpilots, typically involving acts of omissionor technical failures in safety nets.Communication problems, where ATC andpilots jointly contribute to failure of theprimary barrier, are also included in thisgroup.5
• Prevention opportunities, where extendedcoverage of safety equipment or enhancedperformance by ATC or pilots would havebeen able to prevent the accident, eventhough they would not be regarded as“failures” in an accident investigation.• Indirect influences, where performance ofone element of <strong>ATM</strong> leads to errors orfailures by another element (e.g. poorcontroller performance influencing piloterrors). These exclude direct influences thatare modelled in the categories above.Causal breakdowns are expressed as“contributions” to the fatal accident frequency. Thisis a simple estimate of the maximum fractionalreduction in accident frequency that would occur ifthe causal factor were eliminated and other factorsremained constant.[4]:• Presents the 2005 baseline risk picture,showing the current overall <strong>ATM</strong>contribution to accident risks forcommercial aircraft in Europe• Describes how the 2012 risk picture hasbeen developed through quantification ofthe effects of all <strong>ATM</strong> changes that areplanned to occur by then.Validation & UncertaintiesClassical validation of the IRP model, in thesense of an independent dataset that is shown toagree with the IRP results to within an acceptablelevel of accuracy, has been up to now impracticalfor this type of causal model. This is because: (1)Most available data has been used in constructingthe model; and (2) No other model seems to becurrently able to obtain comparable results.The IRP has been validated against historicalexperience since 1990. This date was chosenbecause it is the beginning of the period for whichaccident data has been analyzed in detail. Olderdata would show more significant differences inrisks, but the aircraft and the <strong>ATM</strong> practices wouldbe less consistent with the current risk model. . Itwould be desirable to obtain more thoroughvalidation. Possible approaches include:• Validation against accident and incidentexperience in the coming years.• Retrospective prediction of risks forspecific regions or units for which there isaccident or incident data suitable forvalidation of aspects of the risk model.• Dissemination of the techniques used in theIRP through peer-reviewed journals orother risk studies.• Evaluation of independent proposals forimproving accident safety. If these wereeither consistent with conclusions from theIRP or different for a clear reason, thiscould be considered a validation of it.• Expert review of the conclusions from theIRP. If the recommendations from the IRPwere supported by industry experts, thiscould also be considered a validation of theIRP.A comprehensive uncertainty analysis,obtaining confidence limits on all the IRP results,would be time-consuming to perform. It would alsobe complex to present, as each of the above resultswould be replaced by a probability distribution,although this could be summarized as a median andtwo representative confidence limits. In the presentwork, illustrative sensitivity tests have been carriedout and the following conclusions are based onthese.• The overall fatal accident frequencies arebased on an average of 13 accidents peraccident category, consisting of the relevantevents in the overall accident dataset. Ifoccurrences follow a Poisson distribution,the 90% confidence ranges for thefrequencies would be from approximately0.6x to 1.6x the estimated values. Similaruncertainties will apply to the ICAOaccident frequencies, since they have beenderived from the fatal frequencies, not fromindependent larger datasets.• The individual causal factors are each basedon an average of approximately 3 incidents,which are the relevant events in the overallaccident and incident dataset. Ifoccurrences follow a Poisson distribution,the 90% confidence ranges for thecontributions would be from approximately0.25x to 3x the estimated values. In futurework, it would be desirable to reduce theseuncertainties by analysing more accidentsand incidents.• The contributions for the <strong>ATM</strong> elements orfor <strong>ATM</strong> as a whole combine thecontributions from several causal factors.Provided the uncertainties in thecomponents are independent, this will tendto reduce the uncertainties in the summedvalues. As a rough indication, it is judged6
that the 90% confidence ranges for theoverall <strong>ATM</strong> contributions would be fromapproximately 0.5x to 2x the estimatedvalues. These uncertainties could beexplored further through sensitivity tests onselected key results.Use Cases sing StylesThe IRP may be used in many different ways,each requiring different types of results. Thefollowing use cases are being considered presently:Strategic direction for safety improvementsand safety research: For this, the baseline riskpicture indicates the priorities and key safety issues.Safety impacts of individual <strong>ATM</strong> changes:For the 2012 benchmark, the IRP has modeled thesafety impacts of all known <strong>ATM</strong> changes, and thedetailed results include a high level qualitativeidentification of their main safety benefits andhazards, as well as a model of their quantitativeeffects.Overall safety target compliance: Based oncurrent assumptions, the results for 2012 show thatin order to comply with the <strong>ATM</strong> 2000+ target ofno increase in the number of <strong>ATM</strong> inducedaccidents, it will be necessary to implement all theplanned <strong>ATM</strong> safety improvements by 2012.Comparison with the ESARR4 [5] target of 1.55 x10 -8 per flight hour for <strong>ATM</strong> contributions issensitive to the precise definitions used, but itwould be necessary to select additional safetyimprovements beyond 2012 to achieve compliance.Safety target apportionment: Once theoverall <strong>ATM</strong> risks for the future case meet theoverall target, the modeled performance of each<strong>ATM</strong> element can be used as its safety objective.Thus IRP provides a convenient way ofapportioning safety targets that takes account ofactual attainment and interactions with expectedfuture developments.Risk picture for specific units: The IRP hasthe capability to make predictions of risks for aspecific unit (airport, airspace or individual flight).However, this capability requires validation.Consistency of safety cases: The IRP faulttree model can be recast as a standard event tree fordifferent types of failures, which can help achieveconsistency in the modeling for safety assessmentsof individual projects.Safety roadmap: The IRP can be used tomake risk predictions for individual <strong>ATM</strong> changesand groups of <strong>ATM</strong> changes, combined withdifferent implementation dates or growths in safetynet usage. This allows definition of a sequence of<strong>ATM</strong> changes to ensure that risks are decreased assoon as possible.Alignment of severity classifications: TheIRP includes a set of incidents of differentseverities, which are precursors of each accidentcategory. These can be used to derive quantitativetargets consistent with the ESARR4 severityclassification.Safety performance monitoring: Theprecursor incidents are also suitable for monitoringof trends in actual safety performance, as well asnew data gathering to validate and improve the IRP.Conclusions and further workThis type of risk modeling is challenging andnot yet fully mature. At present, the results aresensitive to interpretations. For instance, IRP 2005presents point estimates of the contributions of<strong>ATM</strong> elements to aviation risks. Some of these arebased closely on large, well-established datasets,whereas others are based on uncertain judgments. Itwould be desirable if the source of the data(pedigree) could be made plain, along with thecollected results of sensitivity analyses, and ifpossible the degree of uncertainty in the resultscould be estimated. It will not be possible to showthis information succinctly for all results, but itwould be possible to develop a format that showedall necessary information for selected results.However, it is believed that the IRP is suitable forthe wide range of intended uses andrecommendation of safety improvements.Progressive improvement would still be desirablethrough analysis of further data, incorporation ofexpert judgments, alternative validation exercises,improvements in user-required capabilities, andimproved consistency with safety targets.Over 2007-2008, the major development willconsist in developing the IRP into a tool that canshow how risks will be affected as the OperationalImprovements (OIs) are implemented and trafficgrows. IRP 2005/2012 predicts the current andfuture risk, but is not optimized to show thechanges in risk between these points and explorealternative implementation strategies to minimizerisks. The so-called Safety Roadmap will addressthe definition of the sequence of changes betweenthe present and the planned future <strong>ATM</strong> system, sothat the safety target is met at all stages, and inparticular that risks are decreased where possible.It will enable to appraise whether the predictedsafety improvements throughout the period are notoutweighed by the extra traffic. Ultimately, theRoadmap will include safety monitoring targets, sothat as OIs are introduced, it can be determined ifexpected safety impacts are realized, exceeded, or7
fall short. This will lead to a true risk managementsystem based on operational feedback.The elements that you will need for yourpaper have been formatted for you through the useof the “styles” capability of the software. Stylesare selected from the box on the far left of the toolbar. Note: if you position your cursor anywhere inthis paragraph, the “styles” box will say “BodyText;” we’ve also noted different styles inparentheses following some of the elements on thispage of these instructions (Title, Author, Heading 1,Heading 2, etc).To use styles, you can either select the styleyou wish to apply and start typing, or select the textyou wish to apply a style to; then, using the mouse,point to the style box on the toolbar. Click once onthe downward pointing arrow to the right, andselect the appropriate style.References[1]. ICAO Document 9854, Global Air TrafficManagement Operational Concept, 1stEdition, 2005[2]. EUROCONTROL, Safety Assessment -Success and Failure Approaches, draft, 2006http://www.a2di.com/SAM_Newsletter/08/HTML/doc/Success&failure.doc[3]. EUROCONTROL, Safety ScreeningTechnique for the Future Air TrafficManagement Safety Strategy”, 2005[4]. EUROCONTROL, Main Report for the2005/2012 Integrated Risk Picture for AirTraffic Management in Europe, 2006http://www.eurocontrol.int/eec/public/related_links/safety_documents.html[5]. EUROCONTROL, Risk Assessment andMitigation in <strong>ATM</strong>, ESARR4, 05-04-2001,Edition: 1.0http://www.eurocontrol.int/src/public/standard_page/src_deliverables.htmlDr Barry Kirwan joined EUROCONTROL in2002, and was formerly Head of Human Factors forNational Air Traffic Services (NATS) in the UK,and prior to that was Head of Human Reliability inBritish Nuclear Fuels. He holds degrees inPsychology, Ergonomics and Human ReliabilityAssessment, and lectured for five years in theseareas at the University of Birmingham in the UK.He has worked in the area of Human Factors andSafety for twenty-five years in nuclear power,offshore oil and gas, chemical, and air trafficmanagement sectors of industry. He currently leadsa small team of safety and Human Factors people inEUROCONTROL’s R&D Centre, South of Paris,working on a range of short and medium termissues such as safety assessment, safety culture, andsafety nets.Mr. Ronald Stroup joined the FederalAviation Administration as an Aerospace Engineerin 1989. He holds a Bachelor of Science degree inAvionics Engineering from Parks College of SaintLouis University (1989) and a Masters inInformation Management from Syracuse University(2006). Mr. Stroup served, as a Systems Engineerin the Aircraft Certification Services' ChicagoAircraft Certification Office and in 1997 becamethe Software Technology Specialist for the AircraftCertification Service. In 1998, Mr. Stroup servedas the Software Safety and Certification Lead forthe Office of Information Services and ChiefInformation Officer. In 2002, Mr. Stroupcompleted the DOD’s Advanced ManagementProgram and holds a NSTISSI 4011 Certificate inInformation System Security. In March 2003, Mr.Stroup became the Chief System Engineer forAirborne and Ground System Integration for theFAA Air Traffic Organization.The views expressed herein are authors’ ownand do not necessarily reflect EUROCONTROLpolicy.BiographyMr. Eric Perrin joined EUROCONTROL in2002 as GPS Ground-Based Augmentation System(GBAS) Manager. He holds an Engineer degree inAeronautics and Computer Science from the FrenchCivil Aviation School (ENAC) (1993). Eric Perrinhas twelve years’ experience in aviation, six ofwhich have been spent on safety assessment andmanagement. Currently he is Deputy SafetyResearch Team Manager and Safety ManagementSystem (SMS) Manager at the EUROCONTROLExperimental Centre.8