A SYSTEMIC MODEL OF ATM SAFETY: THE INTEGRATED RISK ...
A SYSTEMIC MODEL OF ATM SAFETY: THE INTEGRATED RISK ...
A SYSTEMIC MODEL OF ATM SAFETY: THE INTEGRATED RISK ...

Create successful ePaper yourself
Turn your PDF publications into a flip-book with our unique Google optimized e-Paper software.
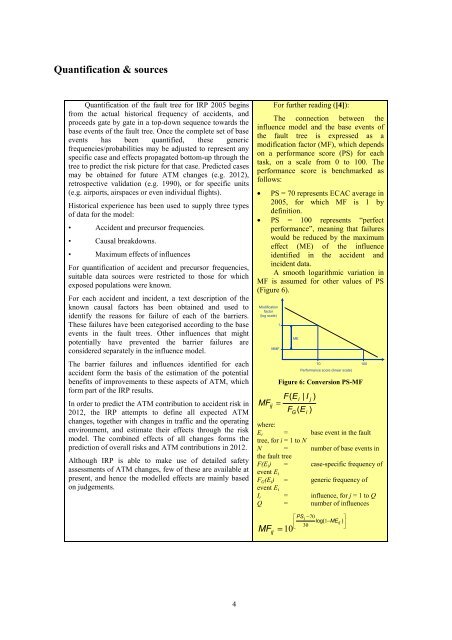
Quantification & sourcesQuantification of the fault tree for IRP 2005 beginsfrom the actual historical frequency of accidents, andproceeds gate by gate in a top-down sequence towards thebase events of the fault tree. Once the complete set of baseevents has been quantified, these genericfrequencies/probabilities may be adjusted to represent anyspecific case and effects propagated bottom-up through thetree to predict the risk picture for that case. Predicted casesmay be obtained for future <strong>ATM</strong> changes (e.g. 2012),retrospective validation (e.g. 1990), or for specific units(e.g. airports, airspaces or even individual flights).Historical experience has been used to supply three typesof data for the model:• Accident and precursor frequencies.• Causal breakdowns.• Maximum effects of influencesFor quantification of accident and precursor frequencies,suitable data sources were restricted to those for whichexposed populations were known.For each accident and incident, a text description of theknown causal factors has been obtained and used toidentify the reasons for failure of each of the barriers.These failures have been categorised according to the baseevents in the fault trees. Other influences that mightpotentially have prevented the barrier failures areconsidered separately in the influence model.The barrier failures and influences identified for eachaccident form the basis of the estimation of the potentialbenefits of improvements to these aspects of <strong>ATM</strong>, whichform part of the IRP results.In order to predict the <strong>ATM</strong> contribution to accident risk in2012, the IRP attempts to define all expected <strong>ATM</strong>changes, together with changes in traffic and the operatingenvironment, and estimate their effects through the riskmodel. The combined effects of all changes forms theprediction of overall risks and <strong>ATM</strong> contributions in 2012.Although IRP is able to make use of detailed safetyassessments of <strong>ATM</strong> changes, few of these are available atpresent, and hence the modelled effects are mainly basedon judgements.For further reading ([4]):The connection between theinfluence model and the base events ofthe fault tree is expressed as amodification factor (MF), which dependson a performance score (PS) for eachtask, on a scale from 0 to 100. Theperformance score is benchmarked asfollows:• PS = 70 represents ECAC average in2005, for which MF is 1 bydefinition.• PS = 100 represents “perfectperformance”, meaning that failureswould be reduced by the maximumeffect (ME) of the influenceidentified in the accident andincident data.A smooth logarithmic variation inMF is assumed for other values of PS(Figure 6).Modificationfactor(log scale)1MMFME70 100Performance score (linear scale)Figure 6: Conversion PS-MFF(Ei| I j )MF ij =F ( E )Giwhere:E i = base event in the faulttree, for i = 1 to NN = number of base events inthe fault treeF(E i ) = case-specific frequency ofevent E iF G (E i ) = generic frequency ofevent E iI j = influence, for j = 1 to QQ = number of influencesMF ij= 10⎡ PS j −70⎤⎢ log( 1−MEij) ⎥⎣ 30⎦4