Leakage Prevention Guidebook - Bureau of Waterworks Tokyo ...
Leakage Prevention Guidebook - Bureau of Waterworks Tokyo ...
Leakage Prevention Guidebook - Bureau of Waterworks Tokyo ...

Create successful ePaper yourself
Turn your PDF publications into a flip-book with our unique Google optimized e-Paper software.
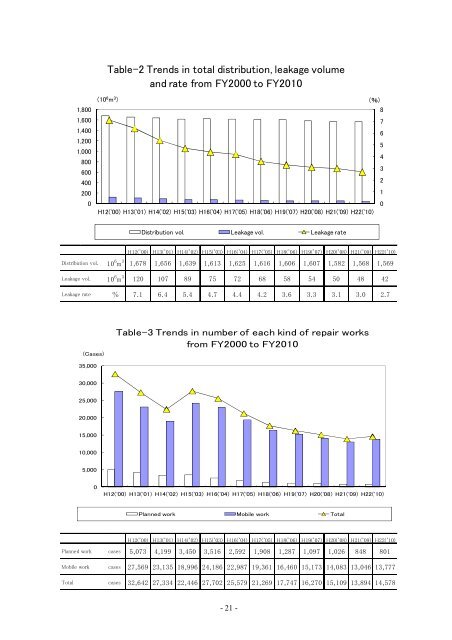
Table-2 Trends in total distribution, leakage volumeand rate from FY2000 to FY20101,8001,6001,4001,2001,0008006004002000(10 6 m 3 ) (%)876543210H12('00) H13('01) H14('02) H15('03) H16('04) H17('05) H18('06) H19('07) H20('08) H21('09) H22('10)Distribution vol. <strong>Leakage</strong> vol. <strong>Leakage</strong> rateDistribution vol.<strong>Leakage</strong> vol.<strong>Leakage</strong> rateH12('00) H13('01) H14('02) H15('03) H16('04) H17('05) H18('06) H19('07) H20('08) H21('09) H22('10)10 6 m 3 1,678 1,656 1,639 1,613 1,625 1,616 1,606 1,607 1,582 1,568 1,56910 6 m 3 120 107 89 75 72 68 58 54 50 48 42% 7.1 6.4 5.4 4.7 4.4 4.2 3.6 3.3 3.1 3.0 2.7(Cases)Table-3 Trends in number <strong>of</strong> each kind <strong>of</strong> repair worksfrom FY2000 to FY201035,00030,00025,00020,00015,00010,0005,0000H12('00) H13('01) H14('02) H15('03) H16('04) H17('05) H18('06) H19('07) H20('08) H21('09) H22('10)Planned work Mobile work TotalPlanned workMobile workTotalH12('00) H13('01) H14('02) H15('03) H16('04) H17('05) H18('06) H19('07) H20('08) H21('09) H22('10)cases 5,073 4,199 3,450 3,516 2,592 1,908 1,287 1,097 1,026 848 801cases 27,569 23,135 18,996 24,186 22,987 19,361 16,460 15,173 14,083 13,046 13,777cases 32,642 27,334 22,446 27,702 25,579 21,269 17,747 16,270 15,109 13,894 14,578- 21 -