Reactions to the Pace of Change
Reactions to the Pace of Change
Reactions to the Pace of Change

You also want an ePaper? Increase the reach of your titles
YUMPU automatically turns print PDFs into web optimized ePapers that Google loves.
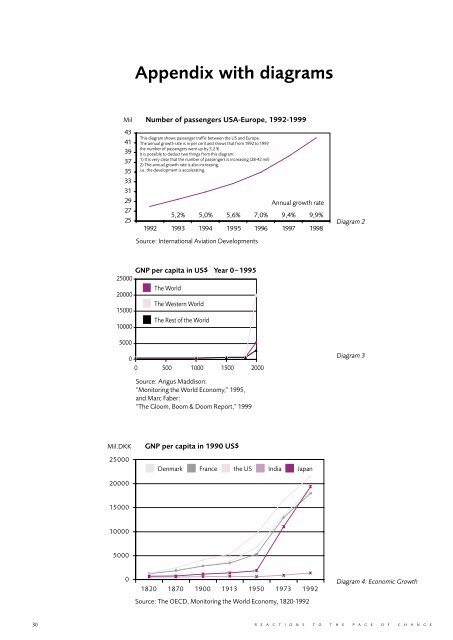
Appendix with diagramsMil43413937353331292725Number <strong>of</strong> passengers USA-Europe, 1992-1999This diagram shows passenger traffic between <strong>the</strong> US and Europe. The annual growth rate is in per cent and shows that from 1992 <strong>to</strong> 1993 <strong>the</strong> number <strong>of</strong> passengers went up by 5,2 %.It is possible <strong>to</strong> deduct two things from this diagram:1) It is very clear that <strong>the</strong> number <strong>of</strong> passengers is increasing (28-42 mil)2) The annual growth rate is also increasing, i.e. <strong>the</strong> development is accelerating.Source: International Aviation DevelopmentsAnnual growth rate5,2% 5,0% 5,6% 7,0% 9,4% 9,9%1992 1993 1994 1995 1996 1997 1998Diagram 2GNP per capita in US$ Year 0 – 199525000The World20000The Western World15000The Rest <strong>of</strong> <strong>the</strong> World10000500000 500 1000 1500 2000Diagram 3Source: Angus Maddison: “Moni<strong>to</strong>ring <strong>the</strong> World Economy,” 1995, and Marc Faber: “The Gloom, Boom & Doom Report,” 1999Mil.DKK25000GNP per capita in 1990 US$Denmark France <strong>the</strong> US India Japan200001500010000500001820 1870 1900 1913 1950 1973 1992Source: The OECD, Moni<strong>to</strong>ring <strong>the</strong> World Economy, 1820-1992Diagram 4: Economic Growth30 R E A C T I O N S T O T H E P A C E O F C H A N G E