36 <strong>Aker</strong> <strong>Solutions</strong> annual <strong>report</strong> <strong>2010</strong><strong>Annual</strong> accounts – groupThe Resource Group TRG ASOn the 24 November <strong>Aker</strong> <strong>Solutions</strong> AS sold its 50 percent shareholding in <strong>Aker</strong> Encore AS to TheResource Group TRG AS for a total cash consideration of NOK 17 million.Industrial transactions in 2009On 1 April 2009, <strong>Aker</strong> <strong>Solutions</strong> acquired several shareholdings from companies in the <strong>Aker</strong> group inorder to further strengthen its position in the offshore and energy sectors. The acquisitions establishbroader foundation for continued industrial development at the interface between energy, the environmentand maritime activities in industries with solid long-term growth potential. The transactions carriedout resulted in <strong>Aker</strong> <strong>Solutions</strong> AS acquiring or increasing its ownership interest in the following businesses:<strong>Aker</strong> Oilfield Services AS<strong>Aker</strong> <strong>Solutions</strong> increased the ownership in <strong>Aker</strong> Oilfield Services from 32.3 to 100 percent. 46 percent ofthe shares were acquired from <strong>Aker</strong> Capital AS for a consideration of NOK 595 million.Midsund Bruk AS<strong>Aker</strong> <strong>Solutions</strong> acquired 100 percent of the shares in Midsund Bruk from <strong>Aker</strong> Capital AS for a the totalconsideration of NOK 88 million.<strong>Aker</strong> DOF Deepwater AS<strong>Aker</strong> <strong>Solutions</strong> acquired 50 percent of the shares in <strong>Aker</strong> DOF Deepwater from <strong>Aker</strong> Capital AS for NOK190 million. The remaining 50 percent is owned by DOF. The investment is accounted for as a jointlycontrolled entity.ODIM ASA<strong>Aker</strong> <strong>Solutions</strong> acquired 33 percent of the shares in ODIM from <strong>Aker</strong> ASA (10.8 percent) and <strong>Aker</strong> InvestII KS (22.2 percent). The total consideration amounted to NOK 513 million. The shares were subsequentlysold in June 2009.<strong>Aker</strong> Clean Carbon AS<strong>Aker</strong> <strong>Solutions</strong>’ shareholding in <strong>Aker</strong> Clean Carbon was increased from 30 to 50 percent through anequity issue of NOK 43 million. The investment is accounted for as a jointly controlled entity.Note 9Operating segments<strong>Aker</strong> <strong>Solutions</strong> has in <strong>2010</strong> had four <strong>report</strong>able segments which are the strategic business units of thegroup. The strategic business units offer different products and services, and are managed separatelybecause they operate in different market segments and have different strategies for their projects, productsand services. The group’s CEO reviews each of the operating segments with the segment managementon a monthly basis. The review is based on monthly <strong>report</strong>ing from the subsidiaries in the operatingsegments.The following summary describes the operations in each of <strong>Aker</strong> <strong>Solutions</strong>’ <strong>report</strong>able segments:Energy Development & ServicesEnergy Development & Services (ED&S) develops new oil and gas production facilities offshore and onland, as well as life cycle services for the operational phase of such installations. The business areadelivers the full value chain from studies, front-end design and detailed engineering, through procurement,project management, fabrication and hook-up, to installation, maintenance and modifications.SubseaSubsea is a global provider across the value chain of subsea and sub-surface technologies, solutionsand services. Subsea offerings cover all phases of the life of fields, from concept screening and designthrough manufacturing, installation and commissioning to operational support and maintenance services.Subsea’s ability as a provider of subsea production systems is backed by an extensive portfolioof additional capabilities such as well services, marine operations and geological services.Products & TechnologiesProducts & Technologies (P&T) is a leading global provider of specialised products and services to theupstream oil and gas industry, based on proprietary technology and know-how. Key deliverablesinclude advanced drilling equipment, systems and risers, upstream processing technology and mooringsystems, as well as loading and offloading technology.Process & ConstructionProcess & Construction (P&C) is a global provider of onshore engineering and construction services tothe natural resources and energy markets. P&C supplies niche process expertise with high-technologycontent and know-how for projects across chemicals, polymers, syngas and refining, mining and metals,onshore liquefied natural gas (LNG) receiving terminals, power generation, biofuels, carbon capture,acid plants, nuclear plants, and water treatment.In December <strong>2010</strong>, <strong>Aker</strong> <strong>Solutions</strong> entered into a share purchase agreement whereby it has agreed totransfer principal operations within its Process and Construction business area to Jacobs EngineeringGroup Inc. The transfer does not include the US EPC centre in Houston, nor the Union Constructionbusinesses located in the US and Canada. As of 31 December <strong>2010</strong>, businesses to be sold are classifiedas disposal group held for sale and discontinued operations, see note 7 Disposal groups and discontinuedoperations.Following the sale of P&C businesses and restructuring of the oil and gas business, a new <strong>report</strong>ingstructure will be implemented with effect from March 2011. Reporting of operating segments in <strong>2010</strong>follows the <strong>2010</strong> business area structure because the financial information has not yet been organisedto reflect the new structure and is currenctly not being reviewed by the chief operating decisionmaker.Measurement of segment performancePerformance is measured by segment operating profit before depreciation, amortisation and impairment(EBITDA) and operating profit (EBIT), as included in the internal management <strong>report</strong>s that arereviewed by the group’s CEO. Segment profit, together with key financial information as describedbelow, gives the CEO relevant information in evaluating the results of the operating segments and isrelevant in evaluating the results of the segments relative to other entities operating within these industries.Inter-segment pricing is determined on an arm’s length basis.There are varying levels of integration between ED&S, Subsea and P&T, which all deliver products andservices to customers within the oil and gas industry globally and where the group’s expertise andproducts can be exploited in interaction with each other. P&C has also used the group’s processes andexpertise when delivering their products and services to the process, metal and energy-sectors. Theaccounting policies of the <strong>report</strong>able segments are the same as described in note 2 Basis of preparationand note 3 Accounting principles, except for hedge accounting. When contract revenues and contractcosts are denominated in a foreign currency, the subsidiary hedges the exposure against CorporateTreasury and hedge accounting is applied independently of whether the hedge qualify for hedgeaccounting in accordance with IFRS. The correction of the non-qualifying hedges to secure that theconsolidated financial statement is in accordance with IFRS is made as an adjustment at corporatelevel. This means that the group’s segment <strong>report</strong>ing reflect all hedges as qualifying even though theymay not qualify in accordance with IFRS.
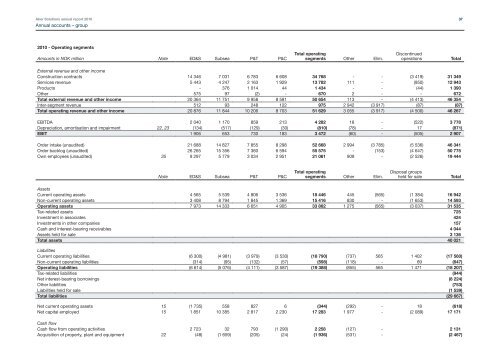
<strong>Aker</strong> <strong>Solutions</strong> annual <strong>report</strong> <strong>2010</strong><strong>Annual</strong> accounts – group37<strong>2010</strong> - Operating segmentsAmounts in NOK million Note ED&S Subsea P&T P&CTotal operatingsegments Other Elim.DiscontinuedoperationsTotalExternal revenue and other incomeConstruction contracts 14 346 7 031 6 783 6 608 34 768 - - (3 419) 31 349Services revenue 5 443 4 247 2 163 1 929 13 782 111 - (950) 12 943Products - 376 1 014 44 1 434 - - (44) 1 390Other 575 97 (2) - 670 2 - - 672Total external revenue and other income 20 364 11 751 9 958 8 581 50 654 113 - (4 413) 46 354Inter-segment revenue 512 93 248 122 975 2 942 (3 917) (87) (87)Total operating revenue and other income 20 876 11 844 10 206 8 703 51 629 3 055 (3 917) (4 500) 46 267EBITDA 2 040 1 170 859 213 4 282 18 - (522) 3 778Depreciation, amortisation and impairment 22, 23 (134) (517) (129) (30) (810) (78) - 17 (871)EBIT 1 906 653 730 183 3 472 (60) - (505) 2 907Order intake (unaudited) 21 688 14 827 7 855 8 298 52 668 2 994 (3 785) (5 536) 46 341Order backlog (unaudited) 26 265 15 356 7 360 6 594 55 575 - (153) (4 647) 50 775Own employees (unaudited) 35 9 297 5 779 3 034 2 951 21 061 909 - (2 526) 19 444Note ED&S Subsea P&T P&CTotal operatingsegments Other Elim.Disposal groupsheld for saleTotalAssetsCurrent operating assets 4 565 5 539 4 806 3 536 18 446 445 (565) (1 384) 16 942Non-current operating assets 3 408 8 794 1 845 1 369 15 416 830 - (1 653) 14 593Operating assets 7 973 14 333 6 651 4 905 33 862 1 275 (565) (3 037) 31 535Tax-related assets 725Investment in associates 424Investments in other companies 157Cash and interest-bearing receivables 4 044Assets held for sale 3 136Total assets 40 021LiabilitiesCurrent operating liabilities (6 300) (4 981) (3 979) (3 530) (18 790) (737) 565 1 402 (17 560)Non-current operating liabilities (314) (95) (132) (57) (598) (118) - 69 (647)Operating liabilities (6 614) (5 076) (4 111) (3 587) (19 388) (855) 565 1 471 (18 207)Tax-related liabilities (944)Net interest-bearing borrowings (8 224)Other liabilities (753)Liabilities held for sale (1 539)Total liabilities (29 667)Net current operating assets 15 (1 735) 558 827 6 (344) (292) - 18 (618)Net capital employed 15 1 851 10 385 2 817 2 230 17 283 1 977 - (2 089) 17 171Cash flowCash flow from operating activities 2 723 32 793 (1 290) 2 258 (127) - 2 131Acquisition of property, plant and equipment 22 (48) (1 659) (205) (24) (1 936) (531) - (2 467)