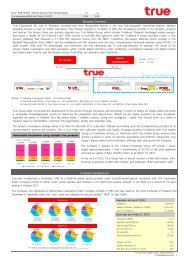
%FY08 %FY09 %FY10 %FY11 %YoYService revenue -4.4% +3.4% -1.2% +17.0% +13.3%EBITDA -24.8% +27.0% -13.7% -20.2% -20.7%<strong>True</strong>Move H drives <strong>True</strong> Mobile <strong>Group</strong> revenueService revenue & market share15.7% 14.4% 15.0% 14.1% 14.8%14.9% 15.2%Bt mn46NIOGOBt mn23,835 22,796 23,575 23,284 27,2493,223 13,345 15,123(777) (624) (1,314)1,4263,919(2,883) (1,411)(2,258)(3,244)(4,811)23,835 22,796 23,575 23,284 24,36811,956 11,891(1,605)(2,386)(2,926)(3,059)23(6,173)2007 2008 2009 2010 2011 1H11 1H122007 2008 2009 2010 2011 1H11 1H12<strong>True</strong>Move* 3G, CDMA & others* NIOGO excl. deferred income tax NIOGO% <strong>True</strong>Mobile revenue market share*Before intersegment elimination between <strong>True</strong>Move and 3G, CDMA & others30.6% 24.3% 27.7% 24.0% 15.1%Bt mnEBITDA & EBITDA margin7,5666,4635,691 7,226 6,2333,2944,974 3,1332,4102,484-1,481 (156) (191)Net IC +165 (845) (32) +181 (98) +96 (420)2007 2008 2009 2010 2011<strong>True</strong>Mobile EBITDA19.4% 11.8%1H11EBITDA margin1H12<strong>True</strong>Move<strong>True</strong>Mobile<strong>Group</strong>3G, CDMA &othersBt mn5,0704,2324,111 3,8802,6372,762Free cash flow3,4293,6676,5162922007 2008 2009 2010 2011Cash flow from operationsCapex3,2521,5661H116,1982681H12
Mobile Internet continues to drive non-voice growth<strong>True</strong> Mobile’s non-voice revenue25.7%10.4% 11.8% 13.3% 15.2% 19.5% 17.0%5,314Bt mn3,8863,5341,5687143,1342,490 2,6792,2711,5111,616 2,7471,367 1,512770 2,655336 362 569 1,123999787 805 949 900 999502 5162007 2008 2009 2010 20111H11 1H12Messaging (SMS/MMS) Mobile Internet Content & RBT% of service revenue excl. IC and network rental24• Accelerated non-voice growth due to rising mobile Internet usage driven by ongoingexpansion of 3G+ service coverage and promotion packages for smartphone and tabletdevices%FY08 %FY09 %FY10 %FY11 %YoYNon-voice revenue +7.6% +17.0% +12.8% +50.4% +71.1%