2006 Annual Report - Timberlane Regional School District
2006 Annual Report - Timberlane Regional School District
2006 Annual Report - Timberlane Regional School District
- No tags were found...

Create successful ePaper yourself
Turn your PDF publications into a flip-book with our unique Google optimized e-Paper software.
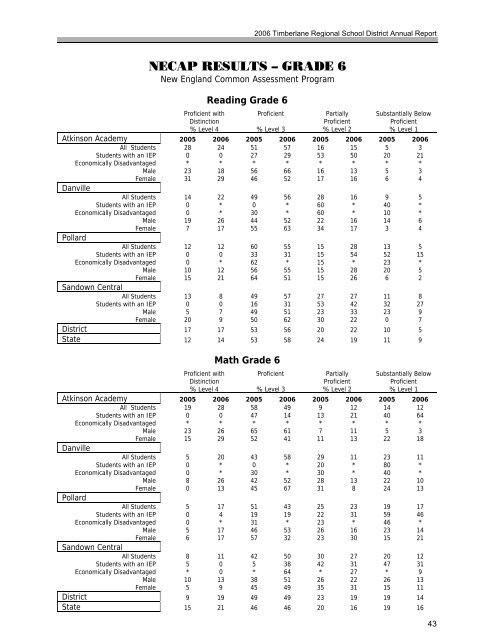
<strong>2006</strong> <strong>Timberlane</strong> <strong>Regional</strong> <strong>School</strong> <strong>District</strong> <strong>Annual</strong> <strong>Report</strong>NECAP RESULTS – GRADE 6New England Common Assessment ProgramReading Grade 6Proficient with Proficient Partially Substantially BelowDistinction Proficient Proficient% Level 4 % Level 3 % Level 2 % Level 1Atkinson Academy 2005 <strong>2006</strong> 2005 <strong>2006</strong> 2005 <strong>2006</strong> 2005 <strong>2006</strong>All Students 28 24 51 57 16 15 5 3Students with an IEP 0 0 27 29 53 50 20 21Economically Disadvantaged * * * * * * * *Male 23 18 56 66 16 13 5 3Female 31 29 46 52 17 16 6 4DanvilleAll Students 14 22 49 56 28 16 9 5Students with an IEP 0 * 0 * 60 * 40 *Economically Disadvantaged 0 * 30 * 60 * 10 *Male 19 26 44 52 22 16 14 6Female 7 17 55 63 34 17 3 4PollardAll Students 12 12 60 55 15 28 13 5Students with an IEP 0 0 33 31 15 54 52 15Economically Disadvantaged 0 * 62 * 15 * 23 *Male 10 12 56 55 15 28 20 5Female 15 21 64 51 15 26 6 2Sandown CentralAll Students 13 8 49 57 27 27 11 8Students with an IEP 0 0 16 31 53 42 32 27Male 5 7 49 51 23 33 23 9Female 20 9 50 62 30 22 0 7<strong>District</strong> 17 17 53 56 20 22 10 5State 12 14 53 58 24 19 11 9Math Grade 6Proficient with Proficient Partially Substantially BelowDistinction Proficient Proficient% Level 4 % Level 3 % Level 2 % Level 1Atkinson Academy 2005 <strong>2006</strong> 2005 <strong>2006</strong> 2005 <strong>2006</strong> 2005 <strong>2006</strong>All Students 19 28 58 49 9 12 14 12Students with an IEP 0 0 47 14 13 21 40 64Economically Disadvantaged * * * * * * * *Male 23 26 65 61 7 11 5 3Female 15 29 52 41 11 13 22 18DanvilleAll Students 5 20 43 58 29 11 23 11Students with an IEP 0 * 0 * 20 * 80 *Economically Disadvantaged 0 * 30 * 30 * 40 *Male 8 26 42 52 28 13 22 10Female 0 13 45 67 31 8 24 13PollardAll Students 5 17 51 43 25 23 19 17Students with an IEP 0 4 19 19 22 31 59 46Economically Disadvantaged 0 * 31 * 23 * 46 *Male 5 17 46 53 26 16 23 14Female 6 17 57 32 23 30 15 21Sandown CentralAll Students 8 11 42 50 30 27 20 12Students with an IEP 5 0 5 38 42 31 47 31Economically Disadvantaged * 0 * 64 * 27 * 9Male 10 13 38 51 26 22 26 13Female 5 9 45 49 35 31 15 11<strong>District</strong> 9 19 49 49 23 19 19 14State 15 21 46 46 20 16 19 1643