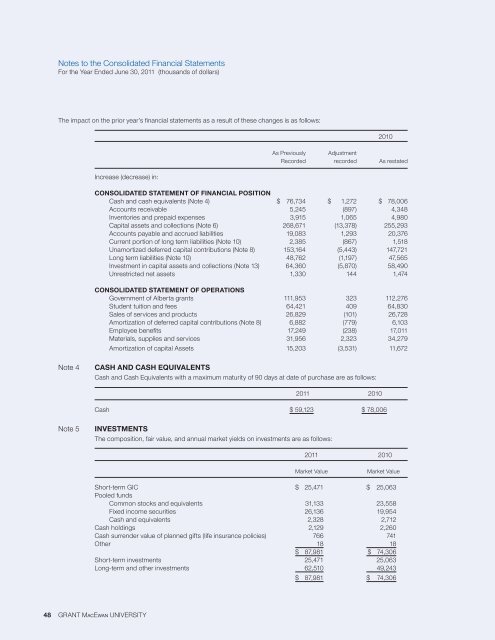
Notes to the Consolidated Financial StatementsFor the Year Ended June 30, 20<strong>11</strong> (thousands of dollars)The impact on the prior year’s financial statements as a result of these changes is as follows:<strong>2010</strong>As Previously AdjustmentRecorded recorded As restatedIncrease (decrease) in:Consolidated Statement of Financial PositionCash and cash equivalents (Note 4) $ 76,734 $ 1,272 $ 78,006Accounts receivable 5,245 (897) 4,348Inventories and prepaid expenses 3,915 1,065 4,980Capital assets and collections (Note 6) 268,671 (13,378) 255,293Accounts payable and accrued liabilities 19,083 1,293 20,376Current portion of long term liabilities (Note 10) 2,385 (867) 1,518Unamortized deferred capital contributions (Note 8) 153,164 (5,443) 147,721Long term liabilities (Note 10) 48,762 (1,197) 47,565Investment in capital assets and collections (Note 13) 64,360 (5,870) 58,490Unrestricted net assets 1,330 144 1,474Consolidated Statement of OperationsGovernment of Alberta grants <strong>11</strong>1,953 323 <strong>11</strong>2,276Student tuition and fees 64,421 409 64,830Sales of services and products 26,829 (101) 26,728Amortization of deferred capital contributions (Note 8) 6,882 (779) 6,103Employee benefits 17,249 (238) 17,0<strong>11</strong>Materials, supplies and services 31,956 2,323 34,279Amortization of capital Assets 15,203 (3,531) <strong>11</strong>,672Note 4Cash and Cash EquivalentsCash and Cash Equivalents with a maximum maturity of 90 days at date of purchase are as follows:20<strong>11</strong> <strong>2010</strong>Cash $ 59,123 $ 78,006Note 5InvestmentsThe composition, fair value, and annual market yields on investments are as follows:20<strong>11</strong> <strong>2010</strong>Market ValueMarket ValueShort-term GIC $ 25,471 $ 25,063Pooled fundsCommon stocks and equivalents 31,133 23,558Fixed income securities 26,136 19,954Cash and equivalents 2,328 2,712Cash holdings 2,129 2,260Cash surrender value of planned gifts (life insurance policies) 766 741other 18 18$ 87,981 $ 74,306Short-term investments 25,471 25,063Long-term and other investments 62,510 49,243$ 87,981 $ 74,306 48 grant Macewan university
Notes to the Consolidated Financial StatementsFor the Year Ended June 30, 20<strong>11</strong> (thousands of dollars)As at June 30, 20<strong>11</strong>, the average annualized effective yields and the terms to maturity are asfollows:• Pooled Funds - Cash and equivalents: 1.01% (<strong>2010</strong> - 1.08%); term to maturity: less than oneyear.• Pooled Funds - Fixed income securities: 3.82% (<strong>2010</strong> - 3.99%); term to maturity: range frommore than one year to less than 20 years.The University has policies and procedures in place governing asset mix, diversification, exposurelimits, credit quality and performance measurement. The University’s Investment Committee,a sub-committee of the Audit and Finance Committee of the Board of Governors, has beendelegated authority for oversight of the University’s investments. The Investment Committee meetsregularly to monitor investments, to review investment manager performance, ensure compliancewith the University’s investment policies and to evaluate the continued appropriateness of theUniversity’s investment policies.The University’s long-term and other investment holdings are managed by RBC DominionSecurities using a specified range of asset mix in pooled funds to achieve an acceptable returnand risk appropriate for a publicly funded post-secondary educational institution. The investmentholdings managed by RBC Dominion Securities are currently separated into two funds,Unrestricted Operating and Restricted Endowments. As at June 30, 20<strong>11</strong>, the market value of thetwo funds were: Unrestricted Operating with investment holdings of $20,597 (<strong>2010</strong> - $18,515); andRestricted Endowment with investment holdings of $39,000 (<strong>2010</strong> - $27,709). The balance of theinvestment portfolio $2,913 (<strong>2010</strong> - $3,019) is held in cash as identified above.Note 6CAPITAL ASSETS AND COLLECTIONS20<strong>11</strong> <strong>2010</strong>Accumulated Net Book Accumulated Net BookCost Amortization Value Cost Amortization ValueLand $ 38,999 $ - $ 38,999 $ 23,617 $ - $ 23,617Buildings and site improvements 292,145 (83,849) 208,296 267,942 (76,731) 191,2<strong>11</strong>Furniture, equipment and vehicles 22,819 (9,948) 12,871 17,428 (8,560) 8,868Library materials 15,160 (8,501) 6,659 14,290 (7,779) 6,5<strong>11</strong>Computers and telecommunicationsequipment 26,023 (12,201) 13,822 16,025 (8,518) 7,507Equipment under capital lease 594 (338) 256 1,014 (662) 352Art collection 122 - 122 122 - 122Work in process 5,149 - 5,149 17,105 - 17,105$ 401,0<strong>11</strong> $ (<strong>11</strong>4,837) $ 286,174 $ 357,543 $ (102,250) $ 255,293Work in process is not amortized as the assets are not yet available for use.Acquisitions during the year include in-kind contributions (such as furniture, equipment and library materials) inthe amount of $10 (<strong>2010</strong> - $12).consolidated financial statements <strong>2010</strong>/20<strong>11</strong> 49