Climate protection needs energy efficient data centers - Stulz GmbH
Climate protection needs energy efficient data centers - Stulz GmbH
Climate protection needs energy efficient data centers - Stulz GmbH

Create successful ePaper yourself
Turn your PDF publications into a flip-book with our unique Google optimized e-Paper software.
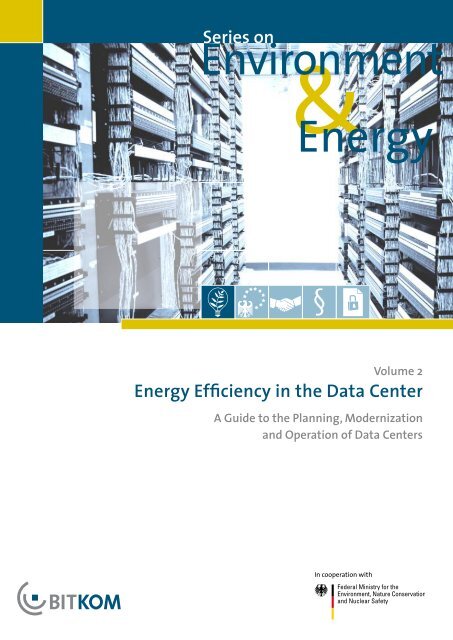
Series onEnvironment& EnergyVolume 2Energy Efficiency in the Data CenterA Guide to the Planning, Modernizationand Operation of Data CentersIn cooperation with
• Publishing DetailsPublished by:BITKOMBundesverband Informationswirtschaft,Telekommunikation und neue Medien e. V.Albrechtstraße 10 A10117 Berlin-MitteTel.: +49.30.27576-0Fax: +49.30.27576-400bitkom@bitkom.orgwww.bitkom.orgContact:Holger SkurkTel.: +49.30.27576-250h.skurk@bitkom.orgEditor:Dr. Ralph Hintemann (BITKOM), Dr. Stefanie Pfahl (Federal Ministry for theEnvironment, Nature Conservation and Nuclear safety)Translation from the German by Caroline TauntAssistant Editor:Christine Faßnacht (BITKOM)Gestaltung / Layout:Design Bureau kokliko / Anna Müller-Rosenberger (BITKOM)Copyright: BITKOM 2008The authors of this document have undertaken every effort to ensure the accuracy and correctness of allcontent herein. However, BITKOM does not assume any legal liability or responsibility for the accuracy,completeness or value of any such information given in this document.2
Energy Efficiency in the Data CenterVolume 2Energy Efficiency in the Data CenterA Guide to the Planning, Modernizationand Operation of Data Centers
<strong>Climate</strong> <strong>protection</strong> <strong>needs</strong> <strong>energy</strong> <strong>efficient</strong> <strong>data</strong> <strong>centers</strong>• A message from Federal Environment Minister Sigmar Gabrielmade to improve <strong>energy</strong> efficiency in this area, then <strong>data</strong>center <strong>energy</strong> consumption is predicted to rise to 11.1 TWhby 2010. That means that, by 2010, the CO2 emissionscaused by German <strong>data</strong> <strong>centers</strong> would rise by approx.50 per cent as compared with 2001.The scale of these figures demonstrates the majorsignificance of <strong>energy</strong> <strong>efficient</strong> <strong>data</strong> <strong>centers</strong> for climate<strong>protection</strong>.This is a highly relevant topic for manufacturers and usersof IT hardware and software, because dwindling resourcesmean that cost pressure often directly influences productprices, competitiveness and thus locational and job security,too.We should make it our common goal to show how thesechallenges can be transformed into positive synergies forimproving resource efficiency, protecting natural resources,lowering costs, generating innovation, saving jobsand creating new ones. New technological solutions andinnovations are called for if we are to meet these economicand ecological challenges.Sigmar Gabriel, Federal Minister for the Environment,Nature Conservation and Nuclear SafetyIn the face of the steady increase in the use of moderninformation and communication technology and theinternet, improving the <strong>energy</strong> efficiency of our <strong>data</strong> <strong>centers</strong>is an important contribution to climate <strong>protection</strong>.Servers and <strong>data</strong> <strong>centers</strong> are among the fastest-growing<strong>energy</strong> consumers within the sector. Experts estimatethat in 2006 the electricity consumption of Germany’sroughly 50 000 <strong>data</strong> <strong>centers</strong> amounted to 8.67 TWh. Thatis the equivalent of the annual power output of threemedium-sized coal-fired power stations. If no efforts areThis guide is an important tool in helping us to reach thisgoal. It points out clearly and concisely the various differentpractical approaches: cooling strategies for improving<strong>data</strong> center <strong>energy</strong> efficiency, for example. It will helpyou to implement improvement measures quickly andeffectively, for the benefit of both the climate and yourown pocket.2
Energy Efficiency in the Data CenterContentWelcome 2Foreword 41 Introduction 52 Developments in Data Center Energy Requirements 62.1 Overview 62.2 Energy consumers in the <strong>data</strong> center 62.3 Challenges for the planning and operation of <strong>data</strong> <strong>centers</strong> 73 Measuring Energy Consumption and Temperatures in the Data Center 83.1 Overview 83.2 Energy monitoring 93.3 Temperature monitoring 94 IT Hardware and Software Optimization 104.1 Overview 104.2 Servers 104.3 Storage solutions 125 Cooling Optimization 135.1 Overview 135.2 Air flow in the room and in the rack 135.3 Power management 165.4 Free cooling 195.5 Chilled water temperature 215.6 The different types of cooling unit 215.7 Different cooling media 225.8 Return air temperature 246 Optimizing the Energy Supply 256.1 Overview 256.2 The impact of UPS systems on <strong>data</strong> center <strong>energy</strong> consumption 256.3 Safe, <strong>energy</strong>-<strong>efficient</strong> UPS topology 276.4 Redundancy: security and efficiency 286.5 Load characteristics, performance category and semiconductor components 306.6 Current developments in UPS efficiency 316.7 Balancing <strong>energy</strong> efficiency, security and quality 336.8 Rackmount intelligent power strips 337 Energy Contracting 36Endnotes 378 Glossary 3810 Acknowledgements 393
Forewordto 18 degrees although they could easily run at up to26° Celsius. Frequently, it is a cost-accounting problemthat lies behind this waste of <strong>energy</strong>: An organisation’s<strong>energy</strong> consumption often falls under the responsibilityof Facility Management. But companies who want to helpput Green IT on the map, cut expenditure and save <strong>energy</strong>whilst protecting the environment at the same time,need to place responsibility for their IT systems’ <strong>energy</strong>consumption where the decisions are made: in the handsof the IT management.The current climate debate has increasingly brought thesubject of Green IT into the public eye. The predictedclimate change is threatening our planet and is going tohave a dramatic impact on our lifestyles. CO2 emissionswill have to be reduced very rapidly if global warming isto be curbed. While it is true that the ICT sector is responsiblefor roughly 2% of all CO2 emissions, it also has to besaid that it contributes around 6% of global value added.This sector’s <strong>energy</strong> efficiency is thus three times betterthan the average for all sectors.Martin Jetter, Member of the BITKOM Executive CommitteeGeneral Manager IBM GermanyChairman of the Board of DirectorsIBM Deutschland <strong>GmbH</strong>Over the next five years <strong>energy</strong> consumption will becomeone of the largest cost factors for many <strong>data</strong> <strong>centers</strong>.Borderstep Institute calculations show that <strong>data</strong> centerelectricity costs have already more than tripled between2000 and 2006. Yet investment in <strong>energy</strong> <strong>efficient</strong> productsand processes often pays off remarkably quickly:payback periods of 2 years and less are the rule here.But there is still a lot to be done: For years now, our branchhas been addressing the problem of how to reduce global<strong>energy</strong> consumption even further. Modern environmental<strong>protection</strong> requires hi-tech solutions. <strong>Climate</strong> change canonly be curbed with the help of innovative ideas and theintelligent application of ICT technologies.The ICT sector thus embodies the idea of climate <strong>protection</strong>more than virtually any other sector. But in order toinitiate the paradigm shift, we first need to make our ownproducts and solutions more <strong>energy</strong> <strong>efficient</strong>. Which iswhy this guide presents the latest available solutions forreducing costs and increasing <strong>energy</strong> efficiency.However, according to a survey carried out by marketresearchers Experton, only 7 per cent of German ITdecision makers are familiar with the <strong>energy</strong> requirementsof their own IT systems! So it’s hardly surprisingthat <strong>data</strong> <strong>centers</strong> are often expensively cooled down4
Energy Efficiency in the Data Center1 IntroductionProcessing power in modern enterprises is continuallyincreasing. Increasing numbers of business processes arebeing supported by centralized information technology(IT). New improved applications and programme featuresrequire high-performance servers. In many cases, comprehensiveIT support for business procedures is mandatoryif you want to compete successfully in today’s globalmarkets. Today, the processing power installed in the <strong>data</strong><strong>centers</strong> of small and medium-sized enterprises equalsthat which, a few years ago, was only to be found in ahandful of major organizations. But this trend - which isessentially a positive one - is also responsible for the highelectric power consumption and cooling requirementsof today’s <strong>data</strong> <strong>centers</strong>. This presents new challengesfor those involved in the planning, implementation andoperation of IT infrastructures.• From the point of view of a company’s social responsibility,reducing its <strong>data</strong> center’s <strong>energy</strong> consumption -with the resulting positive effects for the environment– represents an investment in the future.This guide offers practical advice on the application ofmodern technologies in the planning, implementationand operation of <strong>data</strong> <strong>centers</strong>, in order to considerablyimprove their <strong>energy</strong> efficiency 1 whilst simultaneouslyreducing overall costs: experience has shown that it ispossible to achieve savings in a <strong>data</strong> center’s total costs(planning, construction, infrastructure, operation) of 20per cent or more. These guidelines apply to the planningof new <strong>data</strong> <strong>centers</strong> as well as to modernisation projectsfor existing infrastructures.Nowadays, the application of modern technologies makesit possible to drastically reduce a <strong>data</strong> center’s <strong>energy</strong>requirements. This offers several advantages:•The <strong>data</strong> center’s operating costs are considerablyreduced. As operating costs account for a high proportionof total costs, any investment in improving a <strong>data</strong>center’s <strong>energy</strong> efficiency will often start to pay offafter only a few months.•A <strong>data</strong> center’s power and cooling capacity is oftenlimited by the existing infrastructure or by the powerprovider. In such cases, improving <strong>energy</strong> efficiencycan mean that these limits are never reached, thusobviating the need for additional high investmentcosts.5
2 Developments in Data Center Energy Requirements• 2.1 OverviewInformation and communication technology (ICT) isan important factor in modern economies: In Germanyalone, the Gross Value Added (GVA) of this sector hasgrown by almost 50 per cent since the mid 90s andnow exceeds that of the automobile and mechanicalengineering industries. In 2007 the German ICT markethad a volume of roughly 148 billion Euros. The sectoremploys around 800 000 staff and freelance personnelwith almost another one million ICT specialists workingin other sectors. At the same time, the ICT sector is oneof the main driving forces of economic growth. In theapplications sectors, investment in ICT leads to increasedlabour productivity and facilitates significant product andprocess innovations.In the past, however, these highly positive developmentsalso lead to a continual rise in ICT <strong>energy</strong> consumption.In a study 2 carried out on behalf of the Federal EnvironmentalMinistry, the Borderstep Institute estimates that<strong>energy</strong> consumption in German <strong>data</strong> <strong>centers</strong> more thandoubled between 2000 and 2006, rising from 3.98 billionkWh to 8.67 billion kWh. In fact, due to rises in the cost ofelectric power, <strong>data</strong> center <strong>energy</strong> costs have more thantrebled, rising from 251 million Euros to 867 millionEuros. If this trend continues, electricity costs are likely todouble yet again in the next five years.But the study also reveals that this trend can be reversedthrough the application of modern technologies, despitethe continuing increase in IT performance.The overall electricity consumption of <strong>data</strong> <strong>centers</strong> couldbe halved within the next five years if state-of-the-arttechnologies were used. Despite the probable rise in thecost of electric power, electricity expenditure in <strong>data</strong> <strong>centers</strong>would still be significantly reduced. (Fig.1).Electricity Costsin millions of €18001674 m €1600140012001000867 m €801 m €800600400582 m €200251 m €02000 2002 2004 2006 2008 2010„Current Efficiency Trend” scenario„State-of-the-Art” scenario„Best-Practice” scenarioDevelopment to dateFig. 1: Development of <strong>data</strong> center <strong>energy</strong> costs 3• 2.2 Energy consumers in the <strong>data</strong> centerAn analysis of Data Center equipment reveals that, onaverage, only about half the <strong>energy</strong> consumption isattributable to the IT systems themselves. The additionalessential infrastructure such as air conditioning and uninterruptiblepower supply (UPS) is responsible for the otherhalf. Fig. 2 shows the distribution of <strong>energy</strong> consumptionin the USA between the years 2000 and 2006. On the ITfront, the increased <strong>energy</strong> consumption is mainly attributableto the considerable rise in the number of volumeservers. The ever-increasing volume of <strong>data</strong> means that<strong>energy</strong> consumption in the storage sector has also risendramatically. Today it accounts for roughly 15% of the<strong>energy</strong> demand generated directly by IT systems.6
Energy Efficiency in the Data CenterEnergy Consumptionin billions kWh/year70605040302010028.22000 2001 2002 2003 2004 2005 2006Data Center Infrastructure(Cooling, USV, etc.)Network InfrastruktureStorage InfrastruktureVolume ServerHigh End ServersMidrange ServersFig. 2: Development of <strong>data</strong> center <strong>energy</strong> consumption – relative proportionsof individual end-use components 4• 2.3 Challenges for the planning andoperation of <strong>data</strong> <strong>centers</strong>61.4The developments we have outlined above presentorganisations with major challenges when planningand operating their <strong>data</strong> <strong>centers</strong>. Power density in <strong>data</strong><strong>centers</strong> has increased dramatically in recent years. The perrack <strong>energy</strong> consumption alone has tripled over the pastthree years. It is no longer unusual to find <strong>data</strong> <strong>centers</strong>with power densities of 2500 Watts per m² and more.Those responsible for IT and facility management are nowfacing the following major challenges:Can the required total power supply be guaranteed?Electrical power suppliers now sometimes find it impossibleto meet the high power demands, particularly indensely populated areas. So what are the options forreducing power consumption?How can the heat generated in the <strong>data</strong> center be removed?Are the existing air conditioning systems adequate?How can they be optimally upgraded or modernizedto meet today’s requirements and thus save additional<strong>energy</strong>? Can the exhausted heat be utilized to heat thebuilding, for example?What is the best strategy for dealing with the extremedemands sometimes encountered in individual racks?There are already racks on the market with individualpower consumption levels of 30 kW or more. How canhot-spots be avoided or optimally cooled?Which investment strategy will provide the lowest TCO(Total Cost of Ownership)? It is particularly importantthat <strong>energy</strong> costs should be included in the calculation, inaddition to the costs for hardware, planning, implementationand management. In some areas, such as volumeservers for example, <strong>energy</strong> costs already equal the cost ofthe IT equipment itself.This guide offers you assistance in tackling these questionsand challenges.7
3 Measuring Energy Consumption and Temperaturesin the Data Center• 3.1 OverviewIf you can’t measure it, you can’t optimize it. Many <strong>data</strong><strong>centers</strong> have a lot of catching up to do in this department.A large percentage of companies with <strong>data</strong> <strong>centers</strong> areunable to specify the size of the IT share in their facility’soverall <strong>energy</strong> consumption. This may be due to the factthat, whilst many IT budgets include costs for planning,purchasing and management of the IT systems, theyexclude the <strong>energy</strong> costs. These are often billed under‘overheads’ by the facility management department.Even the simple act of measuring a <strong>data</strong> center’s totalpower requirement will often reveal potential for reducing<strong>energy</strong> consumption and costs. Adequate considerationto the <strong>energy</strong> consumption factor when equipping a<strong>data</strong> center could lead to different investment decisionsbeing taken. A slightly higher investment in an <strong>energy</strong><strong>efficient</strong>cooling system, for example, can start paying offafter only a few months.Green Grid (USA) 5 :• PUE (Power Usage Effectiveness): ratio of a <strong>data</strong>center‘s total power consumption to the powerbeing drawn by its IT equipment alone• DCE (Data Center Efficiency): ratio of power drawnby IT equipment to a <strong>data</strong> center’s total powerconsumption (= 1/PUE)• IEP (IT Equipment Power) the power used by the ITequipment to manage, process, store, or route <strong>data</strong>• TFP (Total Facility Power) a <strong>data</strong> center’s total<strong>energy</strong> consumption incl. power for air conditioning(cooling), power delivery components, monitoring,lighting etc.Uptime Institute (USA) 6 :• SI-EER (Site Infrastructure Energy Efficiency Ratio)ratio of power consumed by a <strong>data</strong> center as awhole to that consumed by the IT equipment only• IT-PEW (IT Productivity per Embedded Watt): valuewhich compares IT productivity (network transactions,storage volume, computing cycles) with thepower required for this productivity• DC-EEP: multiplication of SI-EER and IT-PEWTable 1: Energy Performance MetricsThere are a variety of metrics that can be used to assessthe <strong>energy</strong> efficiency of a <strong>data</strong> center. Examples areoutlined in Table 1. In a top class <strong>data</strong> center, for example,the ratio of power consumed by the entire facility to thatconsumed by the IT equipment (Site Infrastructure EnergyEfficiency Ratio) could be around 1.5. But there are also<strong>data</strong> <strong>centers</strong> in operation with ratios of between twoand three, i.e. in addition to the power used by their ITequipment, they are consuming up to twice that amountof power for air-conditioning, UPS etc. With the appropriatesoftware support, it is also possible to continuouslycalculate and monitor these values in order to uncoverfurther potential for increasing <strong>energy</strong> efficiency.But measuring <strong>data</strong> center <strong>energy</strong> consumption andtemperature can go much further: modern systems makeit possible to record and visualize in detail the <strong>energy</strong>consumption and temperature distribution within a <strong>data</strong>center.The latest, flexible techniques allow fast, graphic realtimeinsights into all levels of <strong>energy</strong> usage in the <strong>data</strong>center – right down to individual active or passivecomponents and their application options. Using infraredcameras to record temperatures, for example, will providea high quality status quo snapshot. However, to ensurethat operations management is permanently secure andefficiency-oriented, continuous, comprehensive monitoringis essential, as well as the graphical depiction ofhistorical performance <strong>data</strong>.8
Energy Efficiency in the Data Center• 3.2 Energy monitoringThere are two, mutually complementary approaches tomonitoring <strong>energy</strong> consumption in the <strong>data</strong> center: servermonitoring and <strong>energy</strong> monitoring. Server monitoringrecords the “production” <strong>data</strong> and <strong>energy</strong> monitoring the“supply” <strong>data</strong>.• common tools for IT, <strong>energy</strong>, financial management,procurement, etc.• development of short, middle and long-term <strong>energy</strong>strategies• 3.3 Temperature monitoringServer Monitoring (“Production”)• low-cost IT monitoring of all relevant load <strong>data</strong>• <strong>efficient</strong> detection of power• fast and detailed analysis of individual disturbances• graphic documentation of measures taken (before– after)Energy Monitoring (“Supply”)• consolidation of IT and <strong>energy</strong> management• integration of additional parameters (meteorological<strong>data</strong>, etc.)The detailed collection and visualization of temperaturedistribution <strong>data</strong> (Figure 3) offers several advantages. Hotspotscan be identified and appropriate measures takento eliminate them. Temperature distribution within the<strong>data</strong> center can be optimized by regulating the air volumeflow, for example, thus avoiding both unnecessarily lowtemperatures and dangerously high temperatures. Thisreduces costs and improves availability. If the temperaturedistribution is known, any further upgrading of the <strong>data</strong>center can be realized in an <strong>energy</strong>-optimized way.Fig. 3: Temperature distribution in a <strong>data</strong> center with hot spot (Source: IBM)9
4 IT Hardware and Software Optimization• 4.1 OverviewThe optimization of IT hardware and software is crucialto reducing <strong>data</strong> center power consumption. Each watt ofpower saved on the IT side is one watt less which <strong>needs</strong>cooling or UPS-backup. This translates into a two-foldsaving. Detailed advice on IT operations and the appropriatehard and software is beyond the scope of this guide,as its main focus is “<strong>data</strong> center design and infrastructure”.And so we can only offer a brief overview here ofthe savings potential which can be realized through IThard and software.Reduce System Power Consumption• <strong>efficient</strong> hardware is highly dependent upon productdesign• the right choice of components and software,together with precise dimensioning will reduce<strong>energy</strong> consumptionEfficient Use of Hardware Resources• consolidation and virtualization can lead to majorreductions in <strong>energy</strong> and materials consumption• infrastructure optimization means that hardwarecan be turned off when not in useTable 2: Overview of <strong>energy</strong> saving options for servers• 4.2 ServersAs Figure 2 demonstrates, volume servers account forabout 2/3 of the <strong>energy</strong> consumed by IT hardware. Andso it follows that the volume server area harbours greatsavings potential for reducing overall IT <strong>energy</strong> consumption.This is augmented by the fact that many of today’svolume servers operate at very low capacities. Averageutilization levels of just 10 per cent are not uncommon.But low capacity operation also means poor efficiencylevels. Even when in idle mode, a server still requires considerablymore that 70 per cent of its maximum performancepower.There are two basic approaches to reducing server <strong>energy</strong>consumption. One method is to optimize the hardwareso that it uses less electric power. The other option is toimprove the operation of this hardware so as to increasethe average utilization level of the systems. This resultsin two-fold savings: through lower power consumptionand a reduction in hardware. To achieve optimum results,both approaches should be followed simultaneously (seeTable 2).Figure 4 shows a typical distribution of the <strong>energy</strong> consumptionof individual server components. This reveals<strong>energy</strong> savings potential: small, 2.5” hard disk drives, forexample, consume less <strong>energy</strong> than 3.5” hard drives, harddrives with lower revolution rates use less <strong>energy</strong> thanthose with high revolution rates. If hard drive access timesand <strong>data</strong> transfer rates are not critical factors in the plannedapplication, there is often no noticeable difference insystem performance.The choice of appropriate components, right-sized to fitthe individual application, has a correlative effect on theother components so that they, too, will have reduced<strong>energy</strong>/power demands. From an <strong>energy</strong> efficiencyperspective it is preferable to deploy one large memorymodule than two smaller modules with the same overallcapacity. There are now also some highly effective,<strong>energy</strong>-<strong>efficient</strong> CPUs, fans and PSUs on the market.Server air-flow is also an area with high <strong>energy</strong> savingspotential. Servers should be designed to draw air in acrosstheir entire front surface to ensure optimum convectioncooling. Increasing the size of the air intake vent ofeach CPU socket means that the ventilation system canoperate at higher supply air temperatures or expend less10
Energy Efficiency in the Data CenterMainboard 10%Fans 13%PSUs 20%CPU 31%Memory 10%even greater when systems are used more <strong>efficient</strong>ly:consolidation and virtualization are the keywords here.The term consolidation describes the process of harmonizingand amalgamating systems, applications, <strong>data</strong>basesor strategies. The aim here is usually to simplify the infrastructureand render it more flexible. The process usuallyleads to a considerable reduction in <strong>energy</strong> consumption.HDDs 16%Fig. 4: Typical breakdown of a server’s <strong>energy</strong> consumption (Source:Fujitsu Siemens Computers)<strong>energy</strong> for cooling. With the blade server form factor inparticular, it is important that the design of both ventilationsystem and power supply should be carefully coordinatedso that space is saved in the right places. Inappropriatereduction of the size of the enclosure which housesthe CPU and RAM will lead to increased heat density, willgenerate hotspots and require more <strong>energy</strong> to transportthe same volume of air through a smaller cross-sectionalarea.Considerable <strong>energy</strong> savings can thus be achieved byhardware optimization alone, and the potential is oftenVirtualization means abstraction: logical systems areabstracted from actual physical hardware. In this processresources are not dedicated but are used collectively,which gives greater flexibility as regards availability andmeans that capacities are better exploited. This can increasesystem utilization rates considerably and thus save alot of <strong>energy</strong> at the same time.Figure 5 shows an example of server consolidation andvirtualization. Overall <strong>energy</strong> consumption can be drasticallyreduced – by 50 per cent in this example – whilststill retaining the same levels of system performance andavailability, by moving 4 system workloads onto one highperformancesystem with professional virtualization. Thisis one of the more conservative examples – appreciablyhigher savings are possible, depending on the applicationin question.Server consolidation saves <strong>energy</strong>Application 1Application 2Application 3ApplicationAPP 44Application 7Application 8Application 1Application 2Application 3Application 4Application 5Application 6Application 7Application 8System 1System 2System4Professional Virtualization10% active2KW10% active2KW10% active2KW50% active4KWTotal Energy 8KWTotal Energy 4KWFig. 5: Energy savings through consolidation and virtualization11
Solutions which automatically shut down serversand then restart them also offer great <strong>energy</strong> savingspotential. Many applications make only partial use ofservers during a given period – only during office hours,for example, or only Monday to Friday. Servers can besystematically powered down during periods where thecomputational load is known to be only minimal. Todaythere are already solutions available for achieving this,especially in conjunction with virtualization technology.Time management of server activities is another areawhich harbours opportunities for economizing on <strong>energy</strong>and costs. Energy demands can temporarily peak whensimultaneous server activities overlap, as standard settingsare not changed (e.g. certain services are executedon the hour, every hour). Temporal coordination of serverloads results in balanced <strong>energy</strong> demands.• 4.3 Storage solutionsData storage constitutes a relatively small proportion ofthe overall <strong>energy</strong> consumption in <strong>data</strong> <strong>centers</strong>. Nevertheless,it is worth considering <strong>energy</strong> efficiency optimizationmeasures in this department, too, for <strong>data</strong> volume is stillgrowing rapidly, and with it, the storage solution proportionof overall IT <strong>energy</strong> consumption (see Fig. 2).One apparently simple method of reducing <strong>data</strong> storagerelated<strong>energy</strong> consumption is the optimization of <strong>data</strong>management: unnecessary and obsolete <strong>data</strong> should bedeleted.of information objects throughout their useful life. This isan optimization process, by which a rules engine based onbusiness policies and the assessment of storage hierarchycost structures, determines the most appropriate storagelocation for the managed information objects. Only thoseinformation objects requiring high availability are storedon expensive, high-performance disks with high <strong>energy</strong>consumption. ILM helps to save <strong>energy</strong> because it alwaysselects the optimum - and thus the most <strong>energy</strong> <strong>efficient</strong>– storage solution and automatically deletes the informationobjects at the end of their life-cycle.Another <strong>energy</strong>-saving <strong>data</strong> storage approach is the useof tape systems to archive <strong>data</strong>. Unlike harddisks, tapesconsume no <strong>energy</strong> until the <strong>data</strong> is accessed. Energy-optimizedstorage systems, drives with high storage densityand other modern technologies such as de-duplicationand automatic powering down of idle hard disk drives canall help to minimize <strong>energy</strong> consumption.Table 3 shows the recommended sequence of steps forreducing <strong>data</strong> storage <strong>energy</strong> consumption.1. Optimize <strong>data</strong> management• Delete obsolete <strong>data</strong>• Delete unnecessary <strong>data</strong>2. Optimize infrastructure• Consolidation• Use ILM• Use tape systems3. Optimize devices• Apply state of the art technologyIn many organizations multimedia files such as mp3 orvideo files now constitute the majority of all <strong>data</strong> – evenif they are never required for business operations. In additionto this, files are often stored in multiple locations.Precise file-handling procedures supported by high-performancesoftware can drastically reduce the amount of<strong>data</strong> being stored.Table 3: Recommended steps for reducing <strong>energy</strong> consumption in <strong>data</strong>storage environmentsIn this context, it is also worth considering the concept ofinformation lifecycle management (ILM). ILM is a storagemanagement concept involving the active management12
Energy Efficiency in the Data Center5 Cooling Optimization• 5.1 OverviewCooling plays a key role in the design, construction andoperation of a <strong>data</strong> center. This is partially due to thefact that cooling accounts for a large proportion of the<strong>energy</strong> costs. Depending on local conditions and coolingsystem design, this proportion generally constitutes atleast 20% of total <strong>energy</strong> costs, but this must be seen asthe lower limit. There are also installations in operationwhere cooling accounts for over 60% of overall powerconsumption. Designing a cooling system, on the otherhand, presents a major challenge, as it usually constitutesa mid to long-term investment which will be in operationfor several IT generations. In the following, we point outthe various approaches to optimizing <strong>data</strong> center coolingsystems which will give you the lowest possible <strong>energy</strong>consumption.This approach entails positioning the racks face to face,as recommended in VDI 2054 or by ASHRAE TechnicalCommittee 9.9. In this setup, the cooled supply air isdistributed into the cold aisle from where it is drawn in bythe servers on both sides and then exhausted out of theback of the systems to the hot aisle.Cold Air Hot Air• 5.2 Air flow in the room and in the rackFigure 6: Hot Aisle/Cold Aisle Configuration5.2.1 Hot aisle-cold aisle layoutTraditional <strong>data</strong> <strong>centers</strong> use air as a cooling medium inboth racks and computer rooms. The heat loads to bedissipated are steadily rising.The most commonly-used and effective strategy forcooling computer rooms with air is a layout of alternatinghot and cold aisles (see Fig. 6). The cooling air is fedunder a raised floor and distributed through strategicallypositioned perforated floor tiles and exhausted via a dropceiling return air plenum.The majority of servers produced today draw in the conditionedsupply air at the front and expel it again at theback. And so it makes sense to arrange the server rackswith perforated front and back doors in such a way as tocreate hot aisles and cold aisles.Cold AirHot AirFigure 7: Example of air flow in a <strong>data</strong> center with hot aisle/cold aislelayout and adverse bypassing and recirculation of airThe temperature spread (the difference between returnair and supply air) is limited by the maximum permittedexhaust air temperatures of the IT components. In orderto meet ever increasing cooling loads, either the intake13
air temperature is drastically reduced or the volume ofcooling air supplied to the servers by computer room airconditioning (CRAC) units has to be continually increased.This produces extremely high airflow velocities in theroom.When this type of thermal management meets itscooling performance limits, the high air velocities haveadverse effects such as air bypassing or recirculation ofcooling air (see Fig. 7). Avoiding these phenomena candramatically reduce operating costs.The bottleneck in the supply route of conditioned airto the racks is located primarily in the raised floor. Thecooling air for the entire room has to be fed through here,despite obstructions to airflow such as cabling or pipingfor liquid refrigerants. The clearance heights of today’sraised floors typically begin at around 300 mm and canreach heights of 2 or 3 metres or more in high-performance<strong>data</strong> <strong>centers</strong>.warm air passes over the cabinets where it collects and isreturned to the CRAC units.Various different manufacturers offer a range of systemswhich support or improve cooling efficiency by providingadditional cooling capacity in the cold aisles, but notthrough the underfloor plenum.5.2.2 Cold aisle and hot aisle containmentThe advantages of the hot aisle/cold aisle configurationcan be further enhanced by the containment of eitherthe hot or the cold aisle. This prevents the occurrence ofhot air short circuits or the mixing of hot exhaust air withcool supply air. Thermal management must always beadjusted to the number of servers.A hot aisle/cold aisle layout provides the opportunity forimproved cable management, both inside the racks and inthe underfloor plenum. As far as possible, cabling shouldbe routed through the hot aisles only, to ensure a freeflow of air in the cold aisles.The perforated floor tiles should be installed in the coldaisles only and the CRAC units positioned at the ends ofthe hot aisles - NOT aligned with the rack rows. A setupwhere CRAC units are positioned parallel to the rackrows causes a mixing of hot and cold air, which leads toinsufficient cooling of the IT equipment in the upper racksections. And what is more, the lower air intake temperaturesof the CRAC units will considerably reduce theoverall efficiency of the system.If planned and implemented with care, a hot aisle/coldaisle layout can dissipate heat loads of up to approximately5kW per rack. These figures are usually considerablylower in older <strong>data</strong> <strong>centers</strong>: between approximately1 and 2 kW per rack. If the setup is well designed, the coldaisles should be completely filled with cool air, whilst theCold Air Hot AirFig. 8: Cold Aisle ContainmentCare should be taken to ensure that the containment areais fully enclosed. In the case of cold aisle containment, thismeans sealing off the aisle from above with roof componentsand to the front and rear with doors, separatinghot and cold areas inside the cabinets (unused rack spacesand vertical spaces to the sides of the 19“ zone), as well assealing off the floor in the warm zone (inside the cabinetsand in the hot aisles).14
spots in the racks for example, and the avoidance of faultsources when altering cable routing.Ideally, as much as possible of the cross-sectional area inthe underfloor plenum should be made available to theair volume flow. Unnecessary obstacles in the underfloorplenum need to be eliminated: surplus cables should beremoved and essential cabling laid in such a way that nohigh crossings occur.Special cable seals with overlapping brushes are recommendedin order to seal openings for cable assembliesand wiring as well as possible. They will guarantee a tightseal, even with very large volumes of cable.It is advisable to dimension the height of the raised flooradequately, right from the planning stage, to ensure thatthere will be no bottlenecks if changes need to be madelater on, to IT or cabling, for example.Optimal and <strong>energy</strong>-<strong>efficient</strong> cooling demands intelligentcable management and the deployment of the latest productsin the rack. Cabling must not be allowed to impedeair flow.In enclosed cabinet cooling solutions and server cabinetswith very high heat loads, cabinets may well have to beeven deeper, as additional space is required in front of andbehind the 19” installations for the transport of the veryhigh volumes of cooling air (up to 6000 cbm/h in onecabinet). For these applications there are cabinet depthsof 1300mm, 1400mm and 1500 available on the market.• 5.3 Power management5.3.1 Power management as an approachto improving <strong>energy</strong> efficiency5.2.4 Rack depth extensionPower management is absolutely essential for an <strong>energy</strong><strong>efficient</strong>,<strong>energy</strong>-optimized <strong>data</strong> center operation.Rack depth is a key specification when equipping a <strong>data</strong>center. In standard configurations of alternating hot andcold aisles rack depth is a prime determinant for the spacingof axes within the <strong>data</strong> center.Where heterogeneous server systems are operatingwithin the same rack - which is more likely to be the rulethan the exception – IT administrators must opt for adepth-variable solution. A homogenous layout is desirablefor <strong>energy</strong> efficiency reasons.There are various different HVAC systems available fortransporting heat away from the chip and out of thebuilding. They use gaseous or liquid media to do so andinclude such devices as air circulation units, cold waterunits, chillers, heat exchangers and condensers. All thesesystems need to be considered individually and thenoptimally coordinated.5.3.2 Power control in the air cycleUp until a few years ago the standard depth for serverracks was 1000mm. In recent years racks with depthsof 1070mm, 1100mm or 1200 have also come onto themarket.This can be attributed, on the one hand, to the introductionof servers with a rack mount depth in excess of thestandard 740mm, and on the other, to a demand for morespace behind the installations to accommodate cablingand PDUs.As with any technical equipment, precision coolers, too,have many different components where <strong>energy</strong> savingscan be made. The choice of fans, for example, offers greatsavings potential, for they run 24 hours a day and thus8760 hours a year. It is this consideration which has leadto the rapid breakthrough of EC (electronically commutated)fans. The power consumption of these speedcontrolledfans drops drastically when air volume flow isreduced.16
Energy Efficiency in the Data CenterWhen an air handling unit is redundantly configured,major <strong>energy</strong> savings can be achieved by running allunits simultaneously at correspondingly reduced speedsand only when a unit fails, switching the others to ratedspeed.The components and systems must be operated as<strong>energy</strong>-<strong>efficient</strong>ly as possible. This can best be achievedwhen HVAC units and systems are dimensioned to meetmaximum load requirements and can be automaticallyadjusted to cope with prevailing heat loads. Optimum,<strong>energy</strong>-<strong>efficient</strong> power control must encompass both theventilation and water/refrigerant cycles.Initially, power control optimizes HVAC technology forstatic operating conditions. But <strong>data</strong> center heat loadsvary over time, according to installation workloads, withslumps occurring particularly at night and at weekends. Inthe case of fluctuating loads, it is thus the task of controlsystems to dynamically adjust the HVAC equipment tomeet the varying heat loads.The trend toward server virtualisation in particular, opensup a whole new set of opportunities for increased efficiency.Workloads can be rapidly migrated to other physicalservers and at off-peak times whole cabinets or even rowsof cabinets can be cleared of applications and shut down.potential HVAC <strong>energy</strong> savings of between 30 and 60 percent.Temperature measurements or electrical <strong>energy</strong> consumptioncan both serve as reference variables for powercontrol, as all the electricity is converted into heat aftera slight delay. However, this is only valid for <strong>data</strong> <strong>centers</strong>where there are no other major <strong>energy</strong> inputs such assolar radiation, for example. From an <strong>energy</strong>-efficiencyperspective it is therefore preferable to use interior roomsas <strong>data</strong> center space.The ASHRAE Technical Committee 9.9 has set an internationallyrecognized standard for air intake temperaturesof electronic equipment in <strong>data</strong> <strong>centers</strong>. 7 According tothis standard, the recommended intake temperature forelectronic components in the <strong>data</strong> center lies between20° and 25°C, with an additional “allowable” range of 15°to 32°C. These recommendations dating from 2004 arecurrently being revised. It is safe to assume that ASHRAEwill raise their recommended temperature levels. Outletair temperatures and permitted humidity ranges areprescribed by the manufacturers of servers, mass storagedevices, switches and other equipment. For reasons of<strong>energy</strong> efficiency it is advisable to attain the highest possibletemperature level, as this directly affects the coolingsystem’s <strong>energy</strong> consumption (see section 5.8).HVAC infrastructure should be adjusted accordingly, byshutting down individual CRAC units for example, orthrottling back several of these units. Care should betaken to ensure that the minimum air volume of theHVAC units can support the required supply pressure of atleast 25Pa in the underfloor plenum.And so the appropriate deployment and configuration ofIT components within the <strong>data</strong> center plays a vital role inthe <strong>energy</strong> <strong>efficient</strong> application of cooling technology.By using intake and exhaust air temperature sensors tosystematically monitor power in the racks, it is possible todirectly influence both the power consumption and theair volume flow of the cooled cabinets. This process yieldsUnder ASHRAE guidelines, conventional servers permit atemperature spread of about 15K and blade servers about28K (between intake and outlet). By fully exploiting thisspread it is possible to minimize the volume of coolingair and the <strong>energy</strong> required for circulating it in the room.When planning a <strong>data</strong> center, these factors should beverified in advance and incorporated into the design.5.3.3 Power control in the water cooling/refrigerant cycleIn a water cooling/refrigerant cycle, the collective heatload is conveyed out of the building and usually dissipatedinto the surrounding air.17
Temperature levels in both the cooling cycle and the environmentinto which the heat load is dissipated, as wellas the temperature difference between supply and returnpiping, are decisive factors for a cooling system’s <strong>energy</strong>efficiency. The higher level is dictated by the temperatureof the surrounding environment (ambient temperature),the lower level by the transfer temperature from the aircycle.The ambient temperature depends on the <strong>data</strong> center’sgeographical location as well as on the time of dayand season. And the installation location of the heatexchangers is another factor which shouldn’t be underrated.Direct sunlight should be avoided at all costs, asthis would impair the performance and efficiency of thecooling system.And so various <strong>energy</strong>-optimized control strategies forthis cycle present themselves.determined by the particular CPU and server models andso could not be standardized.Thirdly, as in the air cycle, power control can also be usedto regulate mass flow in the liquid cycle in such a waythat the optimal temperature spread is exploited.5.3.4 Dynamic power control andequipment maintenanceAbove and beyond the application of optimized componentsand systems, the dynamic control of thesesystems will improve <strong>energy</strong> efficiency even further.Whereas the operating conditions at the systems’ setpoint (max. heat load) are relatively constant, powercontrol techniques can change various parameters whenthe heat load drops.Firstly, if ambient temperatures are relatively low, acontrol system can be used to regulate the dischargeof waste heat to the environment. In this case, the heatmust be temporarily stored. As <strong>data</strong> <strong>centers</strong> produce largeamounts of heat which cannot be stored indefinitely, theprime option here is to utilize daily temperature fluctuations.The required buffer tank must be adequatelydimensioned so that it can store the waste heat duringthe day and dissipate it to the surrounding air at night.Secondly, the heat occurring in components can betapped at the highest possible temperature. The higherthe temperature tapped at the ICT equipment, the more<strong>efficient</strong>ly can the HVAC system, particularly free coolingcomponents, be operated. The optimum solution herewould be “chip cooling”, whereby the heat is removed bymeans of a liquid heat transfer agent at levels roughlyequivalent to the component operating temperatures.This type of chip cooling is already being used in certainspecial applications, but the technology has not yetbeen introduced on a wide scale. Before this can happen,servers will have to undergo considerable constructionalchanges. Furthermore, these solutions would be entirelyPower control can throttle back or shut down the HVACsystems to meet the prevailing total heat load.The following strategies can be particularly recommendedhere:• The volume of air in the air cycle can be minimizedusing speed-controlled fans. (CAUTION: Minimumpressure of 25Pa in the underfloor plenum must besustained!)• Subject to the prevailing operating conditions, thefeed temperature in the fluid cycle can be set as highas possible.• By using dynamic control to regulate the free coolingswitch point, it is possible to achieve longer periods ofcooling without the use of chiller compressors.This will optimize the main components of the HVACsystem’s <strong>energy</strong> consumption:• The operating <strong>energy</strong> required by the fans for air circulationis reduced.• The drive capacities of the chillers’ refrigerationunits drop because their efficiency increases as thedifference between outlet air temperature and feedtemperature decreases.18
Energy Efficiency in the Data Center•The periods during which active cooling can be repla-ced by free cooling are considerably lengthened.The routine maintenance of all equipment is anotherimportant practice for ensuring <strong>energy</strong> <strong>efficient</strong> <strong>data</strong>center operations, and something which is also requiredby law. Dirty filters in particular cause high <strong>energy</strong>consumption by increasing the load on fans or on pumpsin the water cycle. Power control can only provide optimalutilization if the equipment is properly serviced andmaintained.• 5.4 Free cooling5.4.1 Free cooling as an approach toincreasing <strong>energy</strong> efficiencyFree cooling is particularly suitable for the air conditioningof <strong>data</strong> <strong>centers</strong> located in cold and temperate climates. Itis important to differentiate between direct free coolingand indirect free cooling. Air conditioning systems for freecooling have been built for over 30 years. In recent years,the design of the systems has been refined in line withtechnological progress (microprocessor control, speedcontrolledcomponents etc.) and this has opened up evengreater potential for <strong>energy</strong> savings.5.4.2 Direct free coolingIn addition to a cooling cycle, the air conditioners are alsoequipped with a system of dampers. The damper controlsystem allows outside air to enter the room and indoorair to be transferred back outside or can be switched toa recirculation mode, i.e. the air is circulated within theroom being cooled and is cooled via the cooling cycle.Fig. 10: Air conditioning units with direct free coolingThe type of air handling system used depends on externalclimatic conditions and the required room conditions.Here one has to differentiate between free cooling mode,mixed mode operation (free cooling with additional coolingprovided by the cooling cycle) and recirculation mode(cooling via cooling cycle alone).In direct free cooling, cold outside air is transportedinto the room. The heat load from the IT equipment istransferred to the air stream and this transports it out ofthe room. The air current is fed or circulated through anexternal air filter and a fan unit.This mode of operation offers considerable <strong>energy</strong>savingspotential in cold and temperate climates inparticular, thanks to annual temperature patterns. If outsideambient temperatures rise, the air handling controlsystem switches to mixed mode so that additional heatcan be removed via the cooling cycle.In mixed mode operation the cooling cycle is initially onlyoperational for short periods when outside temperaturesare low. When outside temperatures rise, the coolingcycle runs more frequently until the air handling controlsystem finally shuts off the intake of outside air entirelyby means of a system of dampers, and the air handlingunit continues in recirculation mode. At high outsideambient temperatures the cooling cycle alone is responsiblefor extracting the heat from the ICT equipment via the19
circulating air stream. In this mode the system also hasthe highest <strong>energy</strong> consumption.Direct free cooling is particularly suited for applicationin smaller facilities such as telecom containers/shelters.In view of the fact that larger scale facilities with greaterheat loads require proportionately larger volumes ofoutside air to be transported into the room through thebuilding envelope, and that room humidity has to becontrolled within narrow tolerances in <strong>data</strong> center air conditioning,direct free cooling is not normally an option forsuch installations.in the <strong>energy</strong> consumption of the air conditioning system.If outside air temperatures rise, the cooling cycle has to berun more frequently. Depending on the system’s design,it automatically shuts down the free cooling function athigh outside temperatures and cooling is then providedexclusively via the cooling cycle. This mode of operation isonly necessary when outside temperatures are high andthen it requires the highest <strong>energy</strong> input.The design and construction of indirect free cooling systemsvaries, sometimes considerably. The systems can becategorized in three basic groups:In addition, when operating a system with direct free cooling,the air filters require particular attention. The highvolumes of outside air shorten filter lifetimes drastically,especially in locations with high dust levels. They alsoreduce the efficiency of the air conditioning system andincrease operating costs.5.4.3 Indirect free cooling•••air conditioning units with integrated free coolingfunction and recooling unit (small and mid-sizerooms),water cooled units with central chilled water generationand integrated free cooling function in thechillers (mid-size and large rooms),water cooled units with central chilled water generationand external free cooling function via recoolingunit (large rooms).With indirect free cooling, unlike the direct version,outside air is not used directly to cool the ICT equipment.All the indirect free cooling systems outlined below workon the principle that, in free cooling mode, a water/glycolsolution is cooled by the outside air without using acooling cycle and can then be used to cool the circulatingair stream inside the facility. The interpolated water/glycol solution functions as the coolant and is circulatedthrough a piping system by pumps.5.4.4 Other <strong>energy</strong>-saving options: freecooling system designThe system design must be geared to the annual temperaturepattern of the particular location. All the systemcomponents must be carefully configured so that thesystem can provide the greatest possible <strong>energy</strong> savingsonce in operation.Indirect free cooling offers major <strong>energy</strong>-savings potentialfor <strong>data</strong> center air conditioning. Although the additionalcomponents required for indirect free cooling incur higherinvestment costs for the air conditioning system, thisadditional outlay is compensated in the medium term bydramatically reduced operating costs.The savings opportunities offered by indirect free coolingare particularly attractive in cold and temperate climates.Low outside air temperatures make it possible to reducechiller operation time which, in turn, leads to a reductionTo achieve this it is important to consider both room temperatureand room humidity to ensure that the system asa whole can make optimal use of free cooling.Room temperatureWithin a conceptual design framework, room temperatureis a crucial factor influencing both the configurationof the system and <strong>energy</strong> efficiency. Higher room temperaturescan be maintained over longer operating periodsby indirect free cooling, without the need for additionalrefrigeration, thus contributing directly to <strong>energy</strong> savings.20
Energy Efficiency in the Data CenterRoom humidityLike room temperature, room humidity also has aneffect on <strong>energy</strong> efficiency. Low relative humidity incombination with a higher room temperature will allowair conditioning units to be run more <strong>efficient</strong>ly. Whenoperated under these conditions, the air conditioningunits are able to provide sensitive cooling, i.e. there is nodehumidification.Excessive relative room humidity combined with a lowerroom temperature will automatically cause the airconditioning units to produce latent cooling which willinevitably cause dehumidification of the air stream. Extrapower is then required to replenish humidity by meansof a humidifier to ensure that it does not sink belowacceptable levels.Scalable coolingModern air conditioning systems should also be able toreact flexibly to partial load conditions within the facilityand provide demand oriented cooling using the lowestpossible <strong>energy</strong> input. This can be effected by raising thechilled water temperature, as this will maximise the freecooling operating period still further. Scalability is particularlyrelevant when a facility is being upgraded in phasesor where there are fluctuating heat loads.An economic feasibility study must be carried out todetermine which system is the most suitable. The installationsituation, loads and acoustic conditions must alsobe taken into account here, so that a viable solution iseventually arrived at.• 5.5 Chilled water temperatureIn large-scale <strong>data</strong> <strong>centers</strong> around 90 per cent of thethermal <strong>energy</strong> is transported in a water/glycol solution(brine). In free cooling systems, brine as a heat transfermedium has a great advantage over direct evaporationsystems. When ambient outside air temperatures are lowenough, the cold air can be utilized to cool the <strong>data</strong> centerdirectly.To fully exploit this effect and reduce the proportion oflatent cooling to as near zero as possible, the temperatureof the brine in the air conditioning units must be ashigh as possible, approx. 12°C supply temperature andapprox. 18° return temperature. Higher temperaturesare even more advantageous from an <strong>energy</strong> efficiencyperspective.The average room air temperature in <strong>data</strong> <strong>centers</strong>corresponds directly with the brine supply temperature.Experience has shown that the <strong>energy</strong> consumption of anair conditioning system can be reduced by about 15% atan average room temperature of 26°C as opposed to 22°C.The higher temperature of the room air permits higherchilled water supply temperatures, thus increasing thenumber of free cooling operating hours considerably andsubstantially raising performance levels (EER).• 5.6 The different types of cooling unitSuitable hardware is required before the above-mentionedcooling strategies can be put into practice. There area wide range of manufacturers on the market offeringair conditioning units of all shapes and sizes. To enablethe right choice to be made from an <strong>energy</strong> point of view,there now follows an examination of a wide variety ofdifferent systems.The types of unit available can basically be divided intocomfort and precision air conditioners. In both cases it ispossible to use chilled water (CW) and cooling agents (DX= direct expansion) as mediums for removing the thermal<strong>energy</strong> extracted from the room air. In addition there arealso the water-cooled racks and several special, manufacturer-specificsolutions.1. The comfort devices include fan-coil-units (= fanconvectors) which have an air-water heat exchangerwith integrated blower, and the split unit air conditionerswhich use a cooling medium and are morecommonly used in smaller spaces. But these types ofunit have several disadvantages which make themunsuitable for application in computer rooms: The21
2.3.volume of circulated air is very small, the chilled air isblown in from above, which is highly disadvantageousfrom a thermodynamic perspective, the split unitscause excessive dehumidification, the control systemsare only very basic and do not take room humidityinto account. What is more, the split units operatein<strong>efficient</strong>ly as far as sensible cooling is concerned 8 .This means that they are neither <strong>energy</strong> <strong>efficient</strong> norsuitable for year-round operation.Precision air conditioners were originally developedfor use in computer rooms and can be divided intotwo groups, according to the air-flow routing: downflow(= air intake from the top, discharge throughthe base) and upflow (= air intake from bottom frontor rear, discharge through the top. These units havemicroprocessor controls which constantly monitorboth temperature and relative humidity and are programmedfor <strong>energy</strong> optimized operation. Precisionair conditioners deliver virtually 100 per cent sensiblecooling and <strong>efficient</strong>ly apply the <strong>energy</strong> used forcooling production to reduceroom temperature levels.Another strategic point in the design of <strong>energy</strong>-<strong>efficient</strong>precision air conditioners is the dimensioning ofthe heat exchanger surface area 9 . The greater this is,the lower the dehumidification capacity. This can bediscerned from the observation of a minimal differencebetween sensible and overall cooling performance.This difference, also known as latent cooling,extracts humidity from the return air and consumes<strong>energy</strong>. However, as the relative humidity in <strong>data</strong><strong>centers</strong> <strong>needs</strong> to be kept within the tolerance limitsprescribed by the hardware manufacturers to avoidproblems with electrostatic charging, more <strong>energy</strong>has to be expended to replenish the room air with theextracted humidity.The performance of computer hardware continuesto soar, whilst dimensions steadily decrease anddevelopments such as the (blade) server in particular,mean that today’s HVAC technology faces the additionalchallenge of dealing with heat loads of 30 kWand more per rack. The answer is a rack with a built-inair-water heat exchanger and load-dependent, speedcontrolled fans. This ensures adequate cooling for allthe computers in the rack and it also means that onlythe computers are cooled, not any other loads such astransmission, lighting etc.4. In addition to the standard cooling units alreadydescribed above, there are also some manufacturerspecificsolutions which cannot be elaborated uponhere (rack-mounted cooling modules which enhancecold-aisle cooling, for example). These solutionscertainly have their justifications when used in thespecific applications for which they were conceived,but a detailed examination of their <strong>energy</strong> efficiencycharacteristics is beyond the scope of this guide.• 5.7 Different cooling mediaThe cooling systems for IT environments can be differentiatedaccording to both the type of unit and the coolingmedium it employs. Every type of cooling is based on thephysical law which states that <strong>energy</strong> can never be destroyed,only transported. In computer environments air isused as a primary <strong>energy</strong> carrier because of its superiordistribution qualities. Water, however, can store heataround 3,500 times better than air can, and is thus thebetter choice of medium for transporting the extractedheat out of the room. Depending on the type of applicationand local conditions, it may be feasible to use coolingmedia other than water.Water as a cooling mediumWater lends itself to use as a cooling medium primarilyon account of its easy controllability, ready availability andvery moderate expense. In addition, at low outside temperaturesit is easy and cost-effective to run a water-basedcooling operation which exploits free cooling advantagesand reduces <strong>energy</strong> consumption.The disadvantages of water within the <strong>data</strong> center areno longer relevant thanks to the technological progressof the past decades:22
Energy Efficiency in the Data Center• Modern pump systems are infinitely adjustable,depending on the required volume of water and temperaturedifference and when the pumping capacity isthrottled back, <strong>energy</strong> consumption is automaticallyreduced as well.• Through the addition of an antifreeze agent (“glycol”),the freezing point can be lowered to far below 0°C.Nowadays, these agents are also corrosion inhibitors,which makes them doubly useful.• Today, compared with other cooling mediums, wateris much the safer coolant for <strong>data</strong> center application.This can be accredited to its leak detection potentialand/or the fact that the water system can be sealedagainst electrical systems through the use of conduitswith systematic drainage.Refrigerants as cooling mediaRefrigerants are often synthetically produced, chemicalsubstances or compounds. Their low boiling points aretaken advantage of in chillers. Of course, natural substancessuch as water 10 , ammonia or carbon dioxide are alsoused as refrigerants. Ammonia, in particular, is one of themost important refrigerants around, but safety requirementsdo not permit its use in <strong>data</strong> <strong>centers</strong>.The refrigerant market has undergone a major transformationover the past 10-15 years due to ecologicalfactors such as the destruction of the ozone layer and thegreenhouse effect through the emissions of syntheticsubstances. Air conditioning technology is therefore alsoattempting to reduce the amount of refrigerant used insystems to an absolute minimum or to switch to naturalrefrigerants. Here are the most common synthetic refrigerants,all of which belong to the group of alkyl halides:at present, the refrigerant R22 is still in use in manyinstallations. This substance can still be sold for service ormaintenance applications up to 31.12.2009, and followingthat, until 31.12.2014 servicing may still be carried out, butusing the recycled product only. However, it is foreseeablethat by 2010, the last systems using R22 will have to bedecommissioned or at least converted to a different refrigerantwith zero ozone depletion potential.R407C is the most widely used replacement productfor R22. It is a blend of three individual components: 23per cent R32 (difluoromethane CH2F2), 25 per cent R125(pentafluoroethane CHF2CF3), 52 per cent R134A (1,1,1,2tetrafluoroethane CH2FCF3). It is relatively easy to replaceR22 with R407C. R407C has zero ozone depleting potential,but it does have high global warming potential.The operational disadvantages of R407C prompted thechemical industry to develop a substitute in the formof R410A. This is also a mixture and consists of 50 percent R32 (difluoromethane CH2F2) and 50 per cent R125(pentafluorethane CHF2CF3). It is not possible to substituteit for R22 in existing installations however, as coolingcycle pressure levels for R407C are considerably higher.Its global warming potential is slightly lower than that ofR407C.The pure substance R134A is a well-known and widelyused refrigerant. However, as its volumetric coolingcapacity only amounts to approx. 50 – 70 per cent of thatof R22, depending on operating conditions, systems of acomparable size will be correspondingly less <strong>efficient</strong>. Theenvironmental impact in respect of greenhouse gas emissionsis slightly less than that of either R407C or R410A.Carbon dioxide as a cooling mediumAt this point we should like to briefly discuss the use ofcarbon dioxide (R744). Even if, initially, this should seemsomewhat unusual, carbon dioxide does, in fact, constitutean <strong>energy</strong> <strong>efficient</strong> alternative cooling medium.Compared to water, carbon dioxide has a far superiorstorage capacity, which means that pipe diameters can besmaller and less <strong>energy</strong> is required for the transportationof the medium from manufacturer to end-user.The present high investment costs are a disadvantage,which means the larger the installation capacity, themore economic the application.A further drawback to the use of carbon dioxide as acooling medium is the need for high operating pressure23
levels. But the appropriate air-conditioning componentsfor high-pressure systems are already available, so thatcarbon dioxide can also be used in the <strong>data</strong> center.Research carried out by the Swiss Federal Office of Energyhas revealed that between 22°C and 26°C, each degree oftemperature increase will result in a 4% <strong>energy</strong> saving. 13• 5.8 Return air temperatureReturn air temperature11 plays a crucial role in the <strong>energy</strong>consumption of air-cooled rooms. The principle here is:the higher the return air temperature, the more <strong>efficient</strong>lythe system will operate. 12 Even so, allowances must bemade for the <strong>data</strong> center’s IT equipment to ensure that nodamage occurs and the equipment’s operating life is notshortened.A rise in return air temperature automatically involves arise in the temperature of both supply air and room air.Data center airflow must be optimally designed andimplemented if the supply air temperature is to be raised.The hot aisle/cold aisle principle, for example, must bestrictly adhered to, so that there are no air turbulenceswhich a) prevent the cooling air from reaching its intendeddestinations and b) cause a drop in the return airtemperature.Otherwise hot air can recirculate into the cold aisle,causing overheating and hot spots. This usually leads totypical countermeasures such as lowering the supply airtemperature and/or increasing the air volume flow rate –but such actions are not <strong>energy</strong> <strong>efficient</strong>.24
Energy Efficiency in the Data Center6 Optimizing the Energy Supply• 6.1 OverviewAs far as <strong>energy</strong> supply optimization is concerned, theuninterruptible power supply (UPS) plays a vital role inreducing the <strong>energy</strong> consumption of <strong>data</strong> <strong>centers</strong>. TheUPS is an integral part of a <strong>data</strong> center’s power supplyinfrastructure. Because of its back-up character, a UPS willnot provide any “productive” power conversion duringnormal operations. As well as efficiency, the question ofadequate <strong>energy</strong> management security is of particularimportance for UPS systems. Paragraphs 6.2 to 6.7 dealwith the influence of the UPS on a <strong>data</strong> center’s <strong>energy</strong>consumption. They also highlight various different conceptsand specifically address the conflicting objectives ofsecurity and <strong>energy</strong> efficiency.Paragraph 6.8 presents another approach to power supplyoptimization: the use of intelligent power strips. Thesecan be remotely controlled via IP networks and allowintegrated power monitoring.• 6.2 The impact of UPS systems on <strong>data</strong>center <strong>energy</strong> consumption6.2.1 Energy <strong>efficient</strong> power managementwith UPS systemsIf one sees the UPS as a kind of “insurance”, then theelectrical <strong>energy</strong> expended during UPS operation can becompared to the payment of different insurance premiumsfor different benefits – as in third party liability, thirdparty fire and theft and fully comprehensive cover in thefield of automobile insurance. The insured party wouldrather he never had to claim on his insurance, but on theother hand, he doesn’t want to have to face the consequencesif the worst comes to the worst.So the following section will deal with the correlationbetween efficiency and security. An <strong>energy</strong> managementpolicy which is geared solely towards saving electricity isdefinitely falling short of the mark, particularly in the caseof UPS.UPS Type 1 UPS Type 2 UPS Type 3 UPS Type 4 UPS Type 5Real power of the load in kilowatts (kW) 100 100 100 100 100Efficiency of UPS in % 96.0% 94.0% 92.0% 90.0% 88.0%Input power to UPS in kW 104.2 106.4 108.7 111.1 113.6Electrical losses from UPS in kW 4.2 6.4 8.7 11.1 13.6Kilowatt-hours (kWh) per year 36 500 55 915 76 174 97 333 119 455Power costs in EUR per kWh 0.10€ 0.10€ 0.10€ 0.10€ 0.10€Additional costs due to electrical losses 3 650.00€ 5 591.49€ 7 617.39€ 9 733.33€ 11 945.45€per year (without cooling)CoP (Co<strong>efficient</strong> of Performance) for cooling1 460.00€ 2 236.60€ 3 046.96€ 3 893.33€ 4 778.18€(=0.4)kWh per year including cooling 51 100 78 281 106 643 136 267 167 236Additional costs due to electrical losses 5 110.00€ 7 828.09€ 10 664.35€ 13 626.67€ 16 723.64€per year (including cooling)Additional costs over 10 year operational 51 100.00€ 78 280.85€ 106 643.48€ 136 266.67€ 167 236.36€periodAdditional costs due to electrical lossesover 10 years as compared to Type 127 180.85€ 55 543.48€ 85 166.67€ 116 136.36€25
CO2 emissions caused by UPSelectrical losses per yearUPS Type 1 UPS Type 2 UPS Type 3 UPS Type 4 UPS Type 51 kWh electric power = 0.6 kg CO2* 30 660 kg 46 969 kg 63 986 kg 81 760 kg 100 342 kgDifference in CO2 emissions per year as16 309 kg 33 326 kg 51 100 kg 69 682 kgcompared to Type 1Equivalent of driving a Golf-class automobilean annual distance of:70 290 km 143 635 km 220 241 km 300 329 km*Source: International Economic Forum on Regenerative Energies (IWR) – http://www.iwr.de/re/eu/co2/co2.htmlTable 4: Exemplary calculation of UPS power losses and CO2 emissions6.2.2 Impact of UPS performance on<strong>energy</strong> efficiency and CO2 emissionsTable 4 illustrates the importance of UPS performance.The example shows a <strong>data</strong> center with a 100 kW load andelectricity costs of € 0.10 per kWh with a CoP factor of 0.4(Co<strong>efficient</strong> of Performance = a factor representing theadditional cooling performance required to cool electricallosses.) Then the CO2 emissions for the different efficiencylevels are calculated and compared with the CO2 emissionsof an automobile.6.2.3 Power supply in facility managementsecurity requirements. This must be done very early onwhen supply pathways are being planned. This type ofclassification is shown in Table 5.The building’s normal power supply (NPS) is fed in eithervia a direct connection to the national grid (usually up to300 kW at 400 V) or from the medium voltage grid (up to52 kV) via distribution transformers up to 2 MVA. For theback-up power supply (back-up power system BPS), onehas to differentiate between the emergency power supply(EPS) and the uninterruptible power supply (UPS), dependingupon permitted interruption times. This breakdownis shown in Fig. 11.In order to utilize electric power <strong>efficient</strong>ly, it is importantto first classify the electrical loads in terms of theirTypeNormal Power Supply (NPS)Emergency Power Supply (EPS)Uninterruptible Power Supply (UPS)ExampleSupplies all systems and loads present in the buildingSupplies all emergency systems in hazardous situations e.g.:• Emergency lighting• Fire elevators• Fire extinguishing systemsSupplies sensitive loads which must be operated continuously in the event ofGPS failure/disturbance, e.g.:• Servers/computers• Communications equipment• Control systems• Emergency lighting, tunnel lightingTable 5: Types of Power Supply Feed 1426
Energy Efficiency in the Data CenterT-1 T-2 T-3GUSVNPS Load++RPS networkEPS LoadUSV LoadFig. 11: Network structure according to load demands 15Data center air conditioning provides an interestingexample for the importance of the uninterruptible powersupply. Any interruption in the power supply is basicallyno problem for air conditioning equipment, as long asthe emergency power (EP) generator kicks in on schedulewithin 10 to 15 seconds. But problems may arise inthe EP system if the generator fails to start up. If the airconditioning in the computer room breaks down, thecomputers, disk arrays and servers could overheat duringthe shutdown, resulting in severe hardware damage. So itmakes sense to have the air conditioning at least partiallybacked up by the UPS system.• 6.3 Safe, <strong>energy</strong>-<strong>efficient</strong> UPS topologyEach component in the power supply chain to the loadsystem creates procurement and operational costs, eitherthrough losses or for maintenance and monitoring. As thefollowing presentation assumes an uninterruptible powersupply with no breaks (interruption = 0 ms), the supplyvoltage is converted twice by the power electronics ofthe UPS. The rectifier converts the incoming alternatingcurrent into direct current. This can then charge thebattery in the intermediate DC circuit as well as supplyingthe inverter input with the required power during normaloperations. The inverter converts the DC voltage intoclean, stable AC output voltage, which is, in turn, completelyunaffected by disturbances and fluctuations in thesupply voltage. Besides acting as a buffer in the eventof power failure, this so-called double conversion UPSalso provides optimal power quality which it continuallymonitors.Fig. 12 is a schematic showing the components of a typicaldouble conversion UPS with normal operational <strong>energy</strong>losses.However, a <strong>data</strong> center’s <strong>energy</strong> efficiency doesn’t have tosuffer if the following <strong>energy</strong> management configurationfor the air conditioning’s UPS-backup is used. Modern UPSequipment offers the option of using a “digital interactivemode” for air conditioning equipment, via digitalcontrol and a static bypass switch. This means that theair conditioning system can be powered directly from theAC input, bypassing the defective UPS power electronics.When problems occur in the power supply network, UPSmonitoring will ensure that the load is switched to thesafe, standby UPS power path.Input100%95%90%0%EfficiencycommunicationreactorrectifierRsmoothingreactorMfanelectronicsIinverterOutputoutputtransformerFig. 12: Schematic showing a UPS topology and how the componentsinfluence efficiency.27
The requirements for the individual components of a doubleconversion UPS depend to a great extent on the applicationconditions and operational security demands. Theinput power factor should be about 1 to avoid generatorcompatibility issues. This can be achieved through powerfactor correction at the UPS input or by the applicationof so-called IGBTs (Insulated-Gate Bipolar Transistors) inthe UPS rectifier. Possible efficiency losses through powerfactor correction are compensated for by reduced systemperturbations from the IGBT switch. These can affect theinput environment.Thanks to developments in power electronics, it is nowpossible to operate the IGBT inverter without an outputtransformer. This does not impair the quality of theoutput voltage. Apart from avoiding losses in the invertertransformer, it also dispenses with the need for eitherthe galvanic isolation of the battery voltage from theconnected load or the use of a transformer in the outputnetwork configuration. It is therefore eminently advisableto involve specialists at the early stages of consulting andplanning.• 6.4 Redundancy: security and efficiency6.4.1 The conflicting goals of redundancyand <strong>energy</strong> efficiencyEnergy management has to allow for the required levelsof equipment reliability as well as technical constraints.Whereas the schematic illustration in Fig. 12 supplies noinformation on redundancy in the power supply channels,increasing numbers of organisations are engaged inclassifying power infrastructure according to availabilityrequirements. The best known example of this is probablythe American Uptime Institute’s “Tier Classification”system.Fig. 13 shows a Tier IV configuration calculated to deliver99.99 percent availability.MV Main DistributionMV Main DistributionG G G GCoolingTowerCoolingTowerLV Main DistributionLV Main DistributionChillerUPS UPS STSUPS UPSPDU PDU PDUChillerIT ComponentsULKGSTSULKGULKGIT ComponentsULKGIT ComponentsComputer RoomFig. 13: Infrastructure conforming to Uptime Institute’s Tier IV Classification 1628
Energy Efficiency in the Data CenterSimilar classification systems are offered by IEEE (AvailabilityClasses, Class V is the equivalent of 99.999 percent)and the Harvard Research Group (AEC = AvailabilityEnvironment Classification). A clear, concise <strong>data</strong> centerperspective on this subject is provided in two BITKOMpublications 17 : a guide and a planning matrix bothentitled “Reliable Data Centers”, which include designsuggestions for the individual installation components.It is also important to strike the right balance betweensecurity and efficiency when developing redundancyconcepts.The typical efficiency curve for UPS systems (Fig. 14)shows low efficiency under low load conditions and thebest efficiency levels at full load. The main reason for thisis that losses occur even when the system is in standbymode and these occur consistently over the entire loadrange. Proportional losses occur as the load increases.The initial ascent of the efficiency curve should be assteep as possible and then flatten out to a plateau. SomeUPS systems operate most <strong>efficient</strong>ly at loads of between50 and 80 percent.Efficiency [%]97%96%95%94%93%92%91%0 20 40 60 80 100Load [%]Low Mains (380 V)Nom. Mains (400V)High Mains (415 V)Fig. 14: Typical UPS efficiency curve (Low mains: 380 V, Nom. mains: 400 V,High mains: 415 V)When UPS systems are operating in continuous operationmode, it is recommended that they are run at a maximum80 per cent load, to provide reserve capacity for suddenload variations and instant expansion.6.4.2 The different UPS configurationconcepts in comparisonSingle module configurationRightsizing is always a critical factor in single module systems,as they are configured to meet future load requirements.They are often oversized for fear that performancelimits will be met too soon. But this leads to underutilizationand unnecessary losses (see efficiency curve of theselected UPS).Dual module parallel system for N+1 redundancy(also 1+1)This is a configuration for individual unit loads of betweenapprox. 20 kVA /kW and 250 kVA /kW, as it offersbetter availability than single module systems. As withthe single module set-up, this system configuration is alsosized to allow for future maximum loads, but with theadded constriction that each module must stay below50% load if the redundancy concept is to be properlyimplemented.Multiple UPS modules operating in parallel for N+1redundancyThis set-up is for individual unit loads of between about20 kVA/kW and 1000 kVA/kW, as it offers better scalabilitythan dual module parallel systems. In this systemconfiguration, an external maintenance bypass switch,sized to meet the desired maximum load and with thecorresponding number of UPS connections, makes itpossible to connect the required number of UPS modulesto meet the momentary load and redundancy level. Whenload demands increase, one or more UPS modules can beadded without compromising normal operations.This ensures better utilization rates than with 1+1 configurationand the UPS systems can be operated with fewer<strong>energy</strong> losses.Modular UPS systems with power modules inparallel mode for N+1 redundancyThis set-up has capacity ratings of between about 10 kVA/kW and 200 kVA/kW per individual module and thusoffers better scalability than two or more UPS systemsin parallel operation. The system framework of modular29
UPS systems is designed to meet the desired maximumfinal load. UPS capacity can be increased during operationwithout the need for an external bypass switch withmultiple UPS connections. Multiple power modules canbe operated in parallel, thus increasing individual moduleutilization levels and reducing power losses during UPSoperation.Two independently operated USV systems for 2NredundancyThis is a high availability redundancy concept with twoseparate, independent, fully maintainable power distributionsystems (dual bus system). As far as utilization isconcerned, this configuration displays identical characteristicsto the dual module parallel system for N+1redundancy (also 1+1).The following table presents some further redundancyconcepts and the possible utilization levels of individualUPS systems and power modules.Redundancy Level N N+1 N+1 N+1 N+1Configuration 1 1+1 2+1 3+1 4+1Number of UPS 1 2 3 4 5% Utilization per 100 50 66 75 80UPSRedundancy Level 2N 2(N+1) 2(N+1) 2(N+1) 2(N+1)Configuration 2 2(1+1) 2(2+1) 2(3+1) 2(4+1)Number of UPS 2 4 6 8 10% Utilization perUPS50 25 33 37,5 40Table 6: Utilization of UPS systems in different redundancy scenarios(permissible maximum capacities in compliance with redundancyclasses)• 6.5 Load characteristics, performancecategory and semiconductor componentsThe influence of the load on efficiency is reflected notonly in performance levels, but also in the requiredvoltage waveform. Connected PSUs in servers, PCs or harddisk arrays for example, can cause a phase shift betweencurrent and voltage which is denoted by the load powerfactor. Harmonics can contribute to the non-linear characteristicsof the load. A comparison of the influence ofnon-linear loads and linear (ohmic) loads is shown as aschematic diagram in Fig. 15.Eifficiency98%96%94%92%90%Linear loadNon-linear load0% 25% 50% 75% 100%Relative output efficiency in 100%Fig. 15: UPS efficiency as a function of load exploitation for linear andnon-linear loads 18It is also the case for UPS that, assuming the same technologyand classification, losses from more powerful unitsare easier to reduce that those from the small units. Themore compact they need to be, the more action <strong>needs</strong> tobe taken as far as heat management is concerned.The efficiency statistics provide valuable guidance for UPSsystem planning as they complement the UPS classifications,but because of the highly complex relationship betweentechnology, operations, security, ambient conditionsand disturbance reactions, they should never serve as thesole assessment criteria.In<strong>efficient</strong> components mean an increase in waste heat,resulting in the need for additional heat control, possibleinvolving the implementation of more or larger fans. Anotheradvantage of larger capacity UPS modules is that athree-phase network can supply 400 V as opposed to thesingle phase AC voltage of 230 V. Furthermore, in the fieldof UPS technology, there have been continual developmentsin power semiconductors and control engineering30
Energy Efficiency in the Data Centerover the past 40 years. A significant step forward, apartfrom materials development in metals, semiconductorsand synthetics, has been the transition from thyristors totransistors and then to IGBT transistors for inverter powercomponents (Fig. 16).Efficiency95%90%85%IGBT80%TransistorThyristor80’s Technology75%0% 25% 50% 75% 100%Relative output efficiency 100%Increased semiconductor switching frequency, the introductionof real-time control and finally modern vectorcontrol systems have all had a favourable effect on thequality of the load voltage and the reduction of losses.• 6.6 Current developments in UPSefficiencyManufacturers of UPS equipment are cooperating withthe EU to produce a directive which will harmonizeefficiency assessment and functional requirements forUPS systems. The short-term result is a common code ofconduct which sets targets for UPS efficiency levels asfrom 2008 20 .The European norm EN 62040-3 forms the basis for theclassification of UPS equipment and the definition ofevaluation requirements.Fig. 16: UPS efficiency as a function of load exploitation for differentelectronic components 19Table 7 shows the planned CoC proposals for the variousdifferent UPS classifications for different load and UPSperformance categories.Although higher power densities demand special types ofcooling, they also offer considerable advantages in termsof installation size and performance related losses.Efficiency in normal modewith non-linear loadaccording to EN62040-3 at:UPS Output Power≥ 10 to < 20 kVAUPS Output Power≥ 20 to < 40 kVAClass./1/ Class./2/ Class./3/ Class./1/ Class./2/ Class./3/25% of nominal power 83.0% 88.0% 93.0% 84.0% 88.5% 93.5%50% of nominal power 89.0% 92.0% 95.0% 89.5% 92.5% 95.5%75% of nominal power 90.5% 92.5% 95.7% 91.0% 93.0% 96.3%100% of nominal power 91.0% 92.5% 96.0% 91.5% 93.0% 96.5%31
UPS Output Power≥ 40 to < 200 kVAUPS Output Power≥ 200 kVAClass./1/ Class./2/ Class./3/ Class./1/ Class./2/ Class./3/25% of nominal power 86.5% 89.0% 94.0% 89.0% 91.5% 95.0%50% of nominal power 90.5% 93.0% 96.0% 92.0% 94.5% 97.0%75% of nominal power 92.0% 93.5% 96.7% 93.0% 94.5% 97.7%100% of nominal power 92.0% 93.5% 97.0% 93.0% 94.5% 98.0%Notes:Class./1/:UPS types “VFI – S.-…” according to EN62040-3Class./2/: all UPS types “VI” and “VFI” according to EN62040-3, except “VFI – S.-…”Class./3/: all UPS types “VFD” according to EN62040-3Table 7: UPS efficiency targets according to the CoC for UPS 21The stipulations for additional components with efficiency-reducingeffects should also be taken into consideration,as these effects are not always clearly recognizablein the UPS category. Voltage quality and security arecritical factors when these components are used in UPSapplications. The list currently specifies additional transformersfor UPS modules and filters for the reduction ofharmonic distortions.Normal Mode:Load according toEN62040-3Additional devices for the reduction of harmonic currentsat input better than IEC 61000-2-2, 61000-3-2 and61000-3-12The measured losses of these can be deducted from thesystem losses and shall not exceed the given values perdevice25% 0.6%50% 1.0%75% 1.6%100% 2.5%Normal Mode:Load according toEN62040-3Additional isolation transformer at input or output of thenormal mode power pathMaximum losses per transformer (in kVA)≥ 10 to < 40 ≥ 40 to < 200 ≥ 200 to < 500 ≥ 50025% of nominal transformer power 1.5% 1.0% 0.7% 0.5%50% of nominal transformer power 1.9% 1.5% 1.1% 0.7%75% of nominal transformer power 2.6% 2.0% 1.7% 1.3%100% of nominal transformer power 3.6% 3.2% 2.7% 2.0%Table 8: The influence of additional UPS components on efficiency according to CoC for UPS 2232
Energy Efficiency in the Data Center• 6.7 Balancing <strong>energy</strong> efficiency, securityand qualityforgo the weekly battery test which then has to be carriedout with a manual meter?As the previous sections have shown, UPS modules haveto satisfy a whole range of different requirements. Toconclude this topic, we now present a few considerationson the different UPS component requirements which alsoaffect UPS <strong>energy</strong> consumption.For example, in the UPS configuration shown in Fig. 12,various different input filter design alternatives are possible.Normally the aim is for the lowest possible interferencewith the network installation environment in thevicinity of the UPS. Electric drives and motors, for example,can experience interference from circuit feedback causedby the UPS. Passive or active filters, the use of differentrectifiers such as six or twelve-pulse bridge circuits withdiode components or IGBT transistor technology can leadto diverging filter effects and to various intrinsic UPS<strong>energy</strong> losses.Another UPS parameter is the voltage range within whichthe rectifier can supply the inverter with power withouthaving to switch to battery operation. If this is moregenerously configured it can mean that UPS efficiencyis reduced during normal operation. But as the batteriesdo not need to be discharged and charged so often, theoverall <strong>energy</strong> footprint may be more favourable in thelong run. The rectifier is normally also utilized for chargingthe battery and so it should be adequately dimensioned.Great attention should be paid to battery charging andmonitoring to ensure that the battery packs are treatedwith the greatest possible care. This has now becomesuch a complex process that it has not yet been incorporatedinto the efficiency analysis. A battery managementsystem which is optimally adjusted to the type of batteryin operation and which monitors the status of the batterypacks is able to give adequate warning should problemsoccur.All electronic monitoring and control systems requireelectrical <strong>energy</strong>. But does it make sense to do withoutinput level monitoring or fan control in order to saveelectricity at normal full capacity operation, or perhapsCommunication interfaces and equipment displays suchas LCD and LED also require <strong>energy</strong>. Even the EMC componentsin the UPS which minimize interference withinthe UPS and in its immediate environment, affect efficiencylevels. EMC requirements will be dictated essentiallyby the UPS installation location. Another way of minimizing<strong>energy</strong> losses would be to dispense with the electronicbypass switch. But the lack of an electronic bypasswould show up negatively in a reliability calculation. 23There have also been significant developments in thefield of inverter technology. Modern power technologiesperform at high switching frequencies and provide cleanoutput voltage without the need for an inverter transformer.This would make it possible to improve efficiency bybetween one and three per cent, but security-conscioususers value the inverter transformer because it providesgalvanic isolation between the connected load and a DCcharge in case of an inverter fault. The so-called transformerlessUPS modules have a <strong>protection</strong> system whichbecomes operative when DC components are present inthe UPS output voltage.• 6.8 Rackmount intelligent power stripsAs well as the different alternatives for optimizing the<strong>energy</strong> efficiency of the UPS systems themselves, thereis also the option of using “intelligent” power strips, socalled Smart PowerStrips (SPS) which save <strong>energy</strong> on the power supply side.Unlike previous power strips which were only used toaccommodate plugs, these SPS feature several characteristicfunctions: simple Plug and Play, modular designand easy access to different circuits. In addition, thesepower strips offer remote control over IP networks and anintegrated monitoring function. To cater for the stringentrequirements of <strong>data</strong> center operations, special solutionswith adapted housing and different current capacitieshave been developed.33
There are two basic construction design types which aretypically used in the rack:• 19” 1U or 2U (8 ports, up to 16 ports),• vertical power strips which attach to the side of therack (12 ports, 20 ports)(e.g. serial RS232, partially Ethernet) which enables thecontrolled start-up of devices. The power strips are typicallycontrolled via a KVM switch which also facilitatesthe grouping and assigning of individual outlets to theconnected devices (e.g. servers).From a functional point of view the power strips areavailable in three categories:• passive power strips for IT environments• switchable power strips with control input• intelligent power strips with control input and monitoringfunctionsPassive power strips for IT environmentsWith simple models it is important to make sure thatthe strip has an adequate number of power outlets (for‘Schuko’ or rubber connectors), as well as high qualitymechanical characteristics. The use of power strips withon-off switches is not to be recommended as the risk ofaccidental shutoff through mechanical contact is far toogreat. There is also a model with integrated surge <strong>protection</strong>available. This helps avoid malfunctions caused bytemporary voltage spikes. The main disadvantages of thesimple models are the unavoidable start-up peaks (whenall loads are switched on simultaneously), the absence ofeither on/off control or consumption monitoring.Switchable power strips with control inputA more advanced development of the first categorycomprises switchable power strips with a control inputIntelligent power strips with monitoring functionsAs well as their switching function, the latest generationof power strips offer power consumption monitoring(overall consumption and individual outlet measurements)to provide you with an accurate overall pictureof your <strong>data</strong> center’s <strong>energy</strong> consumption and efficiency.Here it is important that individual measurements betaken at each power outlet in order to ascertain the exactload distribution in the rack and if necessary to determinethe best spatial positioning in the <strong>data</strong> center for newservers. This can also form a basis for the optimization ofcooling and air-conditioning systems.The measured <strong>data</strong> can be read out using a monitoringtool via Ethernet and SNMP and recorded as a trend.Following this you then have option of analyzing theindividual loads within the framework of a statementof costs. This allows the individual allocation of costs perload (e.g. calculation of <strong>energy</strong> costs per section or server).Intelligent power strips also offer other functions suchas environmental monitoring (temperature, humidity)adjustable thresholds (e.g. power) with alarm functions(notification via e-mail or SNMP).34
Energy Efficiency in the Data CenterCategory Application in Advantages DisadvantagesPassive power strips Simple installations • cost price• no control features• start-up peaks• no meteringSwitchable power stripsData <strong>centers</strong> with servermanagement• switch function delaysserver start-upIntelligent power strips Energy <strong>efficient</strong> <strong>data</strong> <strong>centers</strong> • allows full control ofequipment and <strong>energy</strong>consumption• suitable for standaloneapplications• no consumptionmeasurement• usually only in combinationwith a KVM switchor console server• cost priceTable 9: Power strip overview35
7 Energy ContractingCooling and power supply management constitutechallenging tasks for <strong>data</strong> center operators. One way inwhich the burden on the organisation can be relievedwith respect to this task is <strong>energy</strong> contracting. Purchasing<strong>energy</strong> via a third party (contractor) can offer variousadvantages for suitable clients (contractees). For example,clients don’t need to invest in the <strong>energy</strong> system, and thisreleases funds for investment elsewhere.The contracting company’s services usually includeconsultancy, planning, financing and the operation of<strong>energy</strong> systems. In addition they take over the purchaseof electric power, as well as gas, oil, district heating ordistrict cooling at favourable market conditions on thebasis of negotiated mid and long term supply contracts.The contractor offers professional <strong>energy</strong> managementservices and is in a position to guarantee the availabilitylevels required by a modern <strong>data</strong> center. The contractoris also able to utilize the available potential to reduce<strong>energy</strong> consumption and operational pollutant emissions.Comprehensive maintenance and repair guaranteesare also often included in an <strong>energy</strong> contractor’s serviceportfolio.To sum up we can identify the following potentialadvantages for contractees:• Less pressure for facility management and IT departments.The contractor assumes responsibility forcoordination and execution of the tasks.• No investment expenditure: results in a freeing up offinancial capital for other projects; increased liquidity.• Increased supply security.• Application of <strong>efficient</strong> and <strong>energy</strong>-savingtechnologies.• Effective <strong>energy</strong> monitoring.• Support for internal and external cost allocation.• Regular maintenance and servicing of the system.• Cost benefits and synergy effects arise when the contractorhandles purchase, planning and installation ofthe system. These effects can also occur to a certainextent through in-house production of electricity,heat, cooling and the <strong>efficient</strong> utilization of wasteheat.• In some cases, the value of the property may even beincreased by the implementation of state-of-the-arttechnologies.Thanks to its size, experience and specialist competence,the contracting company is able to take measures toexploit the available ecological and economic potential– a task for which the <strong>data</strong> center operator often has noavailable human or financial resources.36
Energy Efficiency in the Data CenterEndnotes1.2.3.4.5.6.7.8.9.10.11.12.13.14.15.16.17.18.19.20.21.22.23.This guide thus complements the BITKOM guide “Reliable Data Centers” and the matrix “Planungshilfe Betriebssicheres Rechenzentrum” (Planning aidfor reliable <strong>data</strong> <strong>centers</strong>) which can be downloaded free of charge from the BITKOM website. However, both guides and planning aid are no substitute forexpert advice and support from competent consultants and planners.Fichter, Klaus: Zukunftsmarkt energieeffiziente Rechenzentren. Study carried out on behalf of the Federal Environment Ministry (BMU);(Borderstep Institute); 2007Fichter, Klaus: Zukunftsmarkt energieeffiziente Rechenzentren. Study carried out on behalf of the Federal Environment Ministry (BMU);(Borderstep Institute); 2007US EPA (U.S. Environmental Protection Agency, Energy Star Program): Report to Congress on Server and Data Center Energy Efficiency, Public Law 109-431,2007The Green Grid: GREEN GRID METRICS: Describing Datacenter Power Efficiency. Technical Committee White Paper, February 20, 2007Brill, Kenneth G.: Data Center Energy Efficiency and Productivity, White Paper, The Uptime Institute, 2007ASHRAE, Thermal Guidelines for Data Processing Environments; 2004A unit’s sensible cooling capability is its performance in cooling the air without dehumidifying it.Strictly speaking, it is the ratio between air volume and heat exchanger surface area which <strong>needs</strong> to be optimized. A large heat exchanger surface arearequires a sufficient volume of air.Although water is frequently used as a cooling medium, it has not proven itself for application as a coolant in <strong>data</strong> center environments.Return air temperature is only significant when <strong>data</strong> <strong>centers</strong> are air-cooled. In installations where all the server racks are water-cooled, for example, theroom air temperature and thus the return air temperature, too, are of no consequence for a <strong>data</strong> center’s <strong>energy</strong> efficiency. In such cases more attentionshould be paid to temperatures in the racks’ water system.As mentioned above, another advantage of higher return air temperatures is the higher temperature spread which is possible when water is used as acoolant. An increased spread allows higher operational temperatures on the recooling side and this makes free cooling possible, even at higher outdoortemperatures. The longer free cooling is used, the less <strong>energy</strong> is needed for the operation of compressors.Swiss Federal Office of Energy: Risokofreier Betrieb von klimatisierten EDV-Räumen bei 26° C Raumtemperatur (Risk-free operation of air-conditionedcomputer rooms at room temperatures of 26° C), Bern 1995Totally Integrated Power: Applikationshandbuch – Grundlagenermittlung und Vorplanung (Application Manual - Basic Data and Preliminary Planning),Siemens AG; 2006Totally Integrated Power: Applikationshandbuch – Grundlagenermittlung und Vorplanung (ApplicationManual - Basic Data and Preliminary Planning),Siemens AG; 2006Uptime-Institute: www.uptimeinstitute.orgBoth publications can be downloaded free of charge from the BITKOM websiteHigh performance buildings: Data <strong>centers</strong> uninterruptible power supplies (EPRI-Solutions, Ecos Consulting); 2005Swiss Federal Office of Energy: Program “Electricity” Code of Conduct / Label for Uninterruptible Power Supplies (UPS); 2005Code of Conduct on Energy Efficiency and Quality of AC Uninterruptible Power Systems; 2006Code of Conduct on Energy Efficiency and Quality of AC Uninterruptible Power Systems; 2006Code of Conduct on Energy Efficiency and Quality of AC Uninterruptible Power Systems; 2006White Paper: The classifications define site infrastructure performance (The Uptime Institute Inc.); 2001-200637
8 Glossary19“-CabinetBPSBrineChillerCPUCRACCWData CenterDXEMCEmissionEPSEUHot spotsIICTIGBTILMImmissionITKVM switchLV main distributionModularMV main distributionNPSParallel operationPower distributionPrecision air conditionerPSURRedundantScalableSNMPSPSPSSTSSurge <strong>protection</strong> conceptTCOUPSRack with approx. 40 U, overall height approx. 2 metres, installation width 483 mm, installationheight is measured in rack units (U), 1 U = 44.45mmback-up power systemwater/glycol mixturewater cooled unitcentral processing unitcomputer room air conditioningchilled water; air-conditioning units which use cold waterserver room and /or <strong>data</strong> centerdirect expansion; refrigerant-type air conditioning unitselectromagnetic compatibilitythe release of substances into the atmosphere from a resource or processemergency power supplyelectric utilitylocal overheatinginverterinformation and communication technologynsulated gate bipolar transistorinformation lifecycle managementthe reception of material, such as pollutants, by the environment from any sourceinformation technologykeyboard-video-mouse switchlow voltage main distributiona system constructed of several individual units (sub-assemblies)medium voltage main distributionnormal power supplytwo or more UPS units which combine to supply the connected loadsalso main LV distribution panel (LVDP) or PDU (power distribution unit)air conditioning unit which can maintain both temperature and humidity at constant levelspower supply unitrectifiermultiple configuration for increasing availability (fault tolerance)capable of adapting to demandsimple network management protocolsub panelsmart (“intelligent”) power stripsstatic transfer switch / static transfer systemconventional overvoltage <strong>protection</strong> includes coarse, medium and fine <strong>protection</strong>total cost of ownershipuninterruptible power supply38
Energy Efficiency in the Data Center10 AcknowledgementsThis guide to “Energy Efficiency in the Data Center“ has been produced in consultation with the BITKOM Working Group on“Fail-safe Computer Centres & Infrastructure”.We would like to express our sincere thanks to all members of the Working Group for their valuable discussions and suggestions,as well as to the following individuals for their contributions and comments:••••••••••••••••••Dr. Wolfgang Gnettner (Fujitsu Siemens Computers <strong>GmbH</strong>)Frank Hauser (Raritan Deutschland <strong>GmbH</strong>)Dieter Henze (Rittal <strong>GmbH</strong> & Co. KG)Robert Horn (KKT Kraus Kälte und Klimatechnik <strong>GmbH</strong>)Dr. Siegbert Hopf (Masterguard <strong>GmbH</strong>)Eberhard Knödler (Brach + Moll Kälte und Klimatechnik <strong>GmbH</strong>)Stephan Lang (Weiss Klimatechnik <strong>GmbH</strong>)Achim Pfleiderer (<strong>Stulz</strong> <strong>GmbH</strong>)Dr. Georg Riegel (deZem <strong>GmbH</strong>)Staffan Reveman (Newave USV Systeme <strong>GmbH</strong>)Christian Richter (Emerson Network Power <strong>GmbH</strong>)Michael Schumacher (APC Deutschland <strong>GmbH</strong>)Judith Wagener (Bull <strong>GmbH</strong>)Manfred Willnecker (Knürr AG)Ingolf Wittmann (IBM Deutschland <strong>GmbH</strong>)Ralph Wölpert (Lampertz <strong>GmbH</strong> & Co. KG)Eckhard Wolf (AEG Power Supply Systems <strong>GmbH</strong>)Carsten Zahn (Schnabel AG)Our very special thanks to Harry Schnabel (Schnabel AG), head of the Working Group.39
The German Association for Information Technology, Telecommunications and New Media (BITKOM) representsover 1,200 companies. Its more than 900 direct members generate a sales volume of 135 billion euros annuallyand employ 700,000 people. They include providers of software, IT and telecommunication services, manufacturersof hardware and consumer electronics as well as digital media enterprises. BITKOM is committed inparticular to an improved regulatory framework, a modernized education system and an innovation orientedeconomic policy.This translation was kindly sponsored by the following companies:SCHNABEL AG ®German Association for Information Technology,Telecommunications and New MediaAlbrechtstraße 10 A10117 Berlin-MitteTel.: +49.3o.27576-0Fax: +49.30.27576-400bitkom@bitkom.orgwww.bitkom.org