AP Biology Summer Packet
AP Biology Summer Packet
AP Biology Summer Packet

Create successful ePaper yourself
Turn your PDF publications into a flip-book with our unique Google optimized e-Paper software.
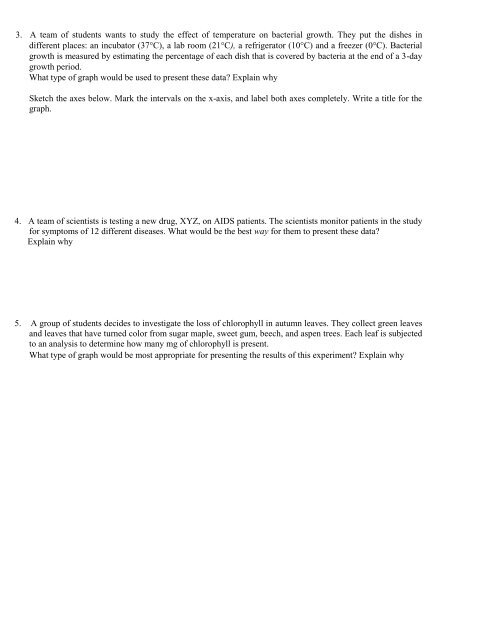
3. A team of students wants to study the effect of temperature on bacterial growth. They put the dishes indifferent places: an incubator (37°C), a lab room (21°C), a refrigerator (10°C) and a freezer (0°C). Bacterialgrowth is measured by estimating the percentage of each dish that is covered by bacteria at the end of a 3-daygrowth period.What type of graph would be used to present these data? Explain whySketch the axes below. Mark the intervals on the x-axis, and label both axes completely. Write a title for thegraph.4. A team of scientists is testing a new drug, XYZ, on AIDS patients. The scientists monitor patients in the studyfor symptoms of 12 different diseases. What would be the best way for them to present these data?Explain why5. A group of students decides to investigate the loss of chlorophyll in autumn leaves. They collect green leavesand leaves that have turned color from sugar maple, sweet gum, beech, and aspen trees. Each leaf is subjectedto an analysis to determine how many mg of chlorophyll is present.What type of graph would be most appropriate for presenting the results of this experiment? Explain why