AP Biology Summer Packet
AP Biology Summer Packet
AP Biology Summer Packet

You also want an ePaper? Increase the reach of your titles
YUMPU automatically turns print PDFs into web optimized ePapers that Google loves.
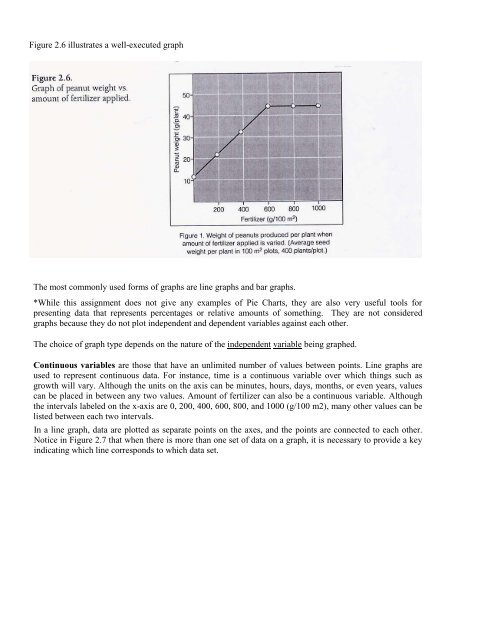
Figure 2.6 illustrates a well-executed graphThe most commonly used forms of graphs are line graphs and bar graphs.*While this assignment does not give any examples of Pie Charts, they are also very useful tools forpresenting data that represents percentages or relative amounts of something. They are not consideredgraphs because they do not plot independent and dependent variables against each other.The choice of graph type depends on the nature of the independent variable being graphed.Continuous variables are those that have an unlimited number of values between points. Line graphs areused to represent continuous data. For instance, time is a continuous variable over which things such asgrowth will vary. Although the units on the axis can be minutes, hours, days, months, or even years, valuescan be placed in between any two values. Amount of fertilizer can also be a continuous variable. Althoughthe intervals labeled on the x-axis are 0, 200, 400, 600, 800, and 1000 (g/100 m2), many other values can belisted between each two intervals.In a line graph, data are plotted as separate points on the axes, and the points are connected to each other.Notice in Figure 2.7 that when there is more than one set of data on a graph, it is necessary to provide a keyindicating which line corresponds to which data set.