AP Biology Summer Packet
AP Biology Summer Packet
AP Biology Summer Packet

You also want an ePaper? Increase the reach of your titles
YUMPU automatically turns print PDFs into web optimized ePapers that Google loves.
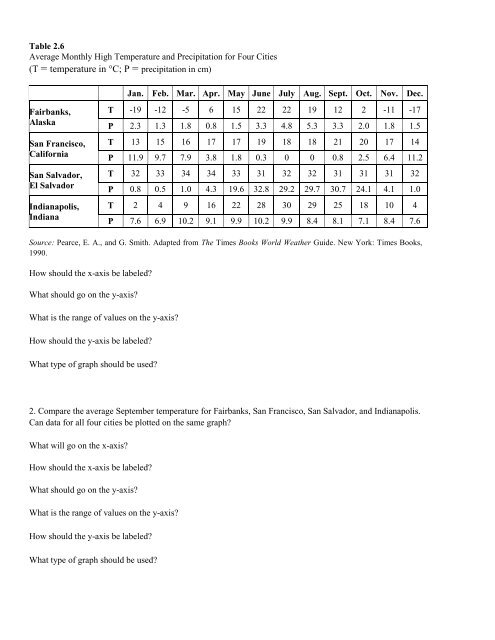
Table 2.6Average Monthly High Temperature and Precipitation for Four Cities(T = temperature in °C; P = precipitation in cm)Jan. Feb. Mar. Apr. May June July Aug. Sept. Oct. Nov. Dec.Fairbanks,AlaskaSan Francisco,CaliforniaSan Salvador,El SalvadorIndianapolis,IndianaT -19 -12 -5 6 15 22 22 19 12 2 -11 -17P 2.3 1.3 1.8 0.8 1.5 3.3 4.8 5.3 3.3 2.0 1.8 1.5T 13 15 16 17 17 19 18 18 21 20 17 14P 11.9 9.7 7.9 3.8 1.8 0.3 0 0 0.8 2.5 6.4 11.2T 32 33 34 34 33 31 32 32 31 31 31 32P 0.8 0.5 1.0 4.3 19.6 32.8 29.2 29.7 30.7 24.1 4.1 1.0T 2 4 9 16 22 28 30 29 25 18 10 4P 7.6 6.9 10.2 9.1 9.9 10.2 9.9 8.4 8.1 7.1 8.4 7.6Source: Pearce, E. A., and G. Smith. Adapted from The Times Books World Weather Guide. New York: Times Books,1990.How should the x-axis be labeled?What should go on the y-axis?What is the range of values on the y-axis?How should the y-axis be labeled?What type of graph should be used?2. Compare the average September temperature for Fairbanks, San Francisco, San Salvador, and Indianapolis.Can data for all four cities be plotted on the same graph?What will go on the x-axis?How should the x-axis be labeled?What should go on the y-axis?What is the range of values on the y-axis?How should the y-axis be labeled?What type of graph should be used?