AP Biology Summer Packet
AP Biology Summer Packet
AP Biology Summer Packet
Create successful ePaper yourself
Turn your PDF publications into a flip-book with our unique Google optimized e-Paper software.
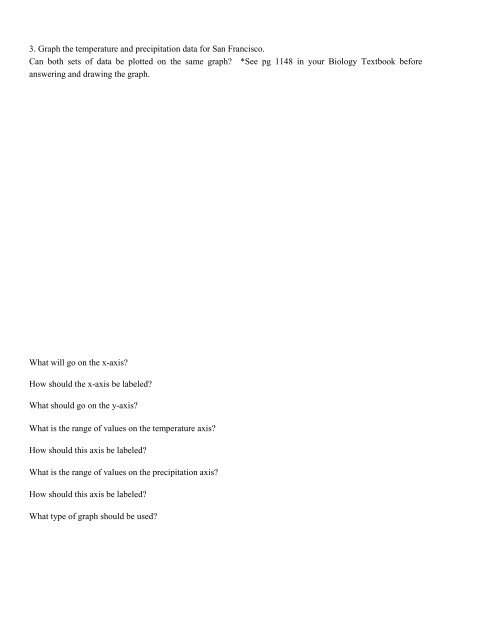
3. Graph the temperature and precipitation data for San Francisco.Can both sets of data be plotted on the same graph? *See pg 1148 in your <strong>Biology</strong> Textbook beforeanswering and drawing the graph.What will go on the x-axis?How should the x-axis be labeled?What should go on the y-axis?What is the range of values on the temperature axis?How should this axis be labeled?What is the range of values on the precipitation axis?How should this axis be labeled?What type of graph should be used?


