Aspen-Pitkin County Airport Greenhouse Gas Emissions Inventory ...
Aspen-Pitkin County Airport Greenhouse Gas Emissions Inventory ...
Aspen-Pitkin County Airport Greenhouse Gas Emissions Inventory ...
Create successful ePaper yourself
Turn your PDF publications into a flip-book with our unique Google optimized e-Paper software.
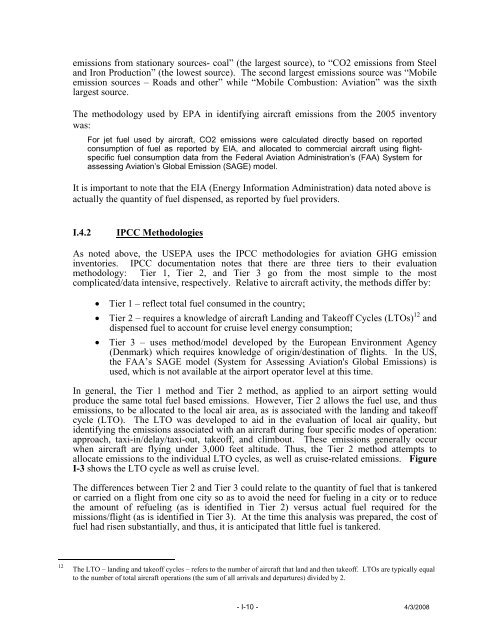
emissions from stationary sources- coal” (the largest source), to “CO2 emissions from Steeland Iron Production” (the lowest source). The second largest emissions source was “Mobileemission sources – Roads and other” while “Mobile Combustion: Aviation” was the sixthlargest source.The methodology used by EPA in identifying aircraft emissions from the 2005 inventorywas:For jet fuel used by aircraft, CO2 emissions were calculated directly based on reportedconsumption of fuel as reported by EIA, and allocated to commercial aircraft using flightspecificfuel consumption data from the Federal Aviation Administration’s (FAA) System forassessing Aviation’s Global Emission (SAGE) model.It is important to note that the EIA (Energy Information Administration) data noted above isactually the quantity of fuel dispensed, as reported by fuel providers.I.4.2IPCC MethodologiesAs noted above, the USEPA uses the IPCC methodologies for aviation GHG emissioninventories. IPCC documentation notes that there are three tiers to their evaluationmethodology: Tier 1, Tier 2, and Tier 3 go from the most simple to the mostcomplicated/data intensive, respectively. Relative to aircraft activity, the methods differ by:• Tier 1 – reflect total fuel consumed in the country;• Tier 2 – requires a knowledge of aircraft Landing and Takeoff Cycles (LTOs) 12 anddispensed fuel to account for cruise level energy consumption;• Tier 3 – uses method/model developed by the European Environment Agency(Denmark) which requires knowledge of origin/destination of flights. In the US,the FAA’s SAGE model (System for Assessing Aviation's Global <strong>Emissions</strong>) isused, which is not available at the airport operator level at this time.In general, the Tier 1 method and Tier 2 method, as applied to an airport setting wouldproduce the same total fuel based emissions. However, Tier 2 allows the fuel use, and thusemissions, to be allocated to the local air area, as is associated with the landing and takeoffcycle (LTO). The LTO was developed to aid in the evaluation of local air quality, butidentifying the emissions associated with an aircraft during four specific modes of operation:approach, taxi-in/delay/taxi-out, takeoff, and climbout. These emissions generally occurwhen aircraft are flying under 3,000 feet altitude. Thus, the Tier 2 method attempts toallocate emissions to the individual LTO cycles, as well as cruise-related emissions. FigureI-3 shows the LTO cycle as well as cruise level.The differences between Tier 2 and Tier 3 could relate to the quantity of fuel that is tankeredor carried on a flight from one city so as to avoid the need for fueling in a city or to reducethe amount of refueling (as is identified in Tier 2) versus actual fuel required for themissions/flight (as is identified in Tier 3). At the time this analysis was prepared, the cost offuel had risen substantially, and thus, it is anticipated that little fuel is tankered.12The LTO – landing and takeoff cycles – refers to the number of aircraft that land and then takeoff. LTOs are typically equalto the number of total aircraft operations (the sum of all arrivals and departures) divided by 2.- I-10 - 4/3/2008


