Aspen-Pitkin County Airport Greenhouse Gas Emissions Inventory ...
Aspen-Pitkin County Airport Greenhouse Gas Emissions Inventory ...
Aspen-Pitkin County Airport Greenhouse Gas Emissions Inventory ...

You also want an ePaper? Increase the reach of your titles
YUMPU automatically turns print PDFs into web optimized ePapers that Google loves.
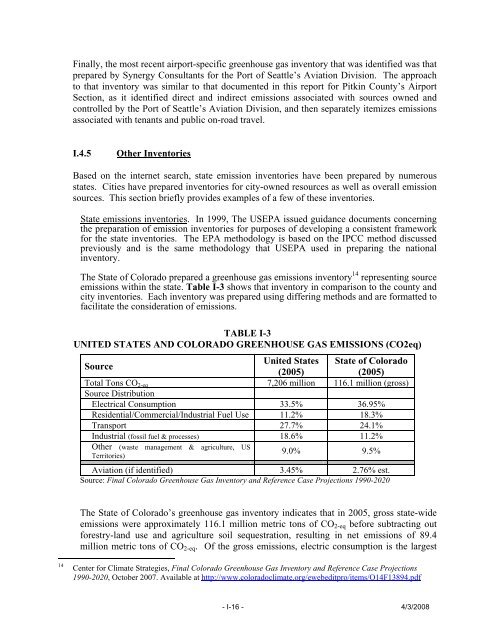
Finally, the most recent airport-specific greenhouse gas inventory that was identified was thatprepared by Synergy Consultants for the Port of Seattle’s Aviation Division. The approachto that inventory was similar to that documented in this report for <strong>Pitkin</strong> <strong>County</strong>’s <strong>Airport</strong>Section, as it identified direct and indirect emissions associated with sources owned andcontrolled by the Port of Seattle’s Aviation Division, and then separately itemizes emissionsassociated with tenants and public on-road travel.I.4.5Other InventoriesBased on the internet search, state emission inventories have been prepared by numerousstates. Cities have prepared inventories for city-owned resources as well as overall emissionsources. This section briefly provides examples of a few of these inventories.State emissions inventories. In 1999, The USEPA issued guidance documents concerningthe preparation of emission inventories for purposes of developing a consistent frameworkfor the state inventories. The EPA methodology is based on the IPCC method discussedpreviously and is the same methodology that USEPA used in preparing the nationalinventory.The State of Colorado prepared a greenhouse gas emissions inventory 14 representing sourceemissions within the state. Table I-3 shows that inventory in comparison to the county andcity inventories. Each inventory was prepared using differing methods and are formatted tofacilitate the consideration of emissions.TABLE I-3UNITED STATES AND COLORADO GREENHOUSE GAS EMISSIONS (CO2eq)SourceUnited States State of Colorado(2005)(2005)Total Tons CO 2-eq 7,206 million 116.1 million (gross)Source DistributionElectrical Consumption 33.5% 36.95%Residential/Commercial/Industrial Fuel Use 11.2% 18.3%Transport 27.7% 24.1%Industrial (fossil fuel & processes) 18.6% 11.2%Other (waste management & agriculture, USTerritories)9.0% 9.5%Aviation (if identified) 3.45% 2.76% est.Source: Final Colorado <strong>Greenhouse</strong> <strong>Gas</strong> <strong>Inventory</strong> and Reference Case Projections 1990-2020The State of Colorado’s greenhouse gas inventory indicates that in 2005, gross state-wideemissions were approximately 116.1 million metric tons of CO 2-eq before subtracting outforestry-land use and agriculture soil sequestration, resulting in net emissions of 89.4million metric tons of CO 2-eq . Of the gross emissions, electric consumption is the largest14Center for Climate Strategies, Final Colorado <strong>Greenhouse</strong> <strong>Gas</strong> <strong>Inventory</strong> and Reference Case Projections1990-2020, October 2007. Available at http://www.coloradoclimate.org/ewebeditpro/items/O14F13894.pdf- I-16 - 4/3/2008