Department of Justice - Department of Business - Northern Territory ...
Department of Justice - Department of Business - Northern Territory ...
Department of Justice - Department of Business - Northern Territory ...
- No tags were found...

You also want an ePaper? Increase the reach of your titles
YUMPU automatically turns print PDFs into web optimized ePapers that Google loves.
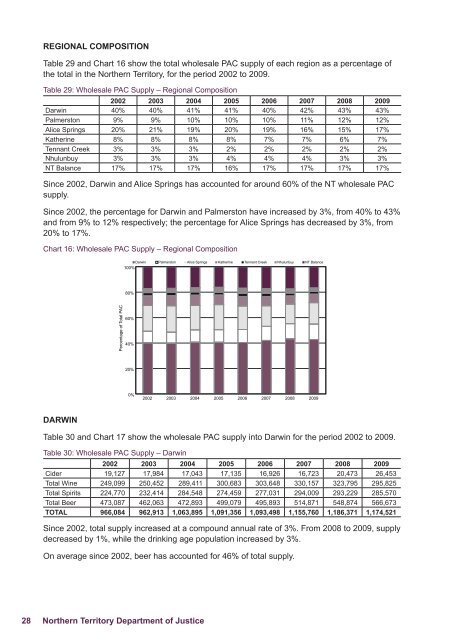
REGIONAL COMPOSITIONTable 29 and Chart 16 show the total wholesale PAC supply <strong>of</strong> each region as a percentage <strong>of</strong>the total in the <strong>Northern</strong> <strong>Territory</strong>, for the period 2002 to 2009.Table 29: Wholesale PAC Supply – Regional Composition2002 2003 2004 2005 2006 2007 2008 2009Darwin 40% 40% 41% 41% 40% 42% 43% 43%Palmerston 9% 9% 10% 10% 10% 11% 12% 12%Alice Springs 20% 21% 19% 20% 19% 16% 15% 17%Katherine 8% 8% 8% 8% 7% 7% 6% 7%Tennant Creek 3% 3% 3% 2% 2% 2% 2% 2%Nhulunbuy 3% 3% 3% 4% 4% 4% 3% 3%NT Balance 17% 17% 17% 16% 17% 17% 17% 17%Since 2002, Darwin and Alice Springs has accounted for around 60% <strong>of</strong> the NT wholesale PACsupply.Since 2002, the percentage for Darwin and Palmerston have increased by 3%, from 40% to 43%and from 9% to 12% respectively; the percentage for Alice Springs has decreased by 3%, from20% to 17%.Chart 16: Wholesale PAC Supply – Regional CompositionDarwin Palmerston Alice Springs Katherine Tennant Creek Nhulunbuy NT Balance100%80%Percentage <strong>of</strong> Total PAC60%40%20%0%2002 2003 2004 2005 2006 2007 2008 2009DARWINTable 30 and Chart 17 show the wholesale PAC supply into Darwin for the period 2002 to 2009.Table 30: Wholesale PAC Supply – Darwin2002 2003 2004 2005 2006 2007 2008 2009Cider 19,127 17,984 17,043 17,135 16,926 16,723 20,473 26,453Total Wine 249,099 250,452 289,411 300,683 303,648 330,157 323,795 295,825Total Spirits 224,770 232,414 284,548 274,459 277,031 294,009 293,229 285,570Total Beer 473,087 462,063 472,893 499,079 495,893 514,871 548,874 566,673TOTAL 966,084 962,913 1,063,895 1,091,356 1,093,498 1,155,760 1,186,371 1,174,521Since 2002, total supply increased at a compound annual rate <strong>of</strong> 3%. From 2008 to 2009, supplydecreased by 1%, while the drinking age population increased by 3%.On average since 2002, beer has accounted for 46% <strong>of</strong> total supply.28 <strong>Northern</strong> <strong>Territory</strong> <strong>Department</strong> <strong>of</strong> <strong>Justice</strong>