Department of Justice - Department of Business - Northern Territory ...
Department of Justice - Department of Business - Northern Territory ...
Department of Justice - Department of Business - Northern Territory ...
- No tags were found...

Create successful ePaper yourself
Turn your PDF publications into a flip-book with our unique Google optimized e-Paper software.
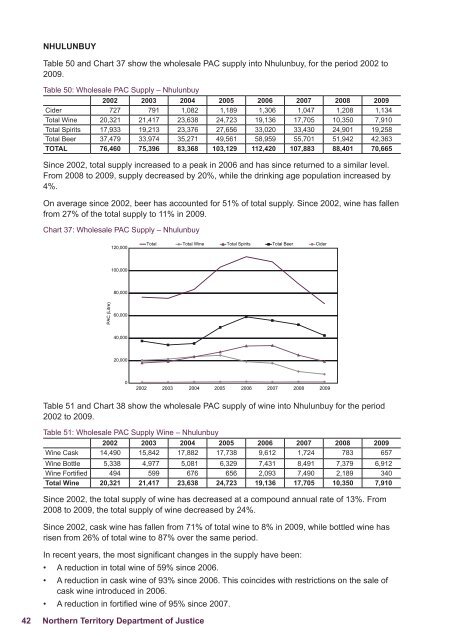
NHULUNBUYTable 50 and Chart 37 show the wholesale PAC supply into Nhulunbuy, for the period 2002 to2009.Table 50: Wholesale PAC Supply – Nhulunbuy2002 2003 2004 2005 2006 2007 2008 2009Cider 727 791 1,082 1,189 1,306 1,047 1,208 1,134Total Wine 20,321 21,417 23,638 24,723 19,136 17,705 10,350 7,910Total Spirits 17,933 19,213 23,376 27,656 33,020 33,430 24,901 19,258Total Beer 37,479 33,974 35,271 49,561 58,959 55,701 51,942 42,363TOTAL 76,460 75,396 83,368 103,129 112,420 107,883 88,401 70,665Since 2002, total supply increased to a peak in 2006 and has since returned to a similar level.From 2008 to 2009, supply decreased by 20%, while the drinking age population increased by4%.On average since 2002, beer has accounted for 51% <strong>of</strong> total supply. Since 2002, wine has fallenfrom 27% <strong>of</strong> the total supply to 11% in 2009.Chart 37: Wholesale PAC Supply – Nhulunbuy120,000Total Total Wine Total Spirits Total Beer Cider100,00080,000PAC (Litre)60,00040,00020,00002002 2003 2004 2005 2006 2007 2008 2009Table 51 and Chart 38 show the wholesale PAC supply <strong>of</strong> wine into Nhulunbuy for the period2002 to 2009.Table 51: Wholesale PAC Supply Wine – Nhulunbuy2002 2003 2004 2005 2006 2007 2008 2009Wine Cask 14,490 15,842 17,882 17,738 9,612 1,724 783 657Wine Bottle 5,338 4,977 5,081 6,329 7,431 8,491 7,379 6,912Wine Fortified 494 599 676 656 2,093 7,490 2,189 340Total Wine 20,321 21,417 23,638 24,723 19,136 17,705 10,350 7,910Since 2002, the total supply <strong>of</strong> wine has decreased at a compound annual rate <strong>of</strong> 13%. From2008 to 2009, the total supply <strong>of</strong> wine decreased by 24%.Since 2002, cask wine has fallen from 71% <strong>of</strong> total wine to 8% in 2009, while bottled wine hasrisen from 26% <strong>of</strong> total wine to 87% over the same period.In recent years, the most significant changes in the supply have been:• A reduction in total wine <strong>of</strong> 59% since 2006.• A reduction in cask wine <strong>of</strong> 93% since 2006. This coincides with restrictions on the sale <strong>of</strong>cask wine introduced in 2006.• A reduction in fortified wine <strong>of</strong> 95% since 2007.42 <strong>Northern</strong> <strong>Territory</strong> <strong>Department</strong> <strong>of</strong> <strong>Justice</strong>