Department of Justice - Department of Business - Northern Territory ...
Department of Justice - Department of Business - Northern Territory ...
Department of Justice - Department of Business - Northern Territory ...
- No tags were found...

Create successful ePaper yourself
Turn your PDF publications into a flip-book with our unique Google optimized e-Paper software.
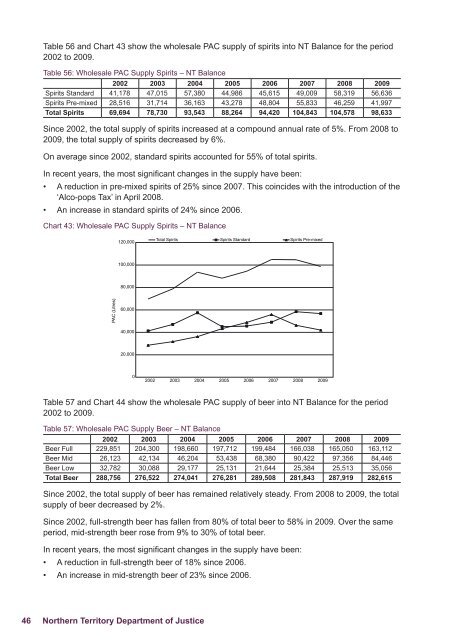
Table 56 and Chart 43 show the wholesale PAC supply <strong>of</strong> spirits into NT Balance for the period2002 to 2009.Table 56: Wholesale PAC Supply Spirits – NT Balance2002 2003 2004 2005 2006 2007 2008 2009Spirits Standard 41,178 47,015 57,380 44,986 45,615 49,009 58,319 56,636Spirits Pre-mixed 28,516 31,714 36,163 43,278 48,804 55,833 46,259 41,997Total Spirits 69,694 78,730 93,543 88,264 94,420 104,843 104,578 98,633Since 2002, the total supply <strong>of</strong> spirits increased at a compound annual rate <strong>of</strong> 5%. From 2008 to2009, the total supply <strong>of</strong> spirits decreased by 6%.On average since 2002, standard spirits accounted for 55% <strong>of</strong> total spirits.In recent years, the most significant changes in the supply have been:• A reduction in pre‐mixed spirits <strong>of</strong> 25% since 2007. This coincides with the introduction <strong>of</strong> the‘Alco-pops Tax’ in April 2008.• An increase in standard spirits <strong>of</strong> 24% since 2006.Chart 43: Wholesale PAC Supply Spirits – NT Balance120,000Total Spirits Spirits Standard Spirits Pre-mixed100,00080,000PAC (Litres)60,00040,00020,00002002 2003 2004 2005 2006 2007 2008 2009Table 57 and Chart 44 show the wholesale PAC supply <strong>of</strong> beer into NT Balance for the period2002 to 2009.Table 57: Wholesale PAC Supply Beer – NT Balance2002 2003 2004 2005 2006 2007 2008 2009Beer Full 229,851 204,300 198,660 197,712 199,484 166,038 165,050 163,112Beer Mid 26,123 42,134 46,204 53,438 68,380 90,422 97,356 84,446Beer Low 32,782 30,088 29,177 25,131 21,644 25,384 25,513 35,056Total Beer 288,756 276,522 274,041 276,281 289,508 281,843 287,919 282,615Since 2002, the total supply <strong>of</strong> beer has remained relatively steady. From 2008 to 2009, the totalsupply <strong>of</strong> beer decreased by 2%.Since 2002, full‐strength beer has fallen from 80% <strong>of</strong> total beer to 58% in 2009. Over the sameperiod, mid‐strength beer rose from 9% to 30% <strong>of</strong> total beer.In recent years, the most significant changes in the supply have been:• A reduction in full-strength beer <strong>of</strong> 18% since 2006.• An increase in mid-strength beer <strong>of</strong> 23% since 2006.46 <strong>Northern</strong> <strong>Territory</strong> <strong>Department</strong> <strong>of</strong> <strong>Justice</strong>