Department of Justice - Department of Business - Northern Territory ...
Department of Justice - Department of Business - Northern Territory ...
Department of Justice - Department of Business - Northern Territory ...
- No tags were found...

Create successful ePaper yourself
Turn your PDF publications into a flip-book with our unique Google optimized e-Paper software.
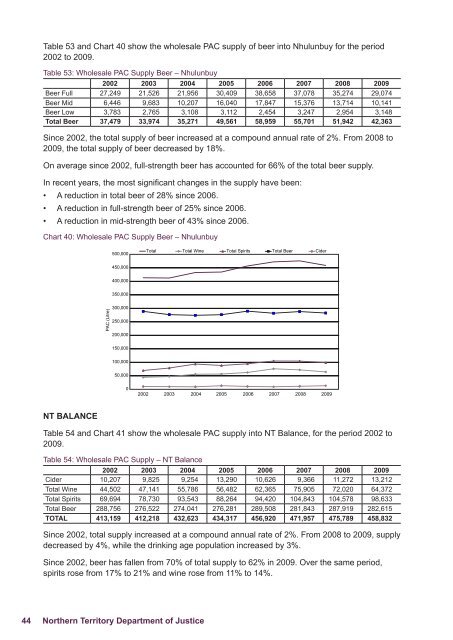
Table 53 and Chart 40 show the wholesale PAC supply <strong>of</strong> beer into Nhulunbuy for the period2002 to 2009.Table 53: Wholesale PAC Supply Beer – Nhulunbuy2002 2003 2004 2005 2006 2007 2008 2009Beer Full 27,249 21,526 21,956 30,409 38,658 37,078 35,274 29,074Beer Mid 6,446 9,683 10,207 16,040 17,847 15,376 13,714 10,141Beer Low 3,783 2,765 3,108 3,112 2,454 3,247 2,954 3,148Total Beer 37,479 33,974 35,271 49,561 58,959 55,701 51,942 42,363Since 2002, the total supply <strong>of</strong> beer increased at a compound annual rate <strong>of</strong> 2%. From 2008 to2009, the total supply <strong>of</strong> beer decreased by 18%.On average since 2002, full-strength beer has accounted for 66% <strong>of</strong> the total beer supply.In recent years, the most significant changes in the supply have been:• A reduction in total beer <strong>of</strong> 28% since 2006.• A reduction in full-strength beer <strong>of</strong> 25% since 2006.• A reduction in mid-strength beer <strong>of</strong> 43% since 2006.Chart 40: Wholesale PAC Supply Beer – Nhulunbuy500,000Total Total Wine Total Spirits Total Beer Cider450,000400,000350,000PAC (Litre)300,000250,000200,000150,000100,00050,00002002 2003 2004 2005 2006 2007 2008 2009NT BALANCETable 54 and Chart 41 show the wholesale PAC supply into NT Balance, for the period 2002 to2009.Table 54: Wholesale PAC Supply – NT Balance2002 2003 2004 2005 2006 2007 2008 2009Cider 10,207 9,825 9,254 13,290 10,626 9,366 11,272 13,212Total Wine 44,502 47,141 55,786 56,482 62,365 75,905 72,020 64,372Total Spirits 69,694 78,730 93,543 88,264 94,420 104,843 104,578 98,633Total Beer 288,756 276,522 274,041 276,281 289,508 281,843 287,919 282,615TOTAL 413,159 412,218 432,623 434,317 456,920 471,957 475,789 458,832Since 2002, total supply increased at a compound annual rate <strong>of</strong> 2%. From 2008 to 2009, supplydecreased by 4%, while the drinking age population increased by 3%.Since 2002, beer has fallen from 70% <strong>of</strong> total supply to 62% in 2009. Over the same period,spirits rose from 17% to 21% and wine rose from 11% to 14%.44 <strong>Northern</strong> <strong>Territory</strong> <strong>Department</strong> <strong>of</strong> <strong>Justice</strong>