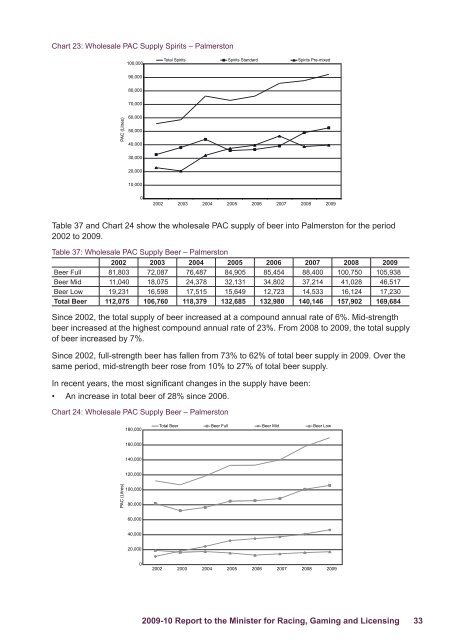
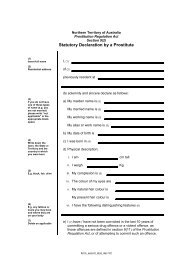
Chart 23: Wholesale PAC Supply Spirits – Palmerston100,000Total Spirits Spirits Standard Spirits Pre-mixed90,00080,00070,000PAC (Litres)60,00050,00040,00030,00020,00010,00002002 2003 2004 2005 2006 2007 2008 2009Table 37 and Chart 24 show the wholesale PAC supply <strong>of</strong> beer into Palmerston for the period2002 to 2009.Table 37: Wholesale PAC Supply Beer – Palmerston2002 2003 2004 2005 2006 2007 2008 2009Beer Full 81,803 72,087 76,487 84,905 85,454 88,400 100,750 105,938Beer Mid 11,040 18,075 24,378 32,131 34,802 37,214 41,028 46,517Beer Low 19,231 16,598 17,515 15,649 12,723 14,533 16,124 17,230Total Beer 112,075 106,760 118,379 132,685 132,980 140,146 157,902 169,684Since 2002, the total supply <strong>of</strong> beer increased at a compound annual rate <strong>of</strong> 6%. Mid‐strengthbeer increased at the highest compound annual rate <strong>of</strong> 23%. From 2008 to 2009, the total supply<strong>of</strong> beer increased by 7%.Since 2002, full‐strength beer has fallen from 73% to 62% <strong>of</strong> total beer supply in 2009. Over thesame period, mid‐strength beer rose from 10% to 27% <strong>of</strong> total beer supply.In recent years, the most significant changes in the supply have been:• An increase in total beer <strong>of</strong> 28% since 2006.Chart 24: Wholesale PAC Supply Beer – Palmerston180,000Total Beer Beer Full Beer Mid Beer Low160,000140,000120,000PAC (Litres)100,00080,00060,00040,00020,00002002 2003 2004 2005 2006 2007 2008 20092009-10 Report to the Minister for Racing, Gaming and Licensing 33
ALICE SPRINGSTable 38 and Chart 25 show the wholesale PAC supply into Alice Springs for the period 2002 to2009.Table 38: Wholesale PAC Supply – Alice Springs2002 2003 2004 2005 2006 2007 2008 2009Cider 5,926 6,078 5,916 5,859 6,546 5,677 6,153 8,864Total Wine 157,478 181,653 174,045 221,192 184,866 71,212 77,742 86,740Total Spirits 90,874 101,140 114,779 98,873 101,292 106,382 97,292 112,441Total Beer 230,676 214,847 207,116 203,577 210,340 261,128 241,678 252,674TOTAL 484,954 503,718 501,855 529,502 503,044 444,400 422,865 460,719Since 2002, total supply decreased at a compound annual rate <strong>of</strong> 1%. From 2008 to 2009,supply increased by 9%, while the drinking age population increased by 1%.Since 2005, beer has risen from 38% to 55% <strong>of</strong> total supply in 2009. Over the same period, winehas fallen from 42% to 19% <strong>of</strong> total supply.On average since 2002, spirits have accounted for 21% <strong>of</strong> total supply.Chart 25: Wholesale PAC Supply – Alice Springs600,000Total Total Wine Total Spirits Total Beer Cider500,000400,000PAC (Litre)300,000200,000100,00002002 2003 2004 2005 2006 2007 2008 2009Table 39 and Chart 26 show the wholesale PAC supply <strong>of</strong> wine into Alice Springs for the period2002 to 2009.Table 39: Wholesale PAC Supply Wine – Alice Springs2002 2003 2004 2005 2006 2007 2008 2009Wine Cask 38,376 25,188 34,317 135,410 135,267 16,367 19,968 23,274Wine Bottle 34,372 35,211 39,356 41,933 44,646 52,619 56,367 62,231Wine Fortified 84,730 121,254 100,372 43,850 4,953 2,226 1,406 1,236Total Wine 157,478 181,653 174,045 221,192 184,866 71,212 77,742 86,740Since 2002, the total supply <strong>of</strong> wine has decreased at a compound annual rate <strong>of</strong> 8%. From2008 to 2009, the total supply <strong>of</strong> wine increased by 12%.In contrast to cask and fortified wines, bottled wine has increased steadily at a compound annualrate <strong>of</strong> 9% since 2002. Since 2005, bottled wine has risen from 19% to 72% <strong>of</strong> total wine supplyand cask wine has fallen from 61% to 27% <strong>of</strong> total wine supply. Since 2003, fortified wine hasfallen from 67% to 1% <strong>of</strong> total wine supply.In recent years, the most significant changes in the supply have been:• A reduction in total wine by 53% since 2006.34 <strong>Northern</strong> <strong>Territory</strong> <strong>Department</strong> <strong>of</strong> <strong>Justice</strong>