View - IEEE Xplore
View - IEEE Xplore
View - IEEE Xplore

You also want an ePaper? Increase the reach of your titles
YUMPU automatically turns print PDFs into web optimized ePapers that Google loves.
<strong>IEEE</strong> TRANSACTIONS ON NANOTECHNOLOGY, VOL. 1, NO. 4, DECEMBER 2002 243A SPICE-Compatible Model for Nanoscale MOSFETCapacitor Simulation Under the Inversion ConditionTing-wei Tang, Fellow, <strong>IEEE</strong>, and Yiming Li, Member, <strong>IEEE</strong>Abstract—A SPICE-compatible charge model fornanoscale MOSFETs is proposed. Based on the solution ofSchrödinger–Poisson (S-P) equations, the developed compactcharge model is optimized with respect to: 1) the position ofthe charge concentration peak; 2) the maximum of the chargeconcentration; 3) the total inversion charge sheet density; and4) the average inversion charge depth, respectively. This modelcan predict inversion layer electron density for various oxidethicknesses and applied voltages. Compared to the S-P results,our model prediction is within 5% of accuracy. Application of thischarge quantization model to the C–V measurement producesan excellent agreement. This compact model has continuousderivatives and is therefore amenable to a device simulator. It canalso be easily incorporated into circuit simulator for modelingultrathin oxide MOSFET C–V characteristics.Index Terms—C–V curve, compact charge model, deviceand circuit simulation, MOSFETs, quantum correction,Schrödinger–Poisson.I. INTRODUCTIONAS THE feature size of MOS devices shrinks for higherdensity and performance, the thickness of silicon oxidealso scales down. In aggressively scaled MOSFETs, the thicknessof oxide in a MOS capacitor can be as thin as 0.8 nm [1]prevented only by the leakage tunneling current. For the oxidethickness ( )of nm and the applied gate voltage ( )of V, the displacement of the inversion carrier densityaway from the Si–SiO interface due to the quantization effectcannot be neglected [2]. Thus, any accurate calculation of the inversion-layercapacitance must take this quantization effect intoconsideration.The most accurate way of incorporating the quantum effect inthe inversion layer is to solve the coupled Schrödinger–Poisson(S-P) equations subject to an appropriate boundary condition atthe Si–SiO interface [3]. This can be done without difficultiesin solving the S-P equations in one dimension, but the S-P approachis not amenable to a realistic device simulator such asa simple compact model used in the SPICE. Other approachessuch as the density gradient method [3], [4] and the effectiveManuscript received June 8, 2002; revised October 10, 2002. This workwas supported in part by the National Science Foundation under GrantECS-0120128, the National Science Council of Taiwan under Contract NSC91–2112-M-317–001, and the 2002 Research Fellowship Award of the PanWen-Yuan Foundation in Taiwan.T.-W. Tang is with the Department of Electrical and Computer Engineering,University of Massachusetts, Amherst, MA 01003 USA (e-mail:ttang@ecs.umass.edu)Y. Li is with the National Nano Device Laboratories, Hsinchu 300, Taiwan.He is also with the Microelectronics and Information Systems ResearchCenter, National Chiao Tung University, Hsinchu 300, Taiwan, R.O.C. (e-mail:ymli@faculty.nctu.edu.tw).Digital Object Identifier 10.1109/TNANO.2002.807389Fig. 1. Cross-section view of the nanoscale MOSFET and C–V curvesmeasurement configuration.potential method [5], [6] also suffer from the same disadvantage—computationallyit is still excessive and physically themethod is not very transparent.In this paper, we have successfully developed a SPICE-compatiblemodel feasible for nanoscale MOSFET capacitor simulation.The model is a generalization of an analytical modelproposed by Hänsch et al. many years ago [7]. The solution ofS-P equations is utilized to construct the model, where four optimizationconstraints: 1) the position of the charge concentrationpeak; 2) the maximum of the charge concentration; 3) thetotal inversion charge sheet density; and 4) the average inversioncharge depth are used as criteria for the model parameterextraction. The model parameters are expressed as a function ofand for the purpose of simulating nanoscale MOSFETcapacitances. For other applications, they can be also expressedin terms of the surface electric field and the oxide thickness.II. MODEL CONSTRUCTION AND RESULTFirst, a poly-oxide-silicon system as shown in Fig. 1 issimulated using the drift-diffusion (D-D) approximation [8],[9]. The D-D equations are solved self-consistently with theS-P equations. The S-P equations are assumed to have no wavepenetration at the Si–SiO interface [10]. The S-P equationsare discretized by the finite difference method (the so-calledbox method). After the discretization, the corresponding matrixeigenvalue problem and the system of nonlinear algebraic equationsare solved iteratively to obtain a self-consistent solution.More than 16 subbands are used in the Schrödinger equationsolver. The chosen varies from 1 to 3 nm and the appliedranges from 0.2 to 2 V. The calculated inversion-layercharge densities are then cast into the form(1)1536-125X/02$17.00 © 2002 <strong>IEEE</strong>
244 <strong>IEEE</strong> TRANSACTIONS ON NANOTECHNOLOGY, VOL. 1, NO. 4, DECEMBER 2002Fig. 2. Plot of the optimal value for the parameter a and its fitting formulafor various T and different V .Fig. 4. Plot of the optimal value for the parameter a and its fitting formulafor various T and different V .Fig. 3. Plot of the optimal value for the parameter a and its fitting formulafor various T and different V .where is the classical electron density solved from thePoisson equation andis the thermalwavelength. Using a generic algorithm, the four model parameters, , , and are optimized to best fit theself-consistent S-P solution for all ’s and ’s. The fittingaccuracy of these parameters is based on the optimization withrespect to the aforementioned four constraints. The averageinversion charge depth is defined asThe results of these parameters fittings are shown in Figs. 2–4.As seen in Fig. 2, the plots of ’s versus are almost independentof . Fig. 3 shows that the dependence of ’s on fordifferent is similar; all have a decreasing slope. Note thatincreases as is decreased. Not shown are plots of ’swhich are for all practical purpose nearly zero. Shown in Fig. 4are plots of ’s versus , all having an increasing slope oppositeto the shape of ’s. Also noticed is that all ’s converge tozero at a very low , implying that is only associated witha higher-order quantum correction.(2)Fig. 5. Error plots of the position of the charge concentration peak versus Vfor various T .After optimization, these parameters are empirically fitted asa function of and as follows:(3)(4)where is in volts and is in nanometers. The model parametersgiven in (3)–(5) are based on a p-type substrate with10 cm . For other substrate dopings, should be adjustedby an amount equal to a shift in the threshold voltage due to thechange in . However, this adjustment is usually very small( 0.13 V). The accuracy of the model inversion-layer chargedensity given by (1), (3) – (5) compared to the S-P solution isvery good. In terms of the four criteria mentioned above, the accuracyis within 5%.Shown in Figs. 5–8 are, respectively, errors between the fitted’s formula and the S-P solution against for each optimizationcriterion. In Figs. 5 and 6, it is shown that the error of theposition of the charge concentration peak is less than 3.5% andthe error of the maximum of the charge concentration is less than3%, respectively. Fig. 7 shows that the error of the total inversioncharge sheet density between our model and the S-P equation is(5)
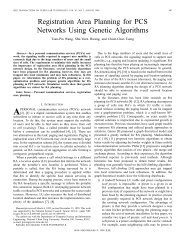
TANG AND LI: A SPICE-COMPATIBLE MODEL FOR NANOSCALE MOSFET CAPACITOR SIMULATION 245Fig. 6. Error plots of the maximum of the charge concentration versus V forvarious T .Fig. 8. Error plots of the average inversion charge depth versus V for variousT .Fig. 7. Error plots of the total inversion charge sheet density versus V forvarious T .less than 3%. Fig. 8 shows that the error of the average inversioncharge depth is within 2%–5%. For the doping concentrationvarying from 10 cm to 10 cm , the four errorsversus are also estimated with the same fitted ’s formula.We have found that the variation of errors are all within 6% andthis maximum error of the average inversion charge depth occurredat 10 cm , nm, and V.For a MOSFET with the Gaussian and low–high doping profiles,we have also found that the error trend is similar to that ofuniform doping and that the largest error fluctuation (6.7% forGaussian doping profile) occurs under low doping level (10 cm ), thicker oxide thickness ( nm), and lowgate bias ( V) conditions.Finally, for other applications such as a two-dimensional(2-D) simulation, it is more conventient to express the coefficients:, , and in terms of the surface electric fieldand the oxide thickness(6)(7)where the is in nm and the in kV/cm is self-consistentlycomputed with the D-D model.(8)Fig. 9. Comparison of the simulated and measured C–V curves for theproposed SPICE-compatible model and the S-P model.III. APPLICATION TO PREDICTION OF C–V CHARACTERISTICSAs an application, we have applied our compact quantum correctionmodel for the inversion charge to the calculation of C–Vcurves. A 20 20 m N-MOSFET with nm is fabricatedand is measured for the C–V curve. The developed modelis used to analyze the C–V data of the MOSFET sample at a frequencyof 100 kHz as shown in Fig. 1. The total capacitance consistsof three components in series connection, the poly-gate capacitance( ), the gate-oxide capacitance ( ,where is oxide dielectric constant), and the surface capacitance( ). The total capacitance is thus given by [11], [12]The surface capacitance , where is thesurface potential, is computed by the Poisson equation. The surfacecharge consists of the inversion and depletion charge,and the computed from (1) is integrated over the entire inversionlayer to obtain the inversion charge sheet density. For thesample with 1.6-nm oxide thickness, the doping profile of thedevice is simulated and calibrated in our C–V curve calculation.The experimentally measured data is shown together with theclassical and S-P results in Fig. 9. Our result almost coincides(9)
246 <strong>IEEE</strong> TRANSACTIONS ON NANOTECHNOLOGY, VOL. 1, NO. 4, DECEMBER 2002with that of the S-P model as should be. The agreement withthe experimental data is excellent except for V. Thisis expected as we have assumed zero penetration of the wavefunctioninto the oxide in our S-P equation solver. The deviationof the calculated result from the measured data indicates thatthere is a substantial tunneling through the oxide taking place atV.IV. CONCLUSIONBased on the S-P solutions, we have developed a compactmodel for correcting the classical inversion-layer charge distributionwhich agrees with the S-P solution within 5%. By inputtingthe classical charge density from the series expansionsolution of Poisson’s equation [13], [14] or the D-D-based simulator,together with the device oxide thickness and gate voltage,the proposed inversion-layer charge correction model calculatesnanoscale MOSFET inversion charge explicitly, taking into considerationof the quantum effect. The application of this SPICEcompatible model to the C–V measurement produces an excellentagreement. This inversion-layer charge correction modelhas continuous derivatives and therefore is amenable to a devicesimulator. It can also be easily incorporated into circuit simulatorfor modeling ultrathin oxide MOSFET C–V characteristicswithout impact on the computational time and data storage. Weare currently extending this model to include leakage tunnelingcurrents at high gate voltages.ACKNOWLEDGMENTThe author would like to thank the referees and the AssociateEditor for valuable comments and suggestions.REFERENCES[1] S. Song, H. Kim, J. Y. Yoo, J. H. Yi, W. S. Kim, N. I. Lee, K. Fujihara,H.-K. Kang, and J. T. Moon, “On the gate oxide scaling of high performanceCMOS transistors,” IEDM. Tech. Dig., pp. 03-02.1–03-02-4,2001.[2] F. Stern and W. E. Howard, “Properties of semiconductor surface inversionlayers in the electric quantum limit,” Phys. Rev., vol. 163, pp.816–835, 1967.[3] M. G. Ancona, Z. Yu, W.-C. Lee, and R. W. Dutton, “Simulation ofquantum confinement effects in ultra-thin-oxide MOS structures,” <strong>IEEE</strong>Trans. Computer-Aided Design, vol. 11, pp. 1–17, May 1998.[4] M. G. Ancona, Z. Yu, R. W. Dutton, P. J. Vande Voorde, M. Cao, andD. Vook, “Density-gradient analysis of MOS tunneling,” <strong>IEEE</strong> Trans.Electron Devices, vol. 47, pp. 2310–2319, Dec. 2000.[5] S. M. Ramey and D. K. Ferry, “Modeling of quantum effects in ultrasmallFD-SOI MOSFET’s with effective potentials and three-dimensionalMonte Carlo,” Physica B, vol. 314, no. 1-4, pp. 350–353, Mar.2002.[6] D. K. Ferry, “Simulation at the start of the new millennium: Crossingthe quantum-classical threshold,” VLSI Design, vol. 13, no. 1-4, pp.155–161, 2001.[7] W. Hänsch, T. Vogelsang, R. Kircher, and M. Orlowski, “Carrier transportnear the Si/SiO interface of a MOSFET,” Solid-State Electron., vol.32, pp. 839–849, 1989.[8] X. Wang, “Quantum Correction to the Charge Density Distribution inInversion Layers,” M.S. thesis, Univ. Massachusetts, Amherst, 2001.[9] X. Wang and T.-W. Tang, “Comparison of three quantum correctionmodels for the charge density in MOS inversion layers,” J. Comput.Electron., submitted for publication.[10] S.-H. Lo, D. A. Buchanan, and Y. Taur, “Modeling and characherizationof quantization, polysilicon depletion, and direct tunneling effectsin MOSFET’s with ultrathin oxides,” IBM J. Res. Dev., pp. 327–337,1999.[11] F. Stern, “Quantum properties of surface space-charge layers,” CRCCrit. Rev. I, Solid State Sci., pp. 499–514, 1974.[12] K. Chen, G. Zhang, J. Duster, C. Hu, J. Huang, Z. Liu, and P. K. Ko,“MOSFET inversion layer capacitance model based on Fermi-Dirac statisticsfor wide temperature range,” Solid-State Electron., vol. 41, p. 507,1997.[13] T. N. Nguyen, “Small-geometry mos transistor: Physics and modeling ofsurface- and buried-channel MOSFET’s,” Ph.D. dissertation, StanfordUniv., Stanford, CA, 1984.[14] J. C. S. Woo, K. W. Terrill, and P. K. Vasudev, “Two-dimensional analyticalmodeling of very thin SOI MOSFET’s,” <strong>IEEE</strong> Trans. ElectronDevices, vol. 37, pp. 1999–2006, Sept. 1990.Ting-wei Tang (SM’70–F’99) received the B.S.degree in electrical engineering from the NationalTaiwan University, Taiwan, R.O.C. in 1957 and theM.Sc. and Ph.D degrees in engineering from BrownUniversity, Providence, RI, in 1961 and 1964,respectively.From 1964 to 1968, he was an Assistant Professorof Aerospace Engineering at the University ofConnecticut, Storrs. In 1968, he joined the Electricaland Computer Engineering Department, Universityof Massachusetts, Amherst, as an Associate Professorand was promoted to Professor in 1974. He was a Visiting Professor atOxford University, Oxford, U.K., in 1975 and a Visiting Samsung Professorof Electronics Engineering at Seoul National University, Seoul, Korea, in thefall of 1990. During 1999–2000, he was a Research Chair at the NationalCenter for High-Performance Computing, Hsinchu, Taiwan, R.O.C. His currentresearch interest is in semiconductor device physics and numerical modeling ofsemiconductor devices. He teaches a graduate-level course in which studentsgain hands-on experience in developing an elementary device simulationsoftware. He has published more than 100 journal articles and conferencepapers.Dr. Tang served on the <strong>IEEE</strong> Admission and Advancement Committee(1974–1977), the Technical Program Committee of <strong>IEEE</strong> BCTM (1995–1998),and the Scientific Advisory Committee of ISSDT (1994–1995). He receivedan Outstanding Senior Faculty Award and an Outstanding Teaching Awardfrom the College of Engineering, University of Massachusetts, in 1989and 1991, respectively, and the Chancellor’s Medal from the University ofMassachusetts in 2000. He was a keynote speaker at the 1993 Symposium onSemiconductors Modeling and Simulation in Taipei, Taiwan, R.O.C. the 1995Fourth International Seminar on Simulation of Devices and Technologies atKruger National Park, South Africa, and the 1999 Semiconductor TechnologyCAD Workshop and Exhibition in Hsinchu, Taiwan, R.O.C.Yiming Li (M’02) received the B.S. degrees in appliedmathematics and electronics engineering, theM.S. degree in applied mathematics, and the Ph.D.degree in electronics, all from National Chiao TungUniversity, Taiwan, R.O.C. in 1996, 1998, and 2001,respectively.In 2001, he joined the National Nano Device Laboratories(NDL) as an Associate Researcher and theMicroelectronics and Information Systems ResearchCenter, National Chiao Tung University (NCTU), asan Assistant Professor, where he has been engaged inthe research and development of modeling and simulation of nanodevices andVLSI circuits. He was a Visiting Assistant Professor with the Department ofElectrical and Computer Engineering, University of Massachusetts, Amherst,in the fall of 2002. He is in charge of the nanodevice TCAD Laboratory and theParallel and Scientific Computing Laboratory at NDL and NCTU. His currentresearch areas include semiconductor nanostructures physics, modeling, and devicesimulation, VLSI circuit simulation, computational biology, and advancednumerical techniques and scientific computation. He has authored or coauthoredover 90 researcher papers in international books, journals, and conferences.Dr. Li is a member of Phi Tau Phi. He received a Research Fellowship Awardfrom the Pan Wen-Yuan Foundation, Taiwan, R.O.C. in 2002. Dr. Li is a memberof the Institute of Electronic, Information and Communication Engineers, theAmerican Physical Society, the Society for Industrial and Applied Mathematics,and WSEAS.