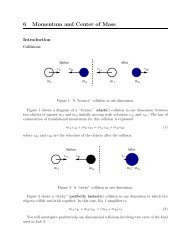
Lab#7: Riemann-sums and Definite integrals using Derive- (chapter ...
Lab#7: Riemann-sums and Definite integrals using Derive- (chapter ...
Lab#7: Riemann-sums and Definite integrals using Derive- (chapter ...

Create successful ePaper yourself
Turn your PDF publications into a flip-book with our unique Google optimized e-Paper software.
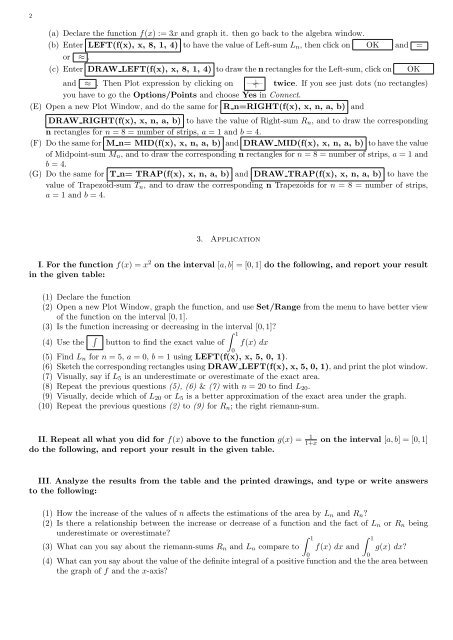
2(a) Declare the function f(x) := 3x <strong>and</strong> graph it. then go back to the algebra window.(b) Enter LEFT(f(x), x, 8, 1, 4) to have the value of Left-sum L n , then click on OK <strong>and</strong> =or ≈ .(c) Enter DRAW LEFT(f(x), x, 8, 1, 4) to draw the n rectangles for the Left-sum, click on<strong>and</strong> ≈ . Then Plot expression by clicking on —∽|— twice. If you see just dots (no rectangles)you have to go the Options/Points <strong>and</strong> choose Yes in Connect.(E) Open a new Plot Window, <strong>and</strong> do the same for R n=RIGHT(f(x), x, n, a, b) <strong>and</strong>DRAW RIGHT(f(x), x, n, a, b) to have the value of Right-sum R n , <strong>and</strong> to draw the correspondingn rectangles for n = 8 = number of strips, a = 1 <strong>and</strong> b = 4.(F) Do the same for M n= MID(f(x), x, n, a, b) <strong>and</strong> DRAW MID(f(x), x, n, a, b) to have the valueof Midpoint-sum M n , <strong>and</strong> to draw the corresponding n rectangles for n = 8 = number of strips, a = 1 <strong>and</strong>b = 4.(G) Do the same for T n= TRAP(f(x), x, n, a, b) <strong>and</strong> DRAW TRAP(f(x), x, n, a, b) to have thevalue of Trapezoid-sum T n , <strong>and</strong> to draw the corresponding n Trapezoids for n = 8 = number of strips,a = 1 <strong>and</strong> b = 4.OK3. ApplicationI. For the function f(x) = x 2 on the interval [a, b] = [0, 1] do the following, <strong>and</strong> report your resultin the given table:(1) Declare the function(2) Open a new Plot Window, graph the function, <strong>and</strong> use Set/Range from the menu to have better viewof the function on the interval [0, 1].(3) Is the function increasing or decreasing in the interval [0, 1]?∫∫1(4) Use the button to find the exact value of f(x) dx0(5) Find L n for n = 5, a = 0, b = 1 <strong>using</strong> LEFT(f(x), x, 5, 0, 1).(6) Sketch the corresponding rectangles <strong>using</strong> DRAW LEFT(f(x), x, 5, 0, 1), <strong>and</strong> print the plot window.(7) Visually, say if L 5 is an underestimate or overestimate of the exact area.(8) Repeat the previous questions (5), (6) & (7) with n = 20 to find L 20 .(9) Visually, decide which of L 20 or L 5 is a better approximation of the exact area under the graph.(10) Repeat the previous questions (2) to (9) for R n ; the right riemann-sum.II. Repeat all what you did for f(x) above to the function g(x) = 1do the following, <strong>and</strong> report your result in the given table.1+xon the interval [a, b] = [0, 1]III. Analyze the results from the table <strong>and</strong> the printed drawings, <strong>and</strong> type or write answersto the following:(1) How the increase of the values of n affects the estimations of the area by L n <strong>and</strong> R n ?(2) Is there a relationship between the increase or decrease of a function <strong>and</strong> the fact of L n or R n beingunderestimate or overestimate?(3) What can you say about the riemann-<strong>sums</strong> R n <strong>and</strong> L n compare to∫ 10f(x) dx <strong>and</strong>∫ 10g(x) dx?(4) What can you say about the value of the definite integral of a positive function <strong>and</strong> the the area betweenthe graph of f <strong>and</strong> the x-axis?