Lab #3: Vectors Functions and Space Curves 1. Goals of this lab ...
Lab #3: Vectors Functions and Space Curves 1. Goals of this lab ...
Lab #3: Vectors Functions and Space Curves 1. Goals of this lab ...

You also want an ePaper? Increase the reach of your titles
YUMPU automatically turns print PDFs into web optimized ePapers that Google loves.
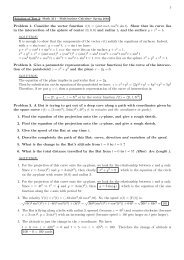
Math 211- Yahdi <strong>Lab</strong> <strong>#3</strong>: <strong>Vectors</strong> <strong>Functions</strong> <strong>and</strong> <strong>Space</strong> <strong>Curves</strong> Due date: Thursday, March 4, 2010<strong>1.</strong> <strong>Goals</strong> <strong>of</strong> <strong>this</strong> <strong>lab</strong>You will learn how Maple help to perform operations on vector functions <strong>and</strong> to solve related problems,as well as plotting simultaneously diverse objects such as space curves, intersections <strong>of</strong> surfaces, planarprojections <strong>and</strong> tangent lines.2. Group work <strong>and</strong> <strong>Lab</strong> Report presentationI strongly recommend to:• Type comments on your Maple work sheet to explain <strong>and</strong> organize your work• Enter restart: <strong>and</strong> needed packages at the beginning <strong>of</strong> each problem to empty Maple internal memory <strong>and</strong>to download appropriate packages.• Frequently save your work (after each maple operation).• See Guide to <strong>Lab</strong> posted at the course web page, as well as the previous <strong>lab</strong>s for more on Maple comm<strong>and</strong>s<strong>and</strong> presentation.- Work with your partners <strong>and</strong> be sure that you give the opportunity to each member <strong>of</strong> the group to participate(establish a rotation for example). Each <strong>Lab</strong> group should turn in only one report for grading. NUMBER <strong>and</strong>LABEL all answers <strong>and</strong> all Graphs. DO NOT HAND IN UNNECESSARY WORK! Where appropriate, youmust explain your reasoning in text or mathematically .- You can email me your report. Your <strong>Lab</strong> report is supposed to be well organized <strong>and</strong> with all the explanationsneeded. The <strong>lab</strong>-report will be graded on its quality <strong>and</strong> its presentation (10 points).3. Maple comm<strong>and</strong>s needed:The documents with the <strong>Lab</strong>s #1 & #2 took you through most (but not all) <strong>of</strong> the MAPLE comm<strong>and</strong>s that youneed. So, have them h<strong>and</strong>y with you (or get them from the homework web page). You ca always use the Maple helpmenu to get most <strong>of</strong> Maple comm<strong>and</strong>s, in particular for all their related OPTIONS. Of course, you can use eitherthe Maple mode or the 2-dimensional Math mode. In addition, use the shortcuts from the icons on the tabletat the left <strong>of</strong> the Maple window. worksheet as well as the right click to display the avai<strong>lab</strong>le options.In order to help you work faster <strong>and</strong> get the most <strong>of</strong> Maple, below are new comm<strong>and</strong>s with some from <strong>lab</strong>s #1& #2. In particular, a selection <strong>of</strong> new Maple comm<strong>and</strong>s needed to do all st<strong>and</strong>ard vector function operations <strong>and</strong>plotting. You work under both Maple mode <strong>and</strong> Math mode.3.<strong>1.</strong> Vector function operations. .• A vector function is in the form r(t) = 〈x(t), y(t), z(t)〉.• A vector function is written in Maple with either Square Brackets or angle brackets; r(t) := [x(t), y(t), z(t)]or r(t) :=< x(t), y(t), z(t) >. Since we are using operations with vectors (with angle brackets), it is recommendedto always use angle brackets to allow more flexibility <strong>of</strong> operations.• Its graph is a space curve with a parameter t, so you have to use the spacecurve comm<strong>and</strong> for t betweenany two numbers for the domain.• Example with the space curve with equation r(t) = 〈cos t, sin t, t〉.restart;to clear Maple’s internal memorywith(plots):Load Maple’s Plots package.r(t) :=< cos t, sin t, t >; Let r(t) = 〈cos t, sin t, t〉, using the symbol ”:=”spacecurve(r(t), t = 0..8 ∗ P i, axes = box); Plot the space curve for t between 0 <strong>and</strong> 8π <strong>and</strong> in a box.Note that Maple is case sensitive so you must enter Pi not pi or PI.curve:= spacecurve(r(t), t = 0..8 ∗ P i): Let the actual space curve (not the vector function be called “curve”)display (curve, <strong>lab</strong>els=[x, y, z]);Plot the space curve <strong>and</strong> <strong>lab</strong>el the axes.display (curve, thickness=5, color= green); Plot with more thickness <strong>and</strong> green color.tubeplot(r(t), t = −5..10, radius = 0.2); To have a fattened tube with radius 0.2 for t between −5 <strong>and</strong> 10.diff(r(t), t); Calculate the tangent vector or derivative <strong>of</strong> r(t) with respect to t.dr(t) := diff(r(t), t);Let <strong>this</strong> derivative be named dr(t).dr(1) := subs(t = 1, dr(t));Substitute 1 for t in dr(t), <strong>and</strong> name it dr(1).evalf(%) ;Evaluate the previous expression as a decimal.You can also use the function option: f(x) then just type f(1) to get the value <strong>of</strong> f at <strong>1.</strong>To use the function option, just enter the function, click enter <strong>and</strong> select that <strong>this</strong> is a function when you are asked.1
23.2. Other useful operations. .Right click or Left Tablet Then select the operation or the optionp := (1 + x) 2 ∗ (x − 3); Let p = (1 + x) 2 (x − 3)exp<strong>and</strong>(p) ; Exp<strong>and</strong> p.evalf(p);Write p as floating point number.factor(p); Factor p.solve(p = 0, x);Solve p = 0 for x symbolically.fsolve(p = 0, x);Solve p = 0 for x numerically.4. Initialization:Start your <strong>lab</strong> work on Maple by entering the following (T means text, <strong>and</strong> > means either Math <strong>of</strong> Maple Mode):T <strong>Lab</strong> 3: Vector <strong>Functions</strong> <strong>and</strong> <strong>Space</strong> <strong>Curves</strong> Enter the <strong>lab</strong> tile (as text).T Date Enter today’s date (as text).T Group members Enter your names (as text).> restart; to clear Maple’s internal memory> with(plots): Load Maple’s Plots package.T Problem 1 <strong>lab</strong>el each problem.If needed, Load the packages with(LinearAlgebra) <strong>and</strong> with(VectorCaculus)like in <strong>lab</strong> #2 to perform some vectoroperations.5. <strong>Lab</strong> requirementsNote: 2 points for the quality <strong>of</strong> presentation <strong>of</strong> your work. Email me your Maple file.Problem <strong>1.</strong> ( 5 points) For similar examples, see your notes in class, the attached Maple file, <strong>and</strong>/or Example 5 section 13.<strong>1.</strong>Consider the cylinder x 2 + y 2 = 4 <strong>and</strong> the surface z = xy.(1) Plot the two surfaces in the same system <strong>of</strong> axis, each with different color.(2) Describe, intuitively, their intersection.(3) Find parametric equations (or vector functions) for the two curves that form <strong>this</strong> intersection.(4) Finally, simultaneously plot these curves with the two surfaces to confirm your answer.IMPORTANT: For the space curves you may need to use the options thickness <strong>and</strong> color todistinguish between the two curves <strong>and</strong> to make them visible on the surfaces, use the option“style=wireframe” to make the surfaces transparent, <strong>and</strong> you may use more options for thesurfaces using the icons on the tabular.Problem 2. ( 5 points) For similar examples, see your notes in class, the attached Maple file, <strong>and</strong>/or Example 6 section 13.<strong>1.</strong>Consider the space curve x = cos t, y = sin t, z = sin 2 t.(1) Without plotting <strong>this</strong> curve, show that <strong>this</strong> curve lies on the cylinder x 2 + y 2 = <strong>1.</strong>(2) Plot <strong>this</strong> curve (without the cylinder), then use the appropriate rotations to see the planar projections on thexy-plane, the xz-plane <strong>and</strong> the yz-plane.(3) Now, find the equations <strong>of</strong> each <strong>of</strong> the 3 planar projections, plot them <strong>and</strong> compare to your work on question2 to confirm your answers.Problem 3. ( 5 points) Consider the vector function r(t) =< cos t, 3e 2t , 3e −2t >. Find parametric equations <strong>of</strong> thetangent line to the corresponding curve at the point P (1, 3, 3). Illustrate by graphing both the curve <strong>and</strong> the tangentline on common (be careful with the scale!).Problem 4. ( 8 points) Let r(t) = 〈cos t, sin t, t2 2 + 1〉.(1) At any time t, compute the tangent <strong>and</strong> the unit tangent vectors, the velocity, the speed <strong>and</strong> the accelerationvector.(2) Then, at P (1, 0, 1), compute the velocity, the speed, the vectors T, N <strong>and</strong> B, the acceleration vector <strong>and</strong> itstangential <strong>and</strong> normal components, <strong>and</strong> the the curvature k. Hint: find the value <strong>of</strong> t that correspond to thatpoint P (1, 0, 1).(3) At the same point P (1, 0, 1), find equations <strong>of</strong> the tangent line, <strong>and</strong> the plane that contains the vectors T <strong>and</strong>N.(4) At the same point P (1, 0, 1), find the radius, center <strong>and</strong> the equation <strong>of</strong> the osculating circle.(5) Finally, using Maple, give the best possible visual illustrations <strong>of</strong> all these objects found in questions 2, 3 <strong>and</strong>4 in the figure.