ENERGY STAR Power and Performance Data Sheet - Nec
ENERGY STAR Power and Performance Data Sheet - Nec
ENERGY STAR Power and Performance Data Sheet - Nec
- No tags were found...

Create successful ePaper yourself
Turn your PDF publications into a flip-book with our unique Google optimized e-Paper software.
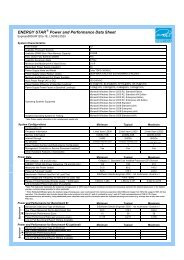
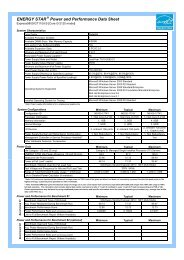
<strong>ENERGY</strong> <strong>STAR</strong> ® <strong>Power</strong> <strong>and</strong> <strong>Performance</strong> <strong>Data</strong> <strong>Sheet</strong>Express5800/GT110d-S [Xeon E3-1220 model]System CharacteristicsForm FactorAvailable Processor SocketsAvailable DIMM Slots / Max Memory CapacityECC <strong>and</strong>/or Fully Buffered DIMMsAvailable Expansion SlotsMinimum <strong>and</strong> Maximum # of Hard DrivesRedundant <strong>Power</strong> Supply Capable?<strong>Power</strong> Supply Make <strong>and</strong> Model<strong>Power</strong> Supply Output Rating* (watts)Minimum <strong>and</strong> Maximum # of <strong>Power</strong> SuppliesInput <strong>Power</strong> Range (AC or DC)<strong>Power</strong> Supply Efficiency at Specified Loadings*<strong>Power</strong> Supply <strong>Power</strong> Factor at Specified Loadings*Operating Systems SupportedInstalled Operating System for TestingPedestal14/32GBYes3 PCI-E 2.0, 1 PCI0 to 5NoLeadYear TG10-0250-01250W1100-240VAC85.0%@20%, 88.4%@50%, 85.9%@100%0.970@20%, 0.990@50%, 0.999@100%Microsoft Windows Server 2003 St<strong>and</strong>ardMicrosoft Windows Server 2003 R2 St<strong>and</strong>ardMicrosoft Windows Server 2008 St<strong>and</strong>ard/EnterpriseMicrosoft Windows Server 2008 R2 Foundation/St<strong>and</strong>ard/EnterpriseRed Hat Enterprise Linux 5.6Red Hat Enterprise Linux 6.1Microsoft Windows Server 2008 R2 St<strong>and</strong>ard* Note: <strong>Power</strong> supply information is for a single power supply onlySystem Configurations<strong>Power</strong> <strong>Data</strong>Benchmark #1Minimum Typical MaximumConfiguration ID N8100-1772Y N8100-1772Y N8100-1772YProcessor Information 1, Intel Xeon E3-1220 1, Intel Xeon E3-1220 1, Intel Xeon E3-1220Memory Information 1, 1GB 2, 8GB 4, 8GBInternal Storage 1, HDD 2, HDD 5, HDDI/O Devices 2, onboard 1Gb ports 2, onboard 1Gb ports2, onboard 1Gb ports+ 2, 1Gb(4ch) NIC<strong>Power</strong> Supply Number <strong>and</strong> Redundancy Configuration 1, Non Redundancy 1, Non Redundancy 1, Non RedundancyManagement Controller or Service Processor Installed? Yes Yes YesOther Hardware Features / AccessoriesIdle Category (1S <strong>and</strong> 2S only)Minimum Typical Maximum<strong>ENERGY</strong> <strong>STAR</strong> Idle <strong>Power</strong> Allowance (1S <strong>and</strong> 2S only) 65.0 97.0 169.0Measured Idle <strong>Power</strong> (watts) 39.28 48.36 83.64<strong>Power</strong> at Full Load* (watts) 66.86 86.70 129.60Benchmark / Method Used for Full Load TestTest Voltage <strong>and</strong> Frequency for Idle <strong>and</strong> Full Load TestRange of Total Estimated Energy Usage ** (kWh/year) 0,688 to 1,171 0,847 to 1,519 1,465 to 2,271Link to Detailed <strong>Power</strong> Calculator (if available)Benchmark Used <strong>and</strong> Type of WorkloadMinimum Typical MaximumSiSoftware S<strong>and</strong>ra Engineer 2010 / .NET Multi-MediaAvg. <strong>Power</strong> Measured During Benchmark Run 66.86 86.70 129.60Benchmark <strong>Performance</strong> Score 14.6 14.54 14.74<strong>Power</strong> <strong>Performance</strong> Ratio (perf score/avg. power) 0.21837 0.16770 0.11373Link to Full Benchmark Report (Where Available)Category B: Managed Single Installed Processor (1P) ServersSiSoftware S<strong>and</strong>ra Engineer 2010 / .NET Multi-Media230V / 60Hz* Note: Full load power represents the sustained, average power at 100% load of the given workload, <strong>and</strong> does not necessarily represent the absolute peak power or thehighest average, sustained power possible for other workloads.** Note: Estimated kWh/year gives the absolute range of energy use a user could expect from continuous operation (24x7x365) <strong>and</strong> ranges from 100% Idle usage to 100%full load operation. The calculation also includes typical data center overhead at a ratio of 1 watt of overhead to every 1 watt of IT load (corresponding to a PUE of 2.0).Closer approximations may be found by using established power calculators <strong>and</strong> specific information about the intended operating environment (e.g., average time at Idle,data center PUE, etc.).<strong>Power</strong> <strong>and</strong> <strong>Performance</strong> for Benchmark #1<strong>Power</strong> <strong>and</strong> <strong>Performance</strong> for Benchmark #2 (optional)Benchmark #2Benchmark Used <strong>and</strong> Type of WorkloadAvg. <strong>Power</strong> Measured During Benchmark RunBenchmark <strong>Performance</strong> Score<strong>Power</strong> <strong>Performance</strong> Ratio (perf score/avg. power)Link to Full Benchmark Report (Where Available)Minimum Typical Maximum
<strong>ENERGY</strong> <strong>STAR</strong> <strong>Power</strong> <strong>and</strong> <strong>Performance</strong> <strong>Data</strong> <strong>Sheet</strong>Express5800/GT110d-S [Xeon E3-1220 model]Page 3 of 3<strong>ENERGY</strong> <strong>STAR</strong> Qualified Configurations (Continued)Include specific information on <strong>ENERGY</strong> <strong>STAR</strong> Qualified SKUs or configurations